. 2022 Jun;7(6):868-881.
doi: 10.1038/s41564-022-01104-0. Epub 2022 Apr 28.

Screening the Toxoplasma kinome with high-throughput tagging identifies a regulator of invasion and egress

Affiliations

Screening the Toxoplasma kinome with high-throughput tagging identifies a regulator of invasion and egress

Tyler A Smith et al. Nat Microbiol. 2022 Jun.

Abstract

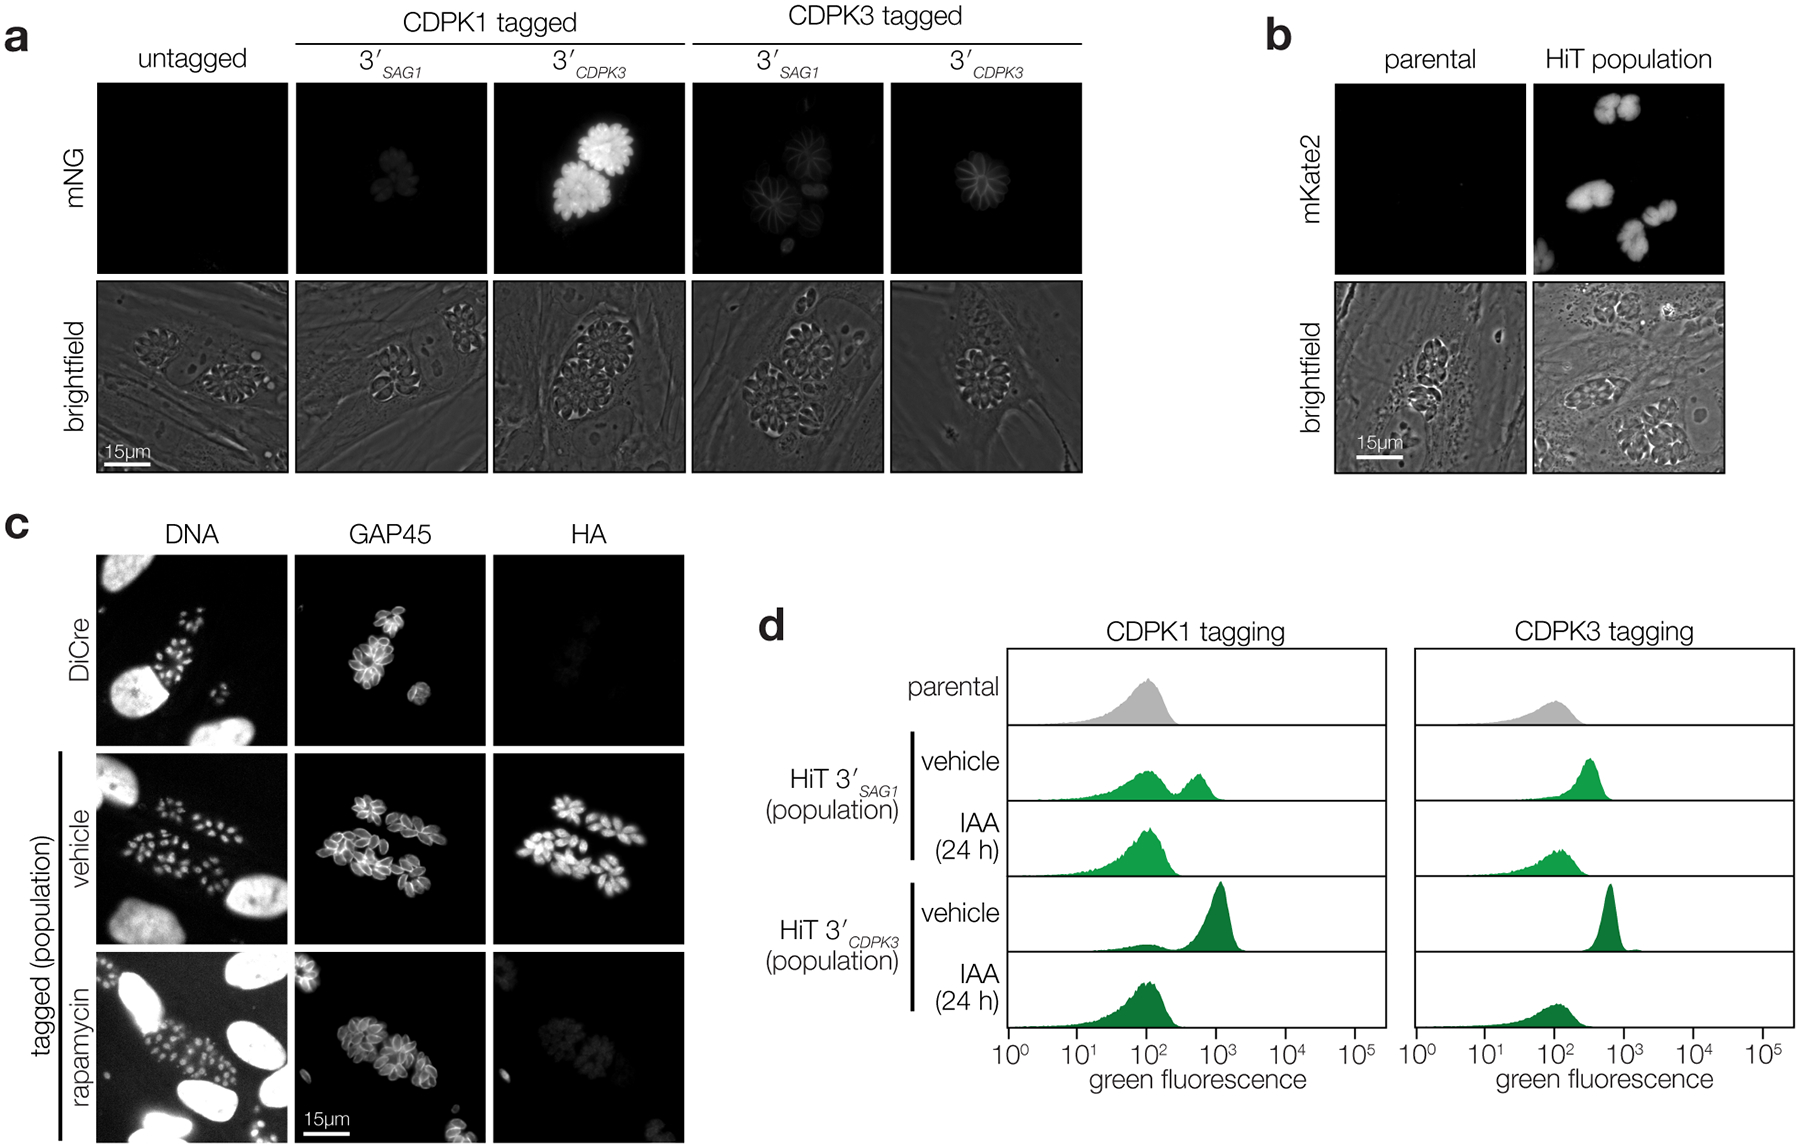
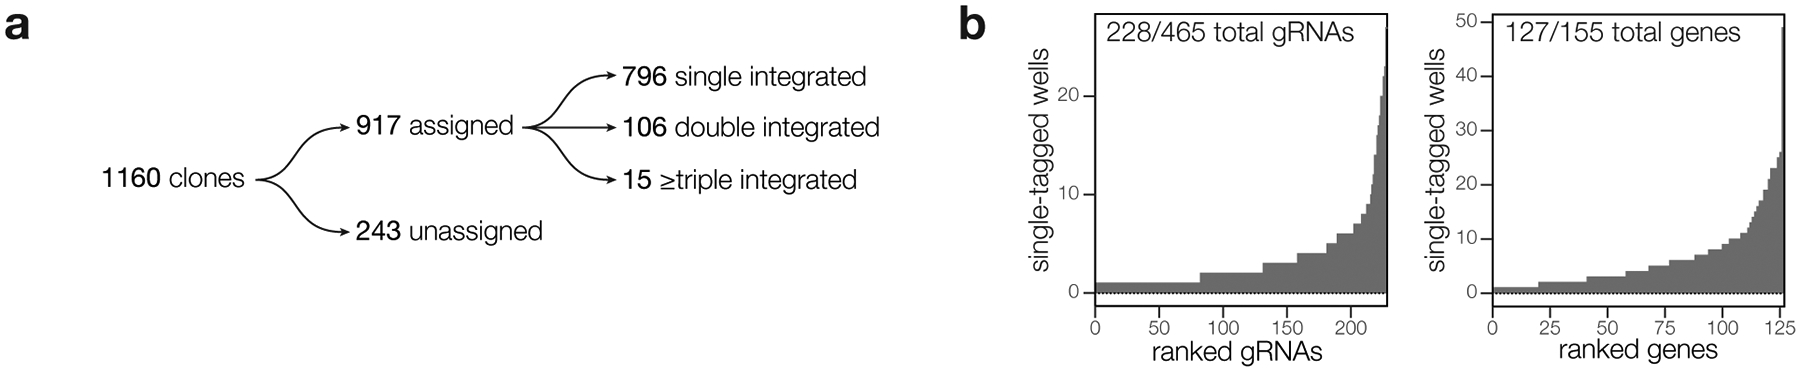
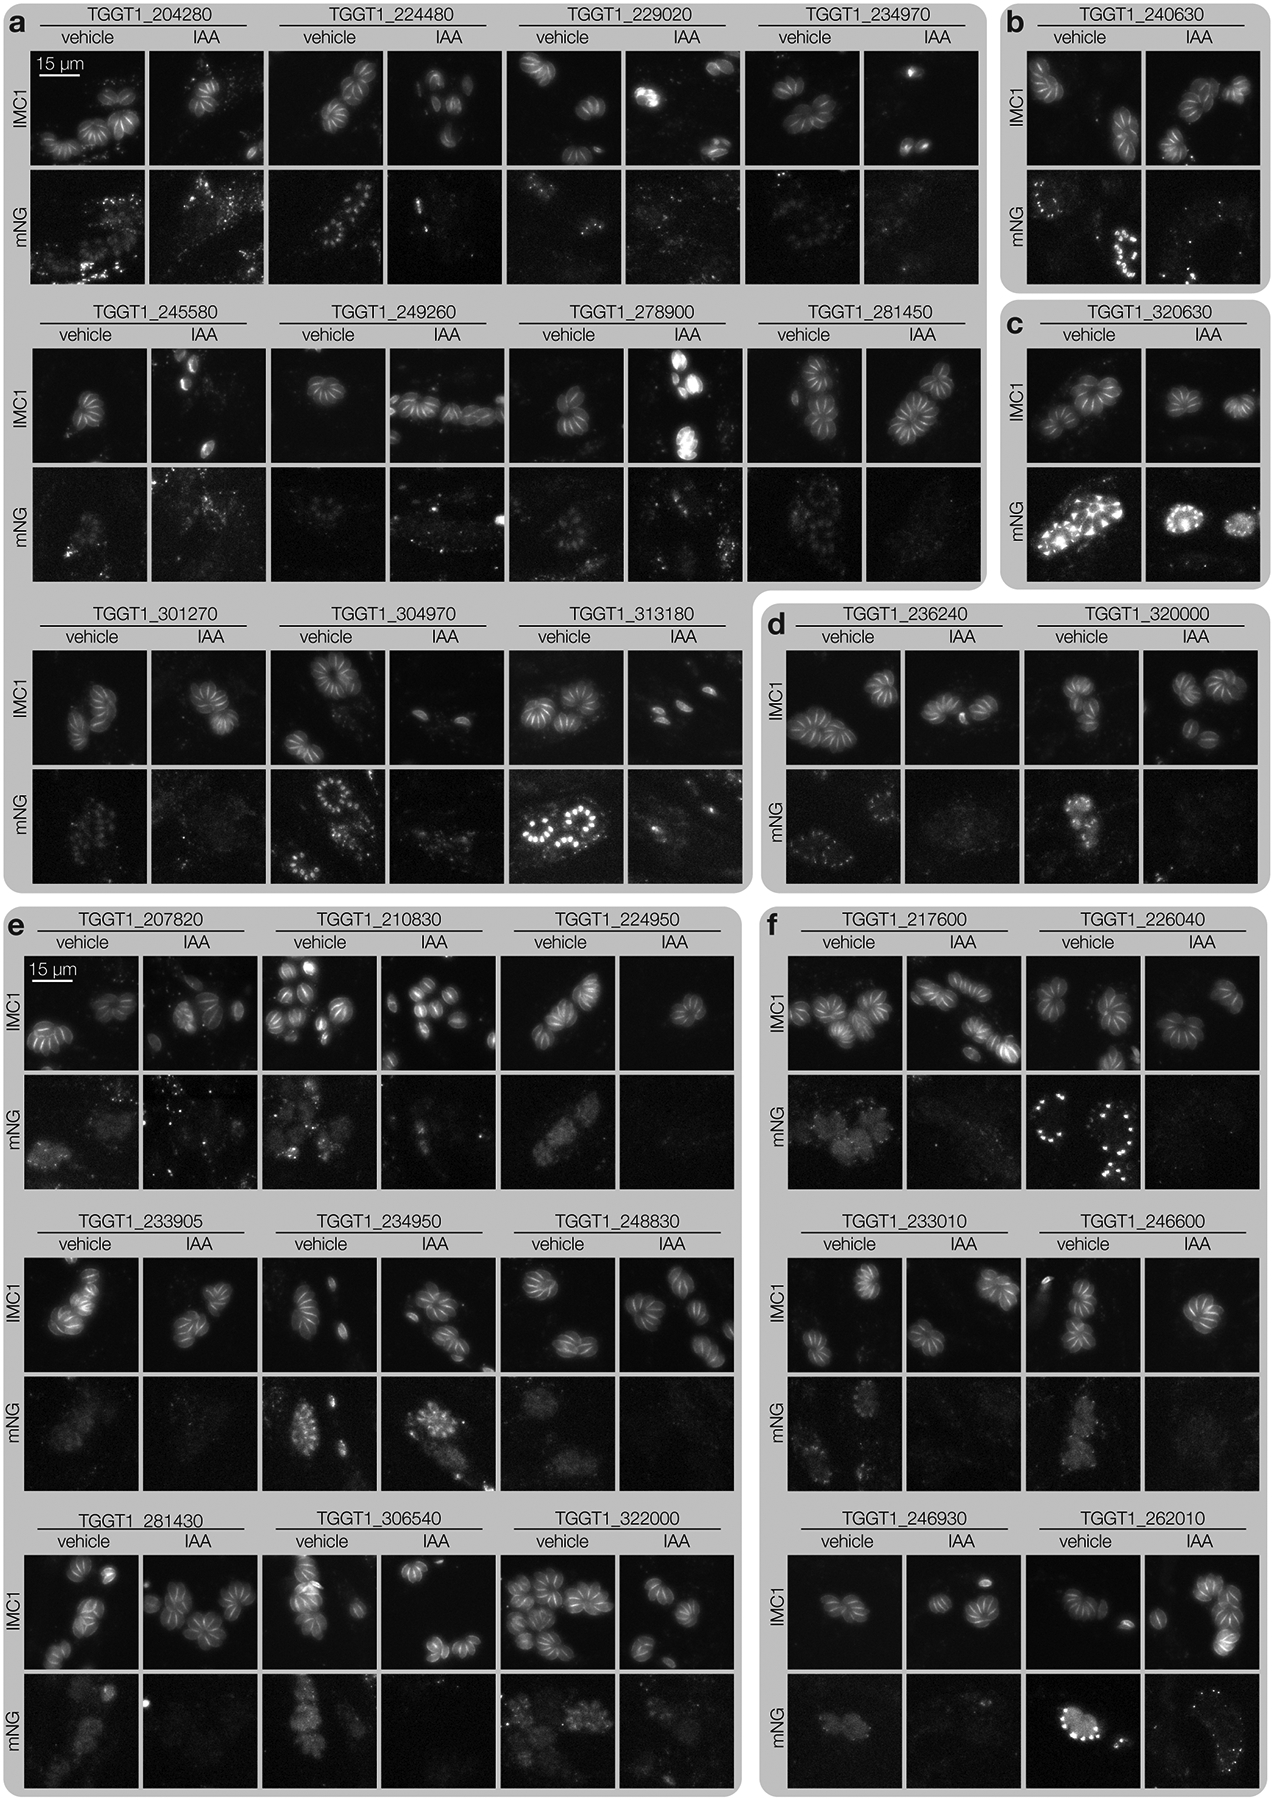
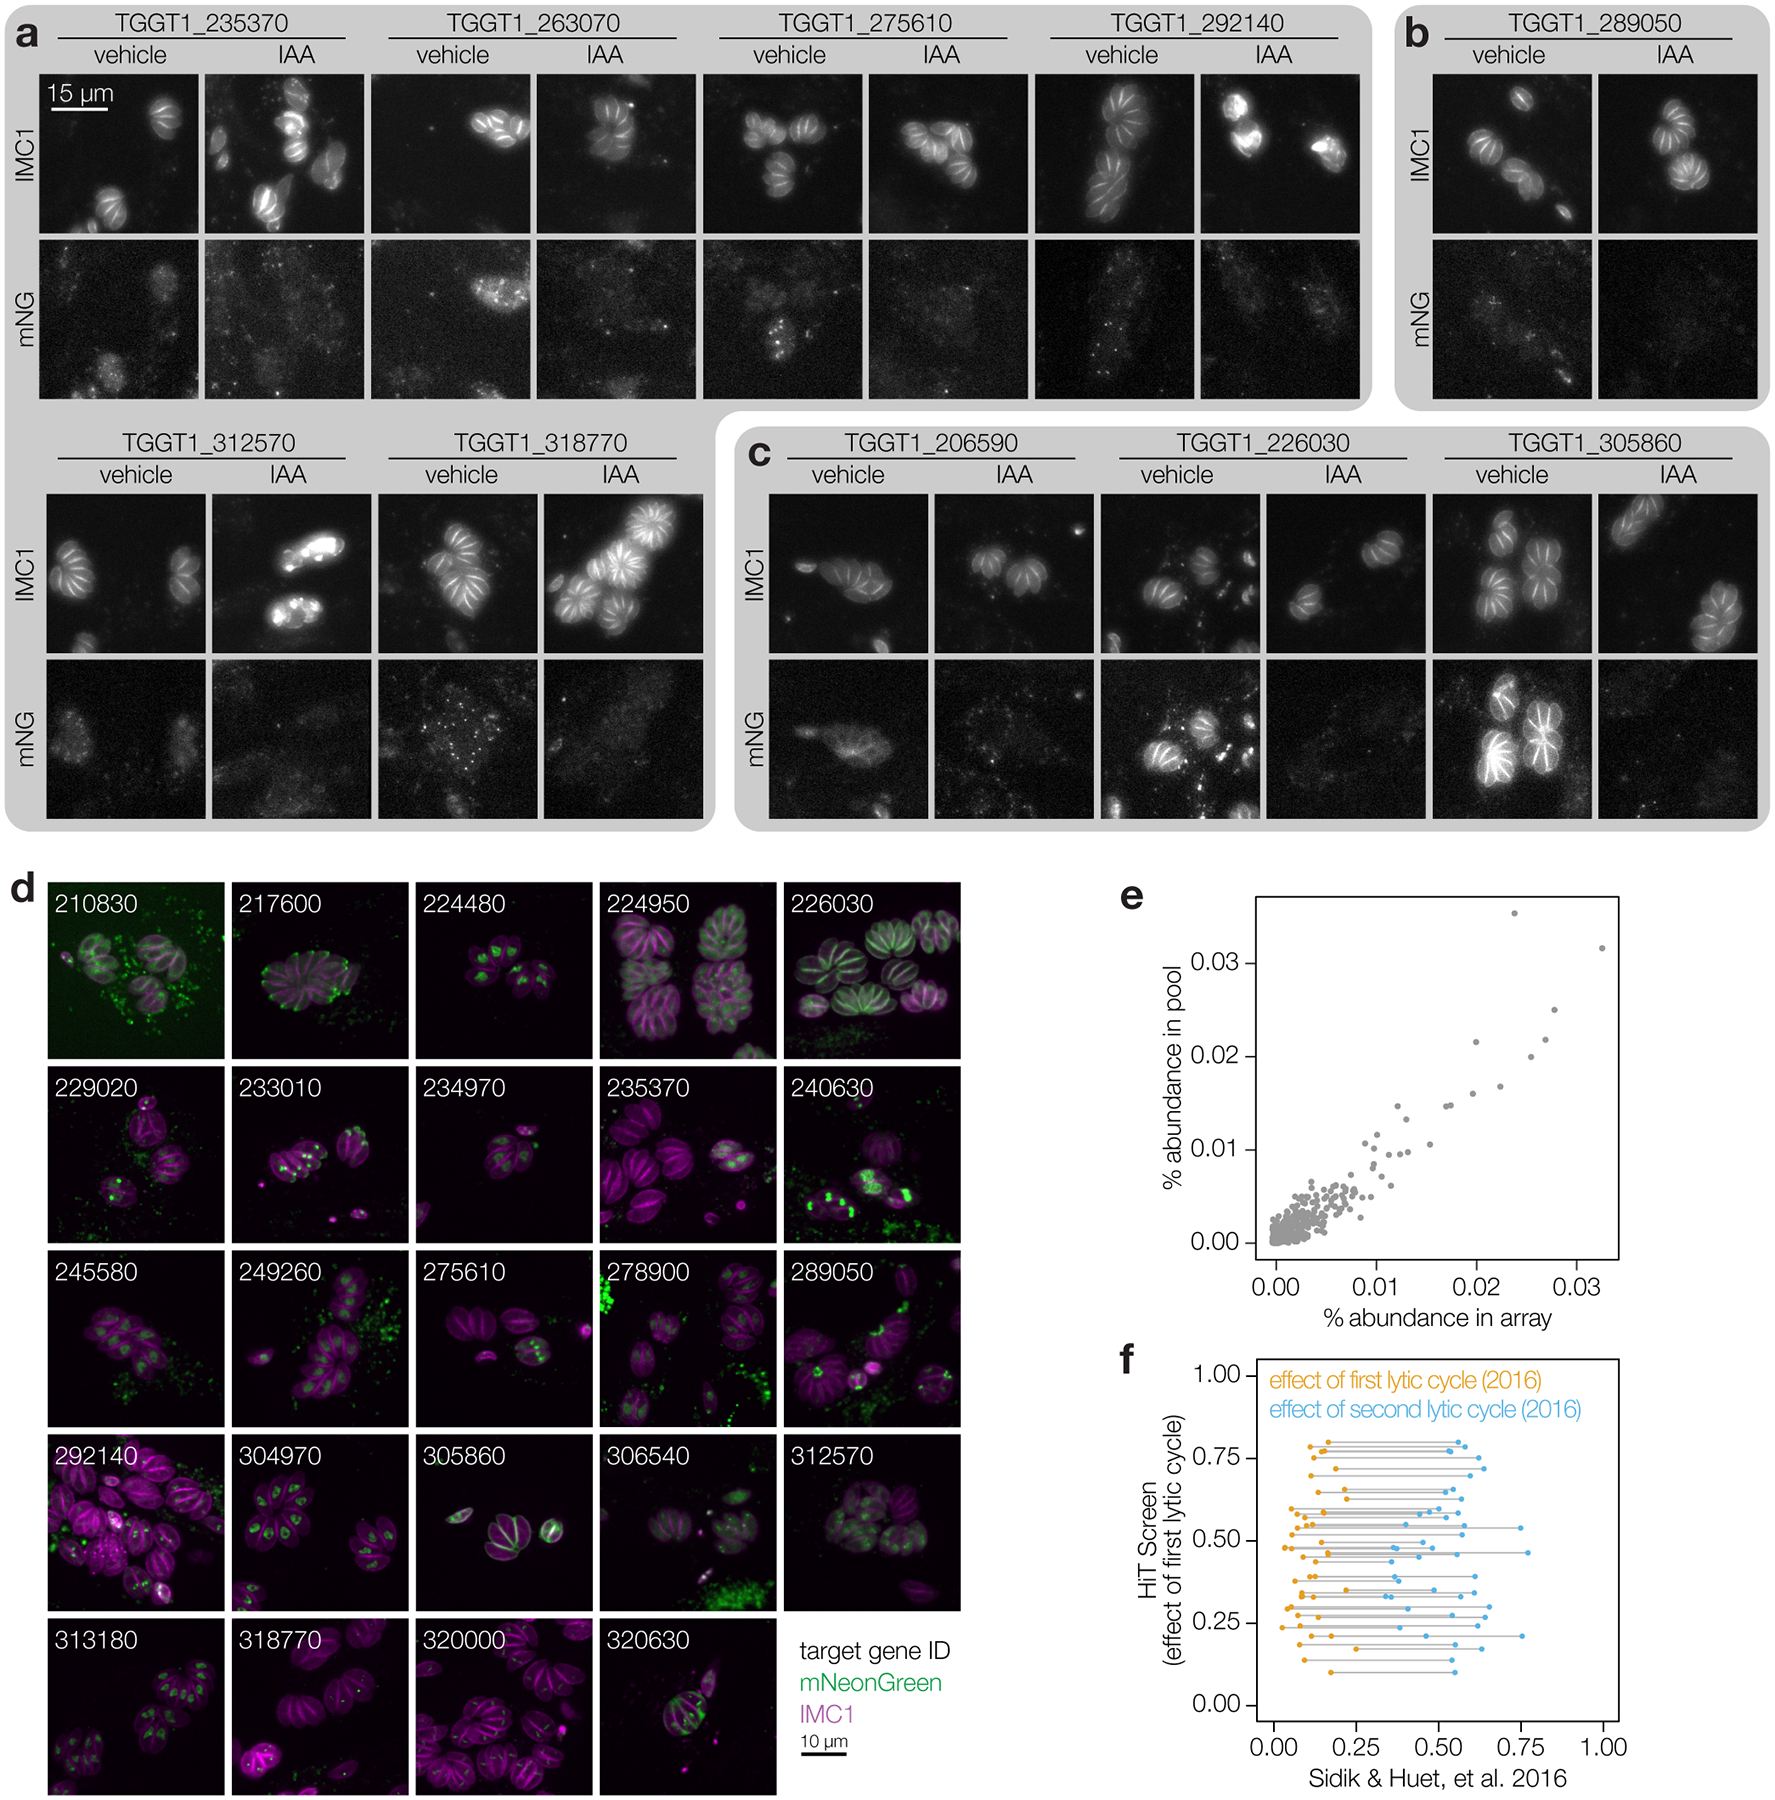
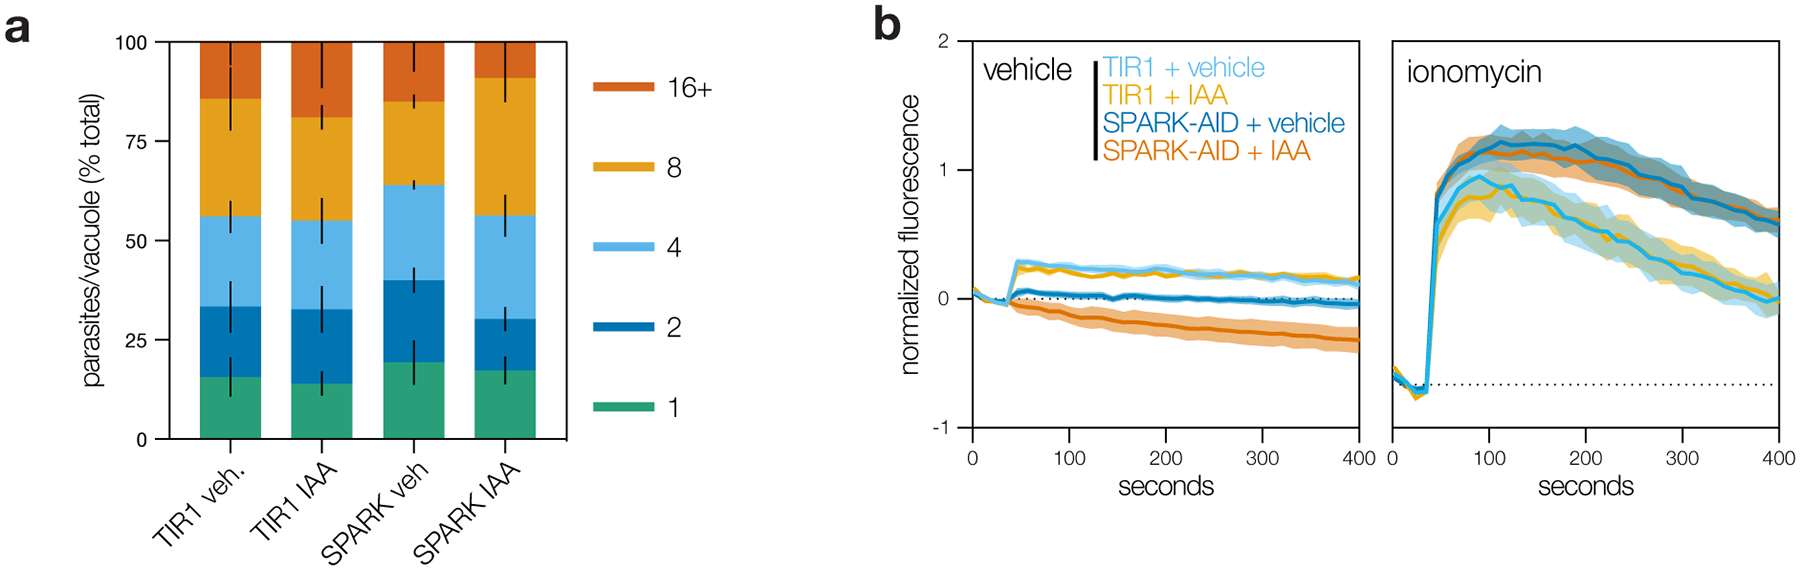
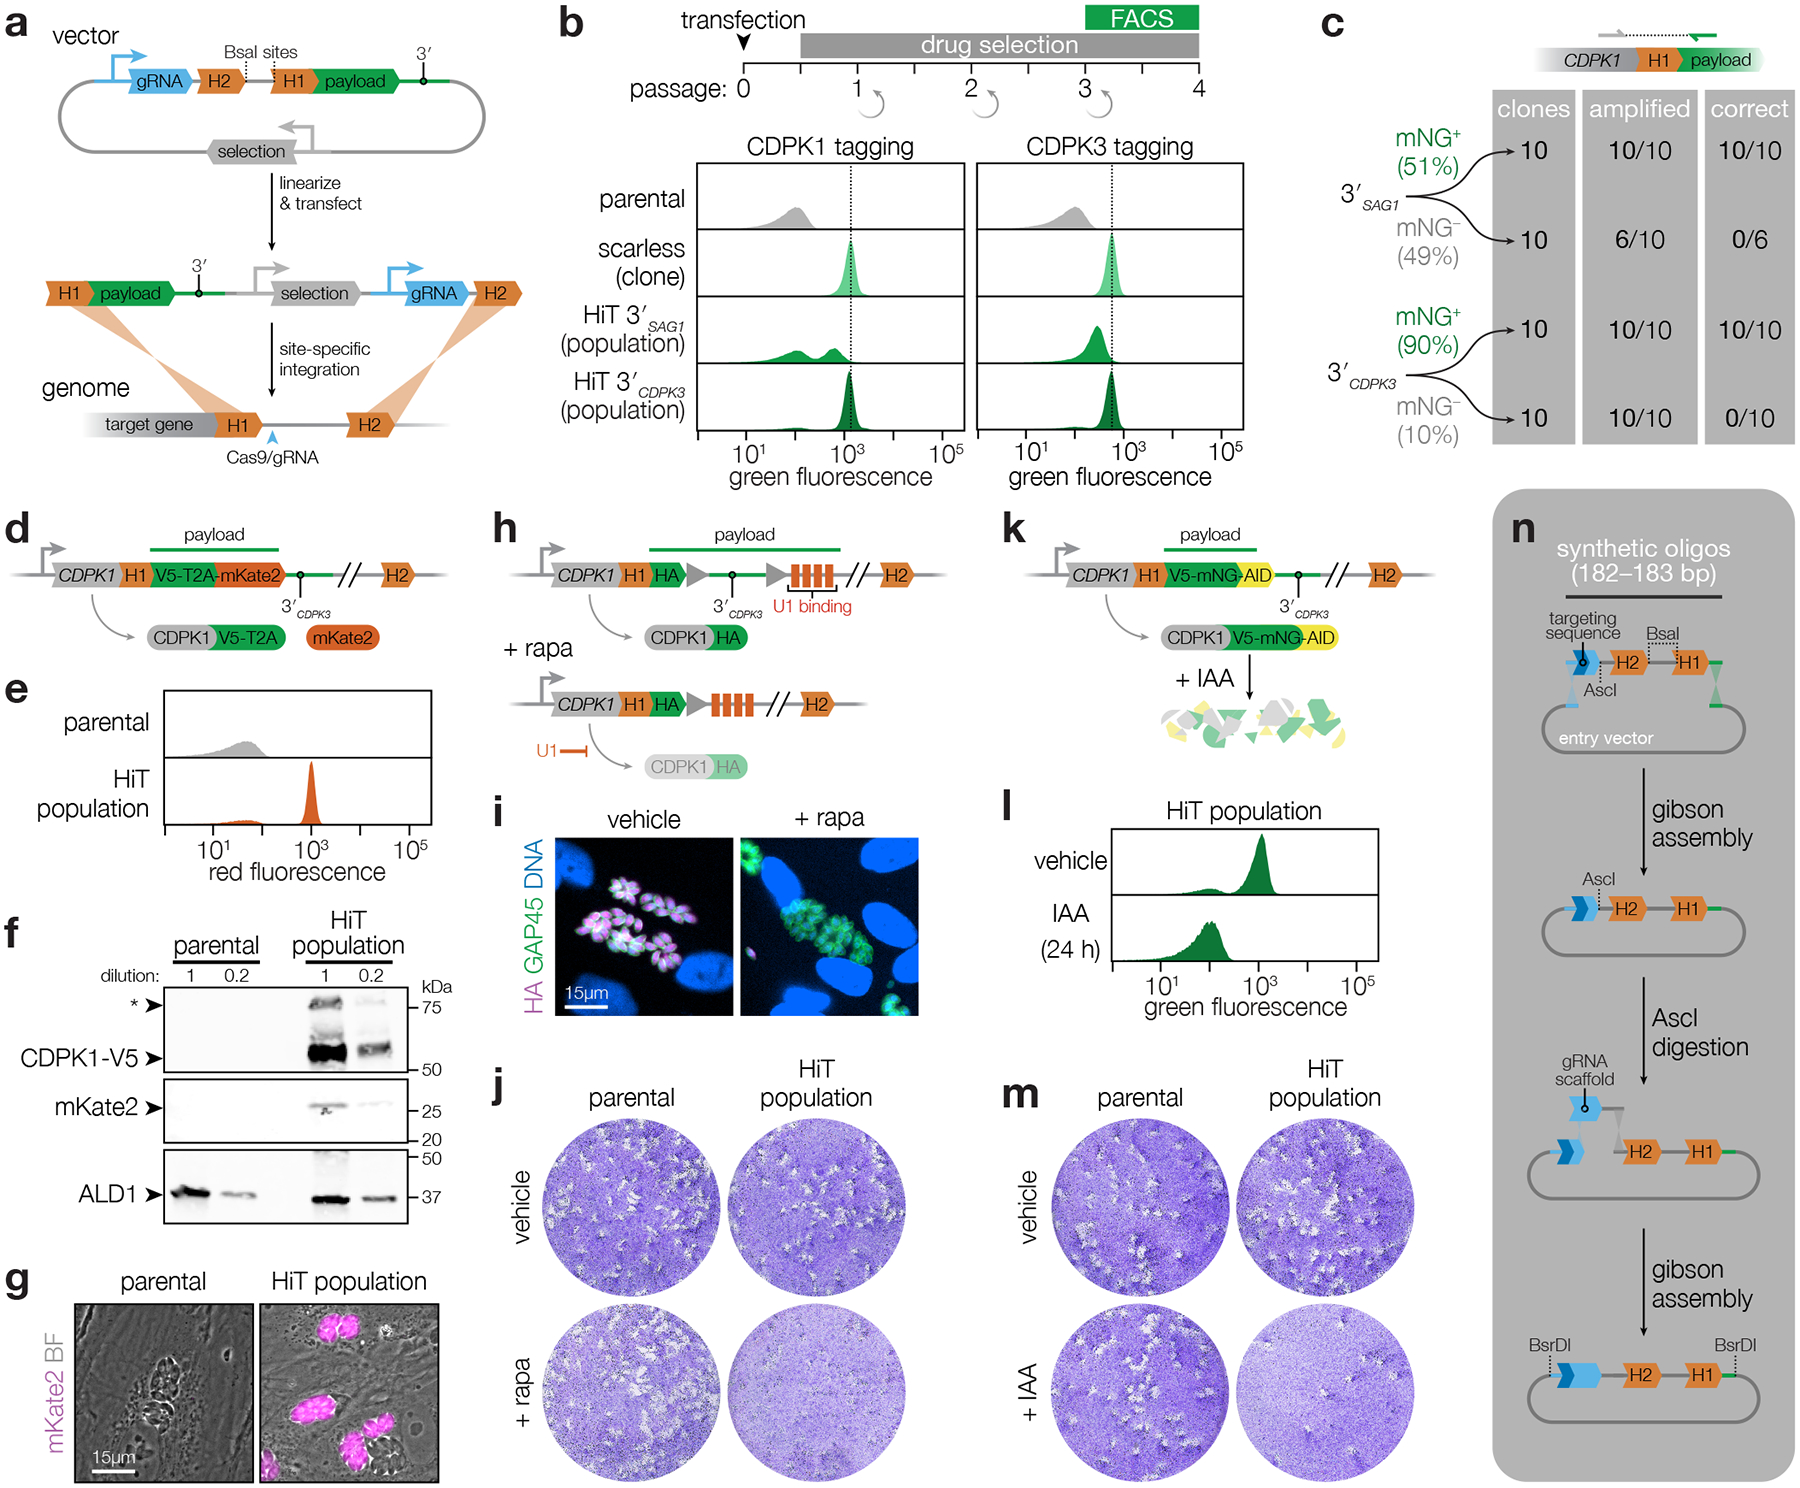
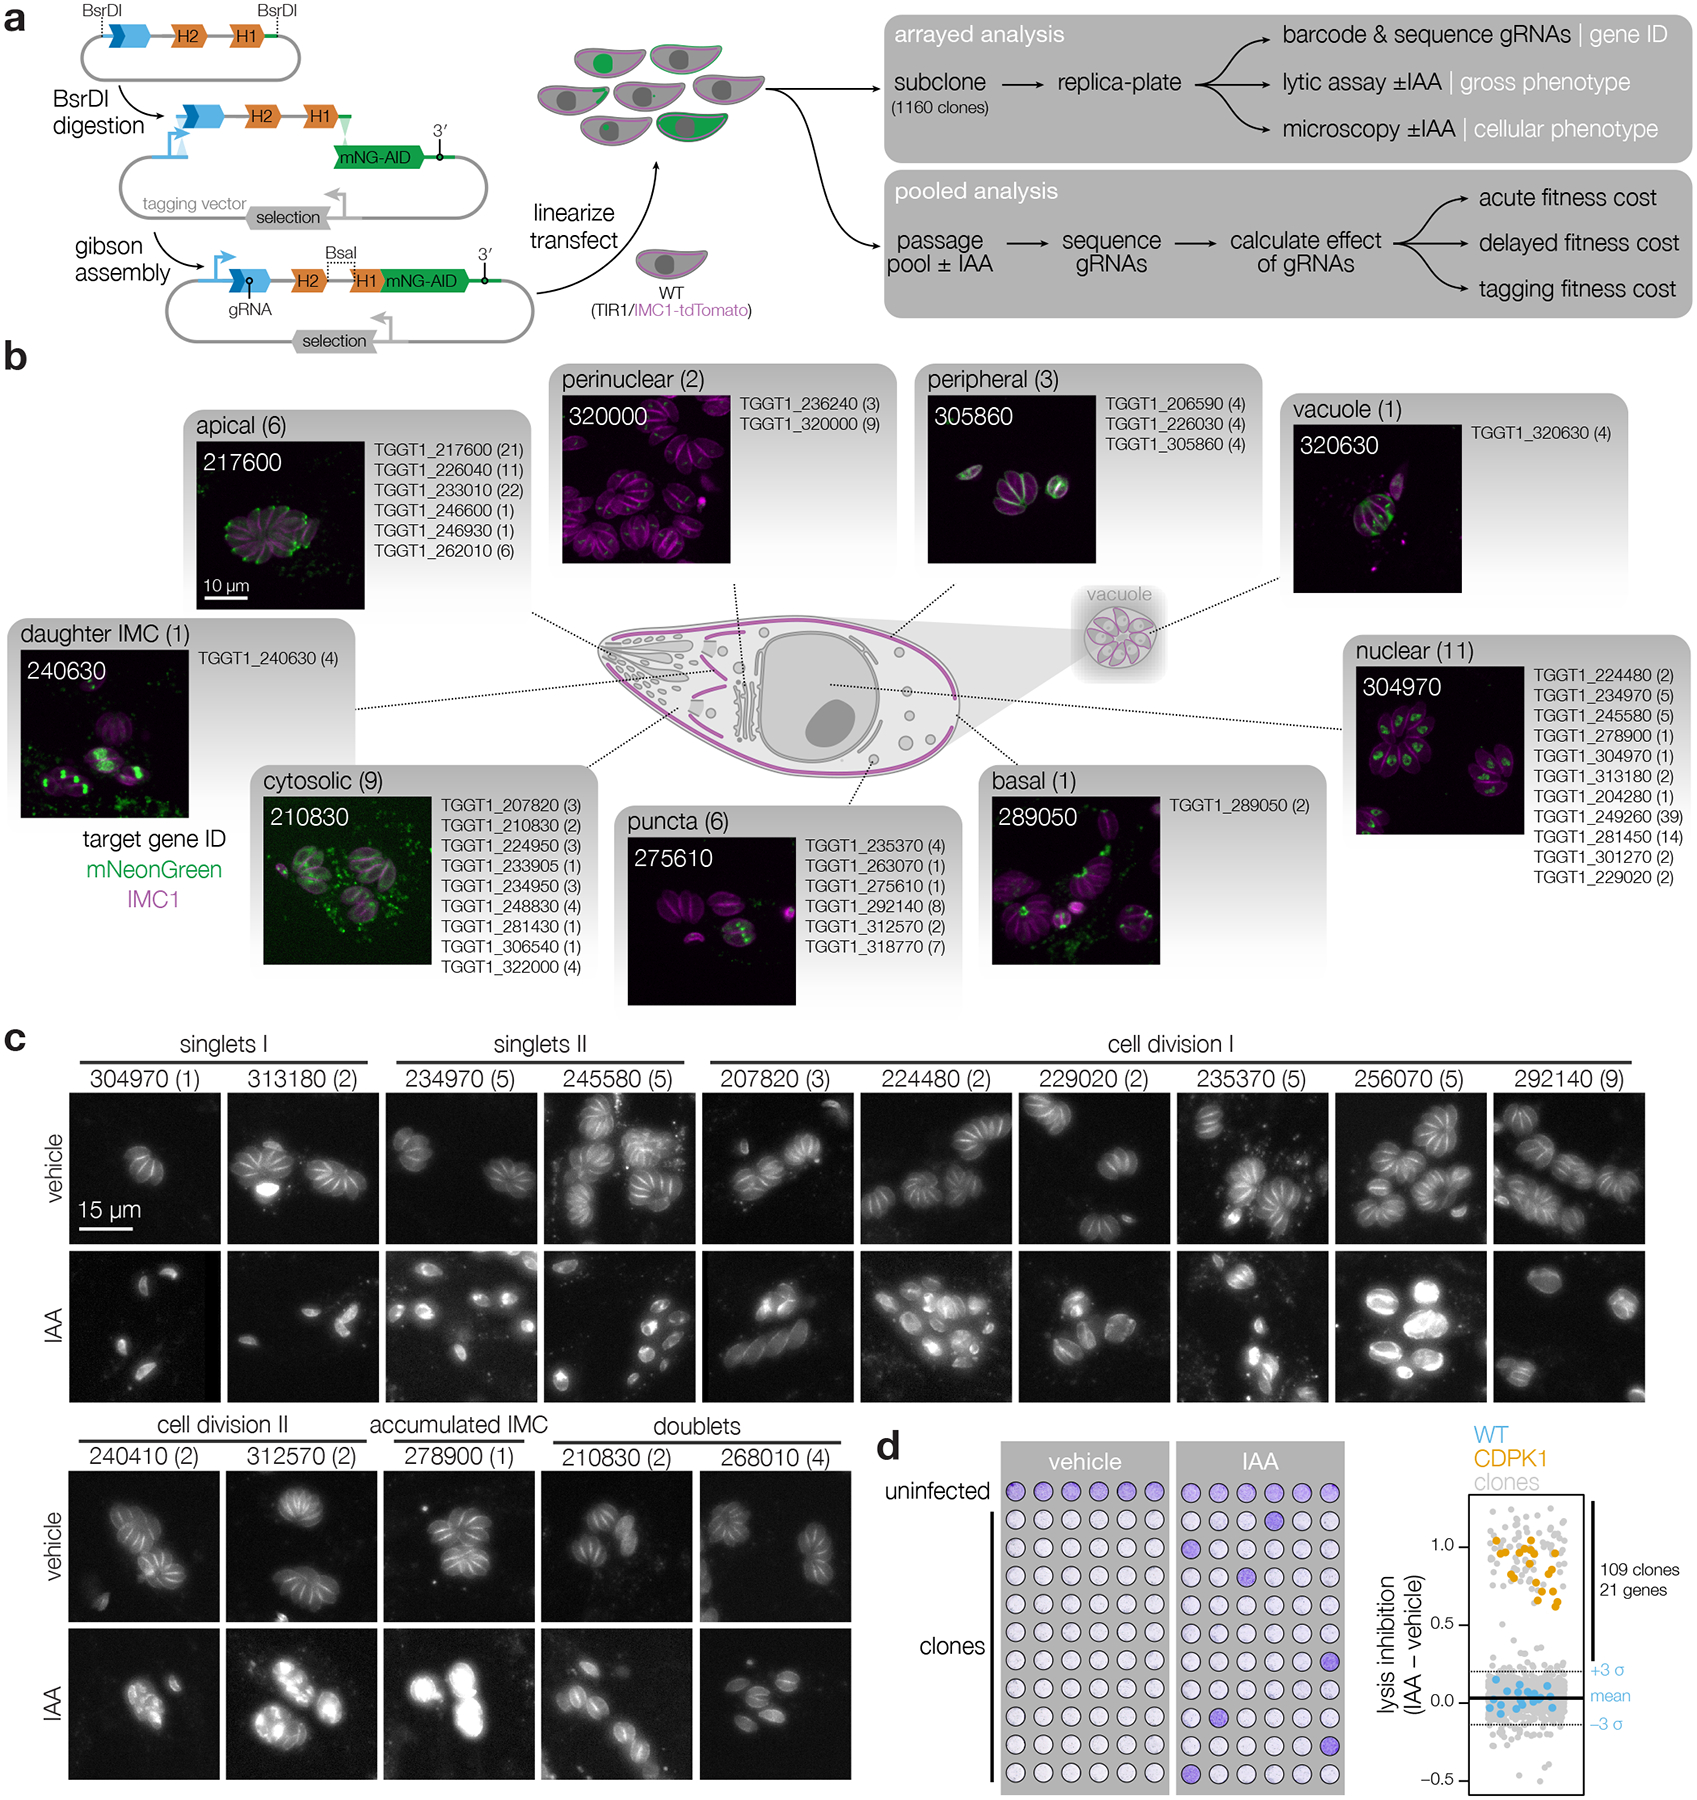
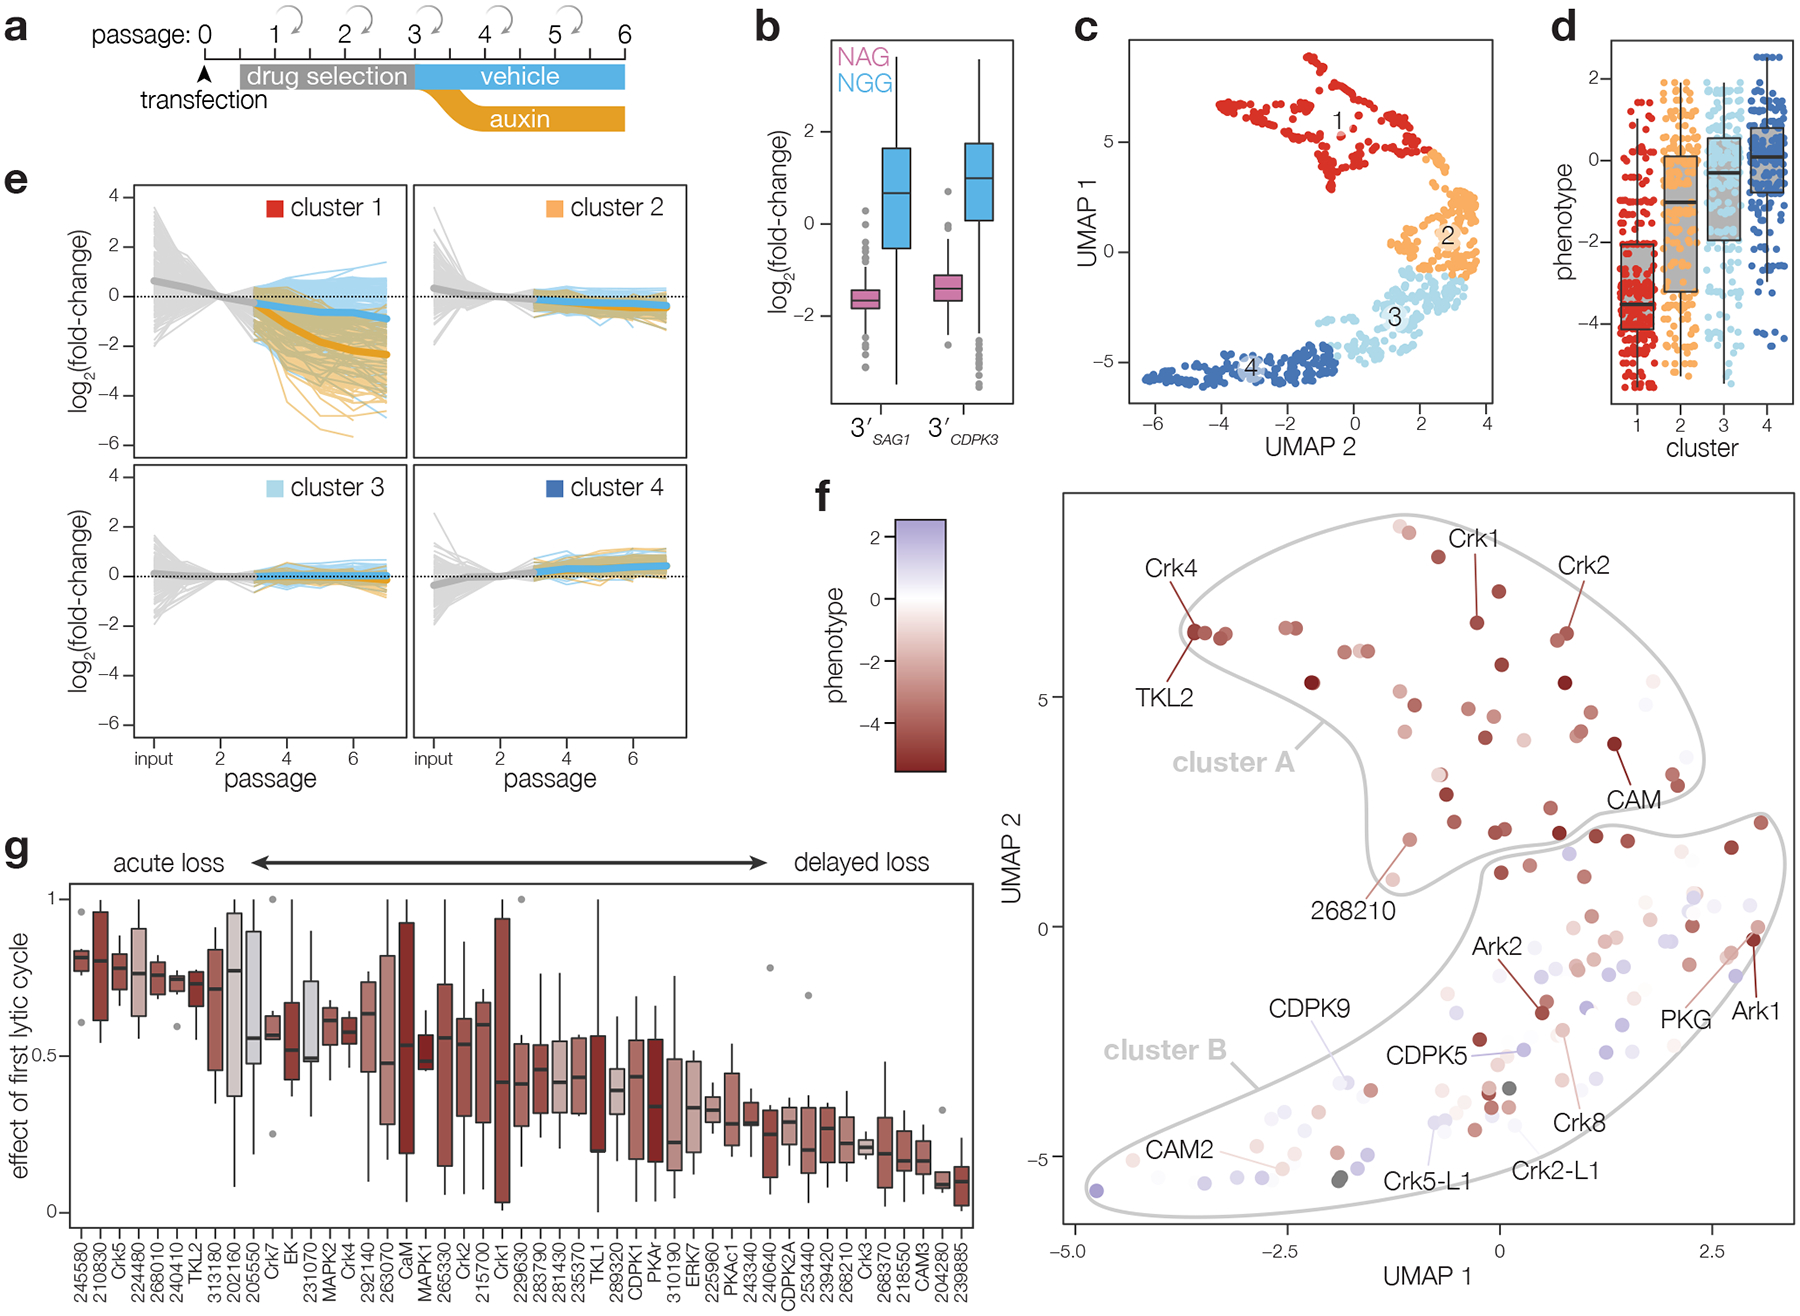
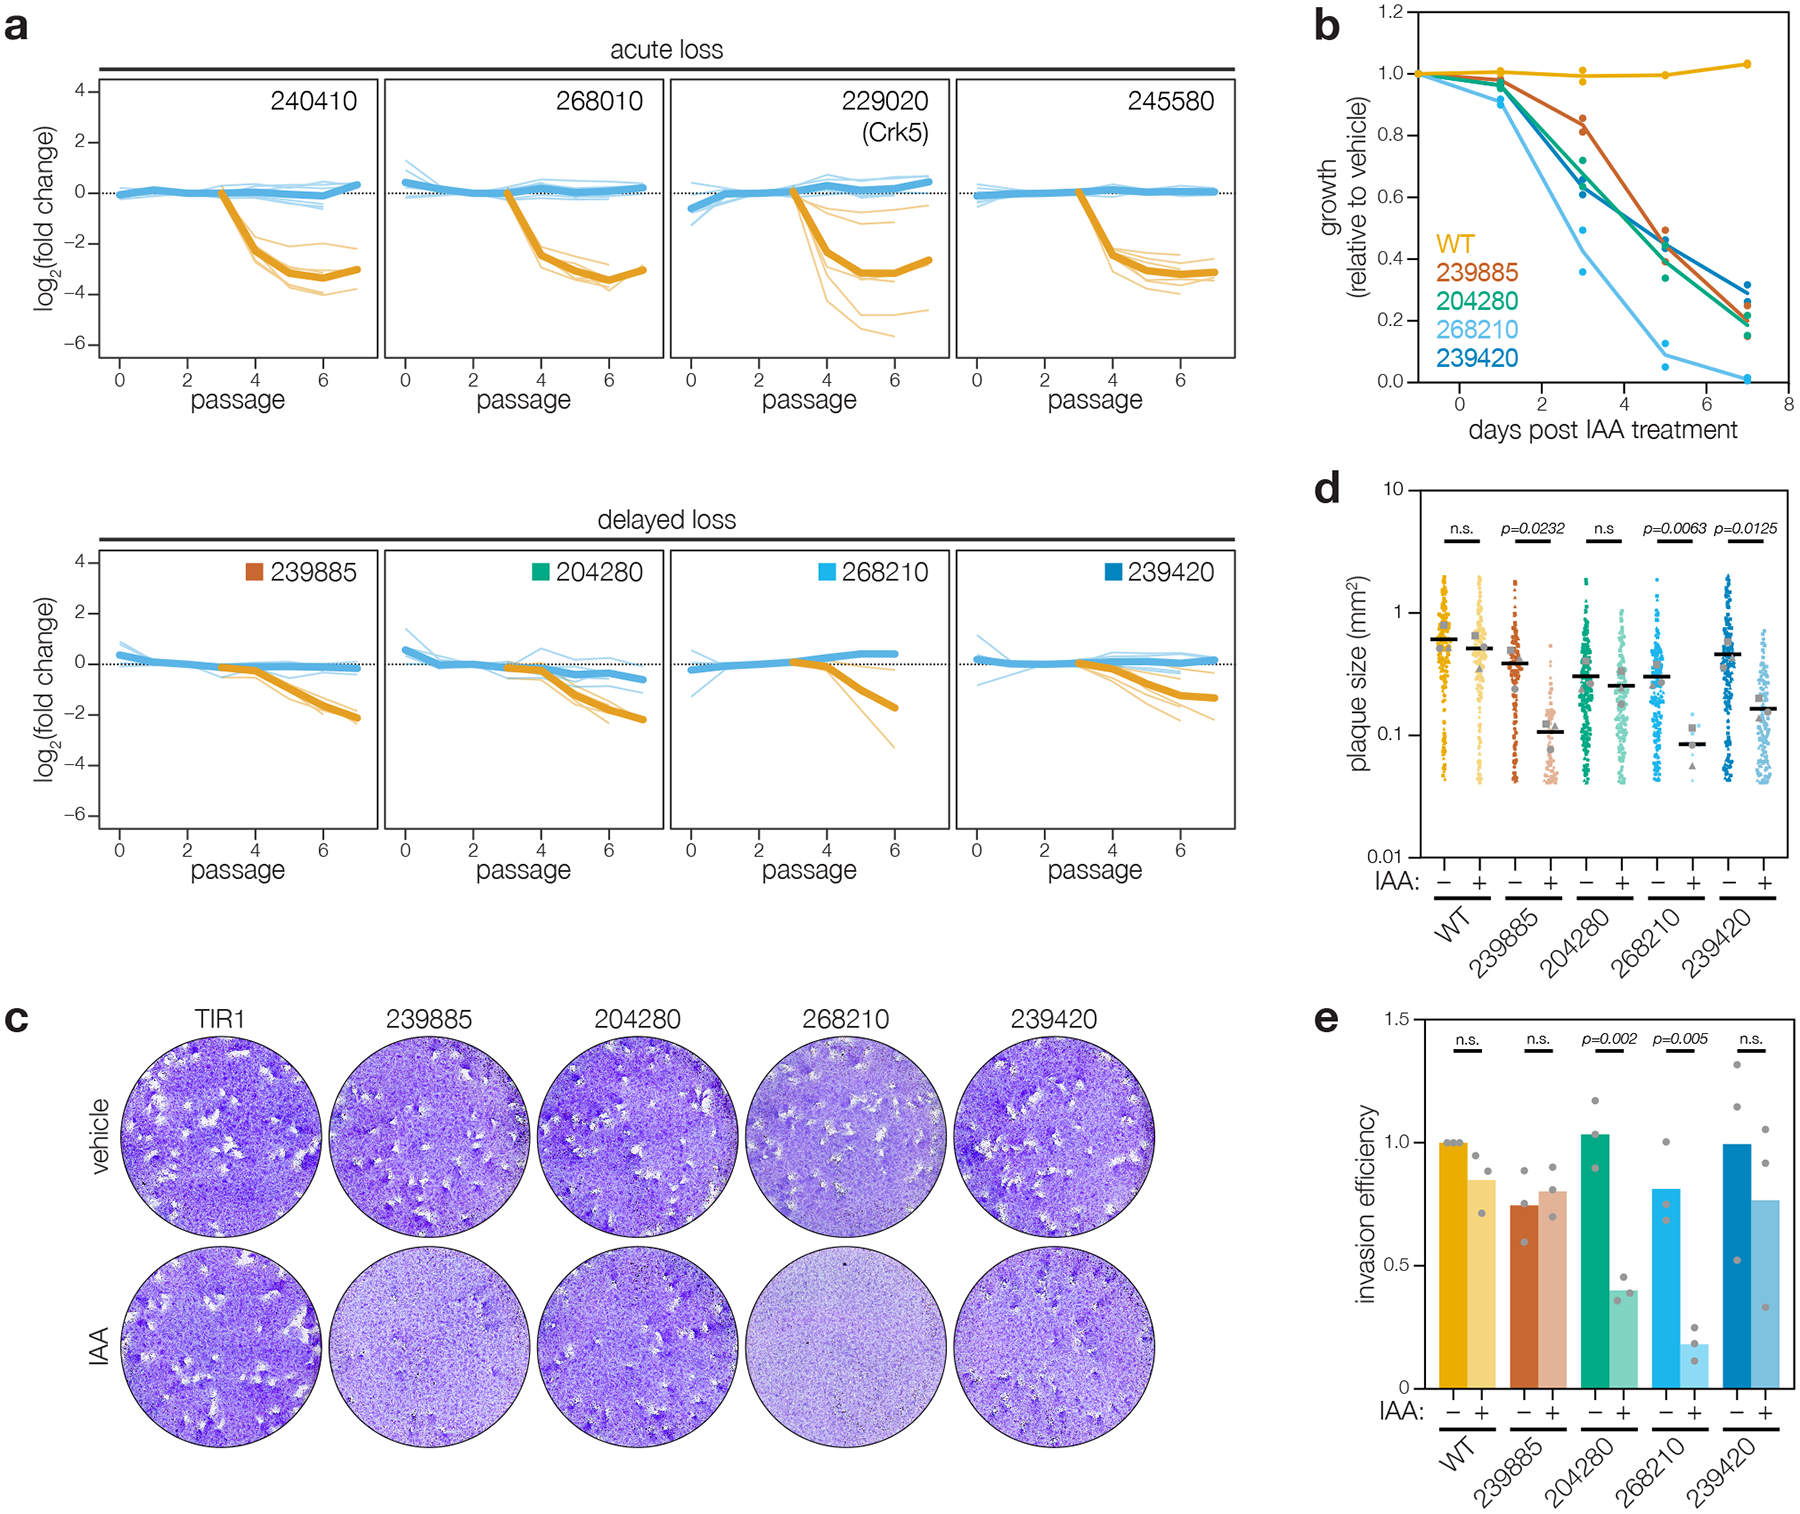
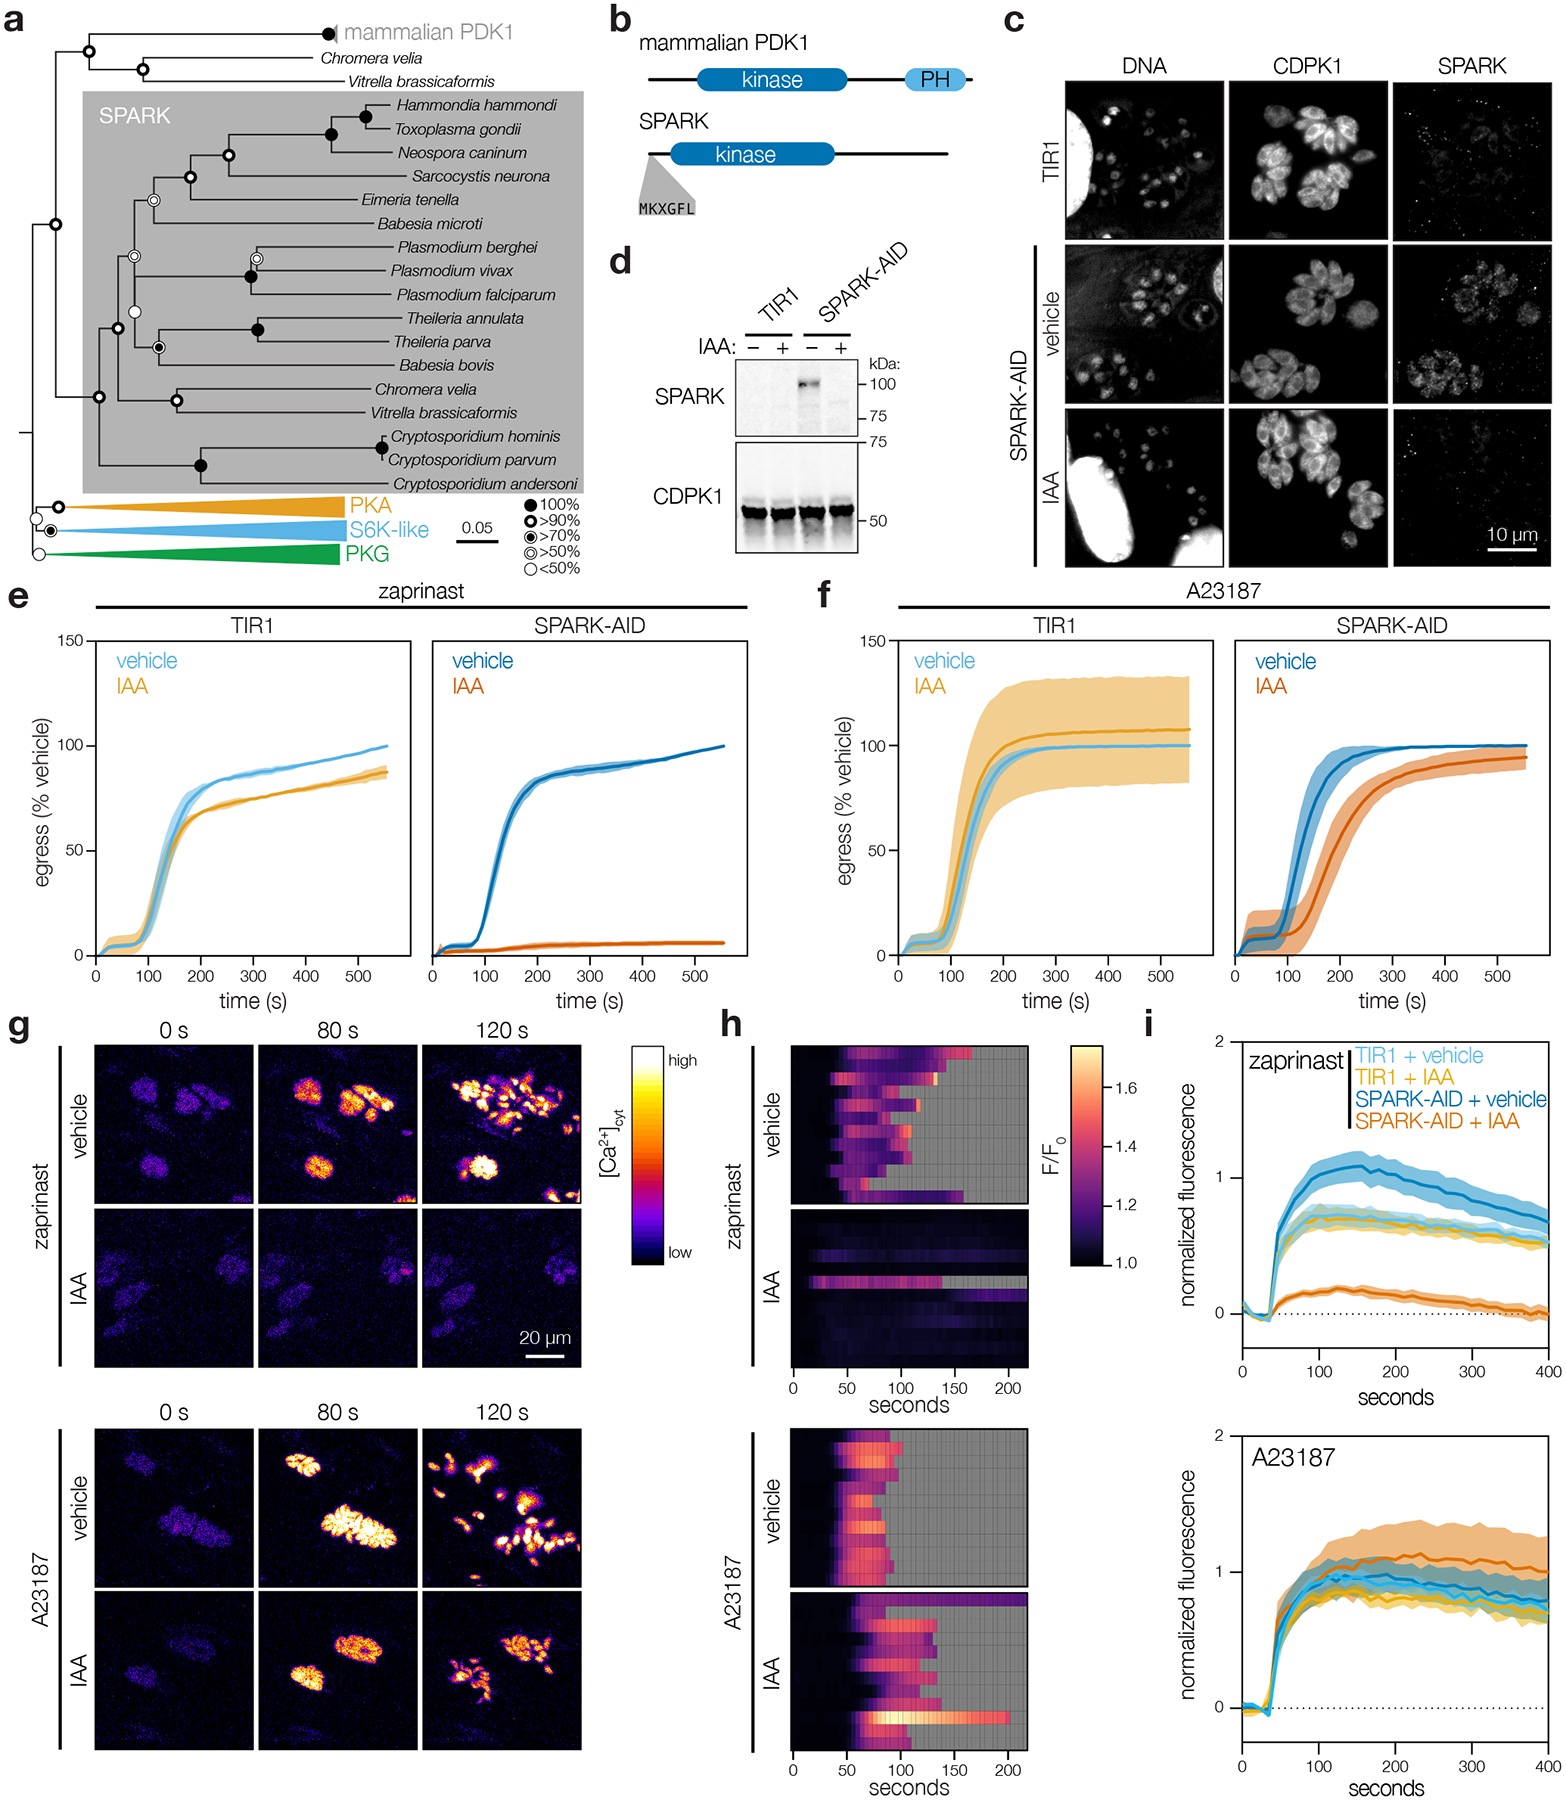
Protein kinases regulate fundamental aspects of eukaryotic cell biology, making them attractive chemotherapeutic targets in parasites like Plasmodium spp. and Toxoplasma gondii. To systematically examine the parasite kinome, we developed a high-throughput tagging (HiT) strategy to endogenously label protein kinases with an auxin-inducible degron and fluorophore. Hundreds of tagging vectors were assembled from synthetic sequences in a single reaction and used to generate pools of mutants to determine localization and function. Examining 1,160 arrayed clones, we assigned 40 protein localizations and associated 15 kinases with distinct defects. The fitness of tagged alleles was also measured by pooled screening, distinguishing delayed from acute phenotypes. A previously unstudied kinase, associated with a delayed phenotype, was shown to be a regulator of invasion and egress. We named the kinase Store Potentiating/Activating Regulatory Kinase (SPARK), based on its impact on intracellular Ca2+ stores. Despite homology to mammalian 3-phosphoinositide-dependent protein kinase-1 (PDK1), SPARK lacks a lipid-binding domain, suggesting a rewiring of the pathway in parasites. HiT screening extends genome-wide approaches into complex cellular phenotypes, providing a scalable and versatile platform to dissect parasite biology.


Conflict of interest statement

COMPETING INTERESTS STATEMENT

The authors declare no competing interests.

Figures

Extended Data Fig. 1
Extended Data Fig. 1. Transfected populations efficiently incorporate a variety of HiT vectors.
a, Fluorescence microscopy of the tagged populations displaying the correct localization of each kinase and expression levels consistent with flow cytometry (Fig. 1b). b, Live microscopy of V5-T2A-mKate2 HiT-tagged population (merged image in Fig. 1g). c, Immunofluorescence microscopy of population tagged with the HA-U1 HiT vector following treatment with rapamycin or vehicle control (merged image in Fig. 1i). d, Flow cytometry of parasite populations tagged with the V5-mNG-mAID HiT vector targeting CDPK1 or CDPK3 and treated with either IAA or vehicle control for 24 h (excerpt shown in Fig. 1l).
Extended Data Fig. 2
Extended Data Fig. 2. Arrayed screening results.
a, Results from dual-indexed sequencing of the arrayed clones. A minimum of 100 reads were required to assign a given gRNA to a particular clone. Cases where a second gRNA reached >10% the abundance of the first gRNA were classified as containing multiple integrations. b, Histogram showing the distribution of gRNAs and genes contained among single-integrated wells within the array. Genes and gRNAs with no representation are omitted from the plot.
Extended Data Fig. 3
Extended Data Fig. 3. Representative images from the arrayed screen.
a–f, Widefield microscopy of representative clones. Maximum intensity projections for IMC1-tdTomato and mNeonGreen-tagged targets are displayed for cultures treated with either IAA or vehicle for 24 hours. All images are displayed at the same scale. Localizations to the nucleus (a), daughter cell IMC (b), parasitophorous vacuole (c), perinuclear space (d), cytosol (e) or apical end (f) were assigned to a gene if half or more of single-integrated wells for that gene displayed consistent localizations.
Extended Data Fig. 4
Extended Data Fig. 4. Additional representative images from the arrayed screen and comparisons to the pooled results.
a–c, Widefield microscopy of representative clones. Maximum intensity projections for IMC1-tdTomato and mNeonGreen-tagged targets are displayed for cultures treated with either IAA or vehicle for 24 hours. All images are displayed at the same scale. Localizations to puncta (a), the basal end (b), or peripheral structures (c) were assigned to a gene if half or more of single-integrated wells for that gene displayed consistent localizations. d, Representative confocal images of a sample of clones. mNeonGreen (green); IMC1-tdTomato (magenta). Images are maximum intensity projections. Genes are numbered based on the unique identifier from ToxoDB (e.g., TGGT1_210830, labeled 210830). e, Comparison of relative gRNA abundances in the array compared to the pooled population that was subcloned. Spearman correlation coefficient = 0.77. f, Impact of the initial lytic cycles on gRNA abundance for genes with delayed or acute loss phenotypes in the HiT screen. The effect of the first lytic cycle from the HiT screen is plotted against the effect of the first or second lytic cycles for the genome-wide knockout screen (Sidik & Huet, et al. 2016). Genes are paired across their first and second lytic cycles within the genome-wide knockout screen.
Extended Data Fig. 5
Extended Data Fig. 5. Extended analysis of SPARK depletion.
a, Replication assay of SPARK-AID parasites. Parasites were treated with either IAA or vehicle at 3 hours post-invasion and imaged 24 hours later. The number of parasites per vacuole were counted for 100 vacuoles per sample. Mean ± S.E. graphed for n = 3 biological replicates. b, Extracellular parasites in basal Ca2+ buffer stimulated with vehicle or the Ca2+ ionophore ionomycin, following 24 h of treatment with vehicle or IAA. Cytosolic Ca2+ flux was measured in bulk as GCaMP6f fluorescence normalized to the initial and maximum fluorescence following aerolysin permeabilization in 2 mM Ca2+. Mean ± S.E. graphed for n = 3–6 biological replicates.
Figure 1.
Figure 1.. Development of high-efficiency tagging (HiT) constructs for protein-centered screening approaches.
a, Schematic of the high-throughput tagging (HiT) vector. The BsaI-linearized vector is cotransfected with a Cas9-expression plasmid into parasites to mediate homologous recombination of the construct into the target locus. H1 and H2 indicate 40-bp regions of homology to the target locus. Pyrimethamine selection was used to isolate integration events. A heterologous 3′ UTR is included in the vector following the tagging payload. b, Efficiency of HiT vector tagging. Parental TIR1 parasites were transfected with HiT 3′SAG1 or HiT 3′CDPK3 vectors targeting CDPK1 or CDPK3 with a tagging payload encoding mNeonGreen fused to the minimal auxin-induced degron (mAID). Following selection, the populations were analyzed by flow cytometry and compared to clonal strains carrying the same tag with no exogenous sequences (scarless insertion). Dotted line centered on the mode for the fluorescence of the scarless insertion. c, The 5′ integration junctions of 10 mNG positive and 10 mNG negative clones from the CDPK1 HiT 3′SAG1 and HiT 3′CDPK3 populations were amplified and sequenced. Junctions were categorized according to whether they could be amplified and exhibited the correct sequence at the recombination site. d, Schematic of CDPK1 tagged with the V5-T2A-mKate2 HiT vector. e, Flow cytometry for mKate2 fluorescence following CDPK1 tagging with the V5-T2A-mKate2 HiT vector and selection. f, Immunoblot of the CDPK1-V5-T2A-mKate2 population. Expected MW for CDPK1-V5-T2A and mKate2 are 62 kDa and 26 kDa, respectively. Asterisk denotes full-length protein due to incomplete skipping. g, Live-cell microscopy of the CDPK1-V5-T2A-mKate2 HiT population. h, Schematic of CDPK1 tagged with the HA-U1 HiT vector. i, Immunofluorescence assay demonstrating CDPK1 depletion following rapamycin (rapa) treatment. j, Plaque formation following treatment with vehicle or rapamycin for the parental strain or HA-U1 HiT population. k, Schematic of CDPK1 tagged with the V5-mNG-mAID HiT vector. l, Flow cytometry of transfected populations treated with IAA or vehicle for 24 hours. m, Plaque formation following treatment with vehicle or IAA for the parental strain or V5-mNG-mAID HiT population. n, Pooled construction of libraries with linked gRNAs and homology regions.
Figure 2.
Figure 2.. Deconvolution of protein phenotypes and localizations through high-content imaging of arrayed HiT clones.
a, Construction of the V5-mNG-mAID HiT vector library and subsequent screening strategy. Following construction and linearization of the library, the vector was co-transfected with a Cas9 expression plasmid into parasites expressing the TIR1 ligase and a fluorescent peripheral marker (TIR1/IMC1-tdTomato). Following selection, the population was analyzed by both pooled and arrayed screening. b, Distribution of subcellular localizations for tagged proteins in the array; number of proteins found in each compartment and clones analyzed for each gene indicated in parentheses. Localizations were assigned to a gene if at least half of the uniquely tagged wells for that gene displayed consistent localizations. Representative confocal images of sample clones are displayed with genes numbered based on their unique identifier (e.g., TGGT1_210830, labeled 210830). Images are maximum intensity z-projections for mNeonGreen (green) and IMC1-tdTomato (magenta). c, Widefield microscopy of representative clones with identified phenotypes. Images are maximum intensity z-projections. The IMC1-tdTomato marker is displayed for cultures treated with either vehicle or IAA for 24 h. Phenotypes were binned into six categories based on their similarity. Number of clones analyzed for each gene indicated in parenthesis. d, The ability of clones to lyse fibroblasts was assayed by infecting monolayers for 72 h in the presence or absence of IAA. Intact monolayers were visualized by crystal violet staining. Normalized absorbance measurements comparing vehicle- and IAA-treated wells are graphed for each clone. Each plate contained the parental strain (WT) and an AID-tagged CDPK1 clone (CDPK1) as controls. Mean ± S.D. for WT controls are shown.
Figure 3.
Figure 3.. Pooled screening distinguishes between acute and delayed-loss phenotypes.
a, Schematic of pooled screening workflow. Transfected populations were selected with pyrimethamine for three passages, after which they were split and cultured in either vehicle- or IAA-containing media. Following each lysis, parasites were split to collect samples for next-generation sequencing and continue propagating in fresh host monolayers. b, Fold-change in gRNA abundance between the vehicle-treated passage 6 and the initial library, plotted by PAM type. Boxplot displays the distribution of each sample by quartiles; outliers highlighted in gray; n = 107 NAG and 358 NGG gRNAs. c, Relative abundances for each guide were corrected for the effect of the PAM used and fold-changes were normalized to passage 2. UMAP was used to compare guides in each screen based on their pattern of fold changes for vehicle- and IAA-treated samples. Clusters were calculated by k-means. d, Comparison of phenotype scores from prior gene-disruption screen for each of the clusters in c. Boxplot displays the distribution of phenotypes in each cluster by quartiles; n = 253, 205, 209, 215 gRNAs per cluster. e, Pattern of fold changes for each guide plotted by cluster. Lines colored by treatment, as in a. Bold lines are the mean for all guides in a given cluster. f–g, Gene centroids in UMAP space based on the effects of targeting guides against each gene (f). Genes were assigned to fitness-conferring (cluster A) or dispensable (cluster B) categories based on k-means clustering. Fraction of the maximum fold-change that is explained by the first lytic cycle following IAA addition for all fitness-conferring genes in cluster A, ordered based on the magnitude of the effect from acute loss to delayed loss (g); n = 6 gRNAs per gene. Individual genes colored based on the phenotype scores from the prior gene-disruption screen.
Figure 4.
Figure 4.. Analysis of delayed-loss genes identifies two kinases that impact invasion.
a, Pooled screening traces of selected acute- and delayed-loss genes. The fold change of individual guides in the vehicle- (blue) and IAA- (orange) treated samples are displayed. Bold lines are the mean for all guides in a given condition. b, Competition assays of delayed-loss candidates, compared the relative growth of AID-tagged strains against a wild-type strain in either vehicle- or IAA-containing media. Following each lysis, the proportion of fluorescent parasites within each competing population was measured by flow cytometry and normalized to the vehicle control; n = 2 biological replicates. c–d, Plaque assays of delayed-loss candidates grown in the presence of IAA or vehicle control (c). The parental strain (WT) is included for comparison. Quantification of plaque areas from three separate wells are plotted (d). Means are displayed; n.s. p > 0.05, two-tailed t-test. (e) Invasion assays of delayed loss candidates. AID-tagged strains grown in vehicle- or IAA-containing media for 24 h were incubated on host cells for 10 minutes prior to differential staining of intracellular and extracellular parasites. Parasite numbers were normalized to host cell nuclei for each field. Means graphed for n = 3 biological replicates; n.s. p > 0.05, Welch’s one-tailed t-test.
Figure 5.
Figure 5.. SPARK regulates egress and invasion through modulation of intracellular Ca2+ stores.
a, Neighbor-joining phylogenetic tree of kinase domains from representative apicomplexan species, along with mammalian PDK1 orthologues and related AGC kinases. Bootstraps determined from 1000 simulations. Scale indicates substitutions per site. b, Models of the canonical mammalian PDK1 and the apicomplexan SPARK proteins. The kinase domains, mammalian pleckstrin homology (PH) domain, and conserved apicomplexan MKXGFL motif are shown. c, SPARK-AID was visualized by immunofluorescence microscopy and immunoblotting using the V5 epitope. SPARK-AID was undetectable after 24 h of IAA treatment. Staining for CDPK1 was used to identify parasites, and nuclei were stained with DAPI. Channels adjusted equivalently across all samples. d, SPARK-AID depletion, as in c, monitored by immunoblot. SPARK-AID is expected to run at 98 kDa. e–f, Parasite egress stimulated with zaprinast (e) or the Ca2+ ionophore A23187 (f) following 24 h of treatment with vehicle or IAA. Egress was monitored by the number of host cell nuclei stained with DAPI over time. Mean graphed for n = 3 biological replicates. Shaded regions represent ± S.D. g, Selected frames from live video microscopy of zaprinast- or A23187-stimulated SPARK-AID parasites expressing the genetically encoded Ca2+ sensor GCaMP6f. Parasites were grown for 24 h with vehicle or IAA prior to the stimulation of egress. h, Kymographs showing normalized fluorescence per vacuole relative to the initial intensity, for 12 vacuoles per strain from the experiments in g. Gray areas represent the period following egress of the vacuole under observation. i, Extracellular parasites in basal Ca2+ buffer stimulated with zaprinast or the Ca2+ ionophore A23187, following 24 h of treatment with vehicle or IAA. Cytosolic Ca2+ flux was measured in bulk as GCaMP6f fluorescence normalized to the initial and maximum fluorescence following aerolysin permeabilization in 2 mM Ca2+. Mean ± S.E. graphed for n = 3–6 biological replicates.

Comment in

References

    1. Cabrera DG et al. Plasmodial Kinase Inhibitors: License to Cure? J. Med. Chem 61, 8061–8077 (2018). - PMC - PubMed
    1. Sauvey C, Ehrenkaufer G, Shi D, Debnath A & Abagyan R Antineoplastic kinase inhibitors: A new class of potent anti-amoebic compounds. PLoS Negl. Trop. Dis 15, e0008425 (2021). - PMC - PubMed
    1. Merritt C, Silva LE, Tanner AL, Stuart K & Pollastri MP Kinases as druggable targets in trypanosomatid protozoan parasites. Chem. Rev 114, 11280–11304 (2014). - PMC - PubMed
    1. Talevich E, Mirza A & Kannan N Structural and evolutionary divergence of eukaryotic protein kinases in Apicomplexa. BMC Evol. Biol 11, 321 (2011). - PMC - PubMed
    1. Peixoto L et al. Integrative genomic approaches highlight a family of parasite-specific kinases that regulate host responses. Cell Host Microbe 8, 208–218 (2010). - PMC - PubMed

Publication types