. 2022 May;24(5):708-722.
doi: 10.1038/s41556-022-00895-y. Epub 2022 Apr 28.

Kinase-independent synthesis of 3-phosphorylated phosphoinositides by a phosphotransferase

Affiliations

Kinase-independent synthesis of 3-phosphorylated phosphoinositides by a phosphotransferase

Glenn F W Walpole et al. Nat Cell Biol. 2022 May.

Abstract

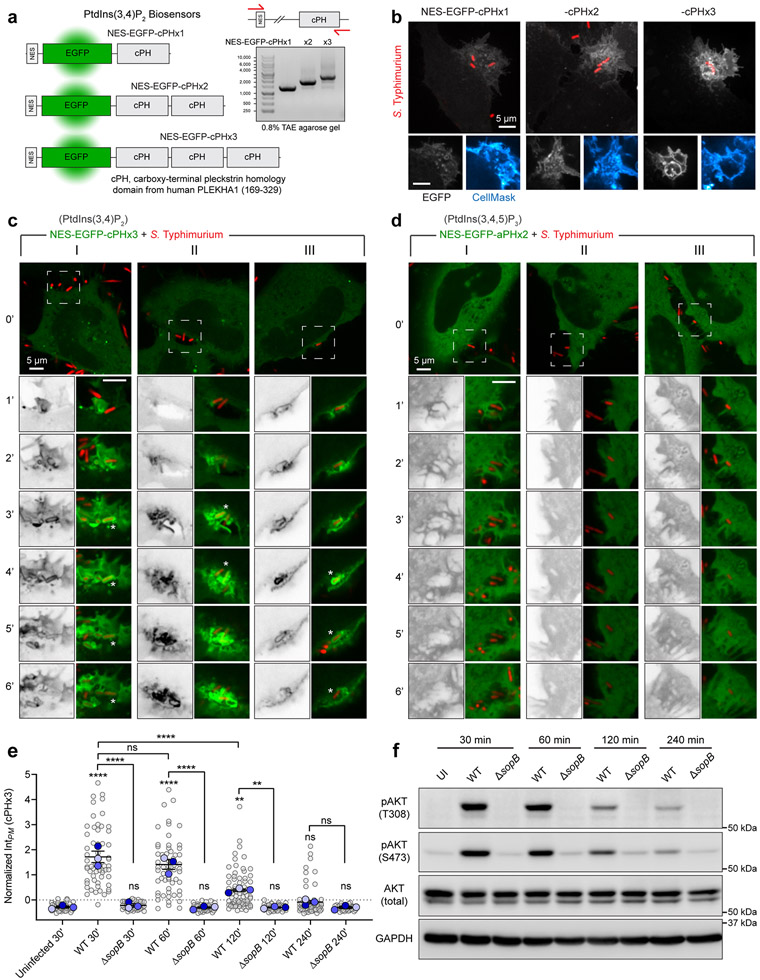
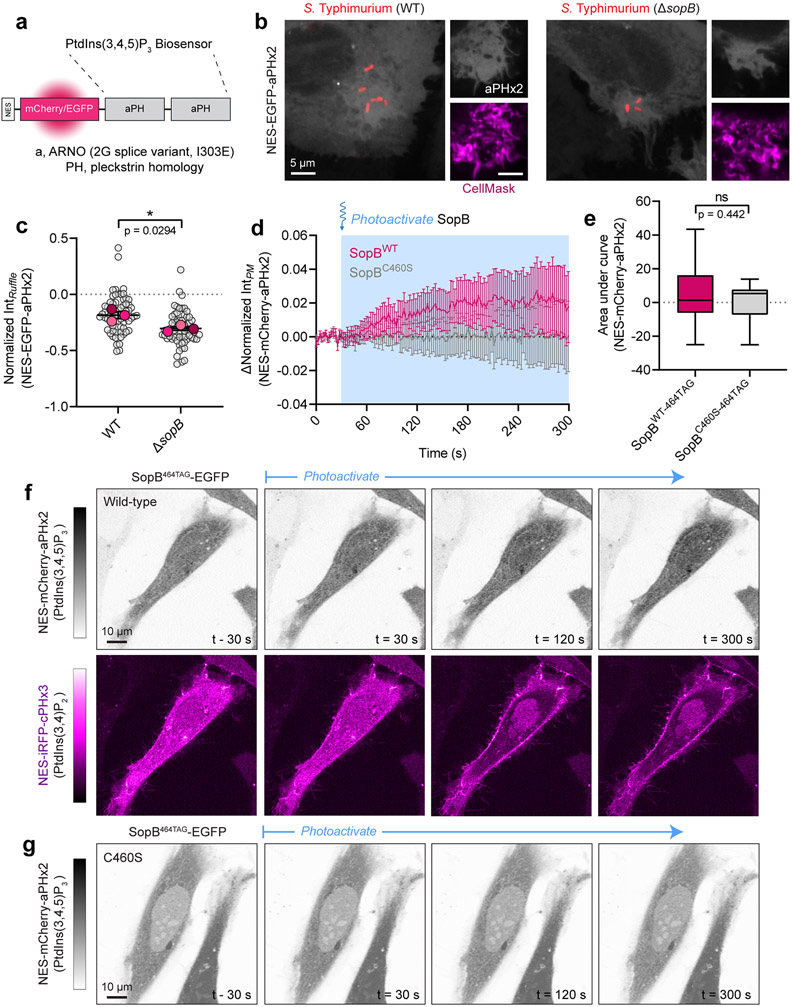
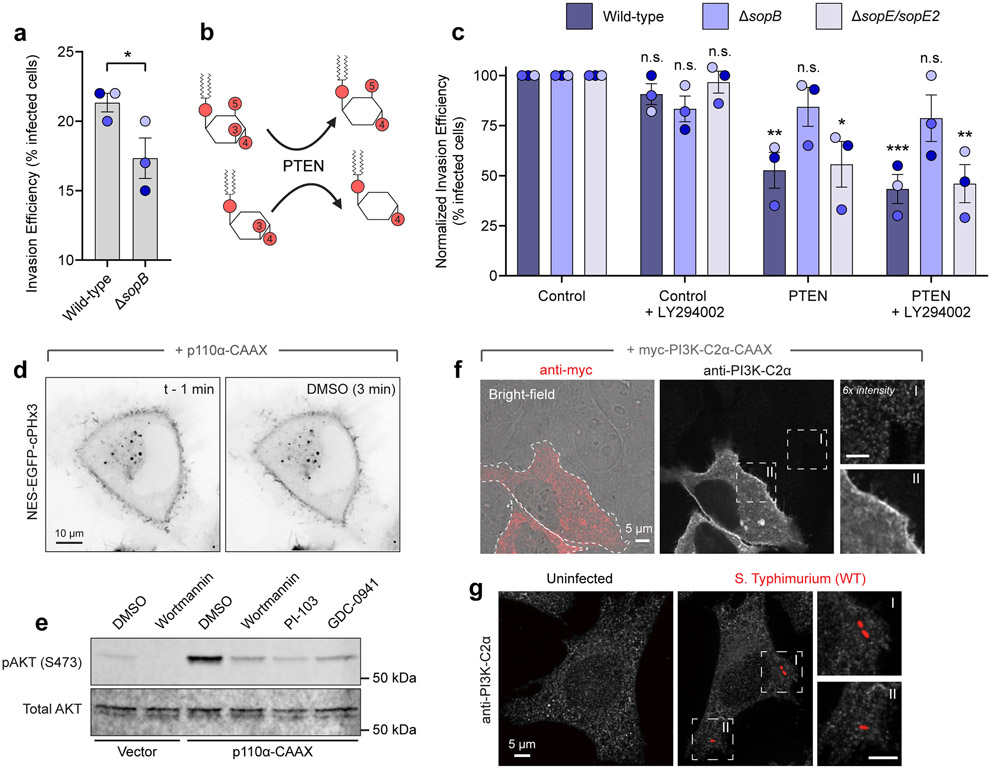
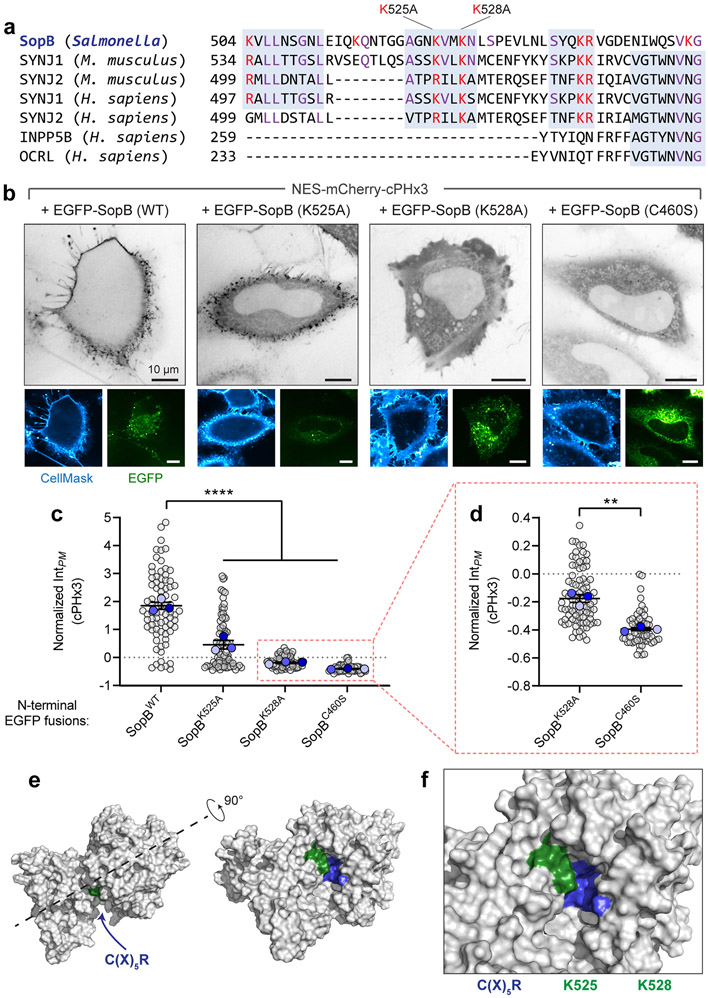
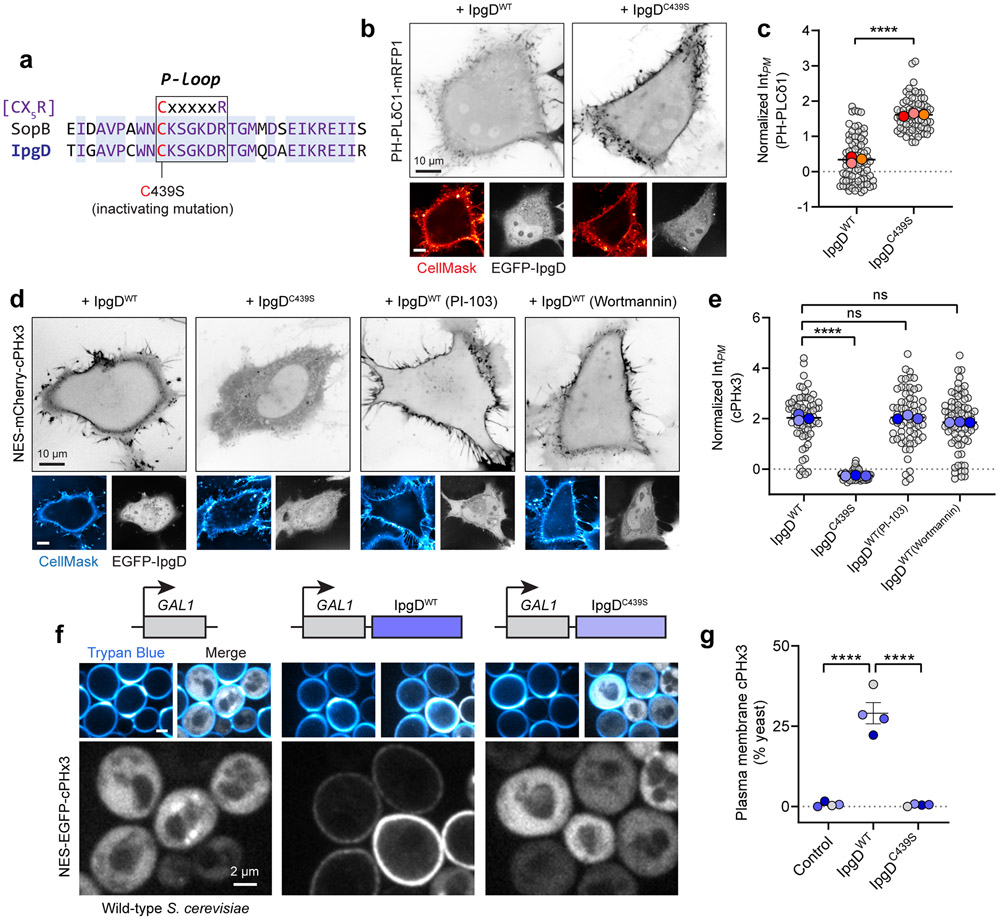
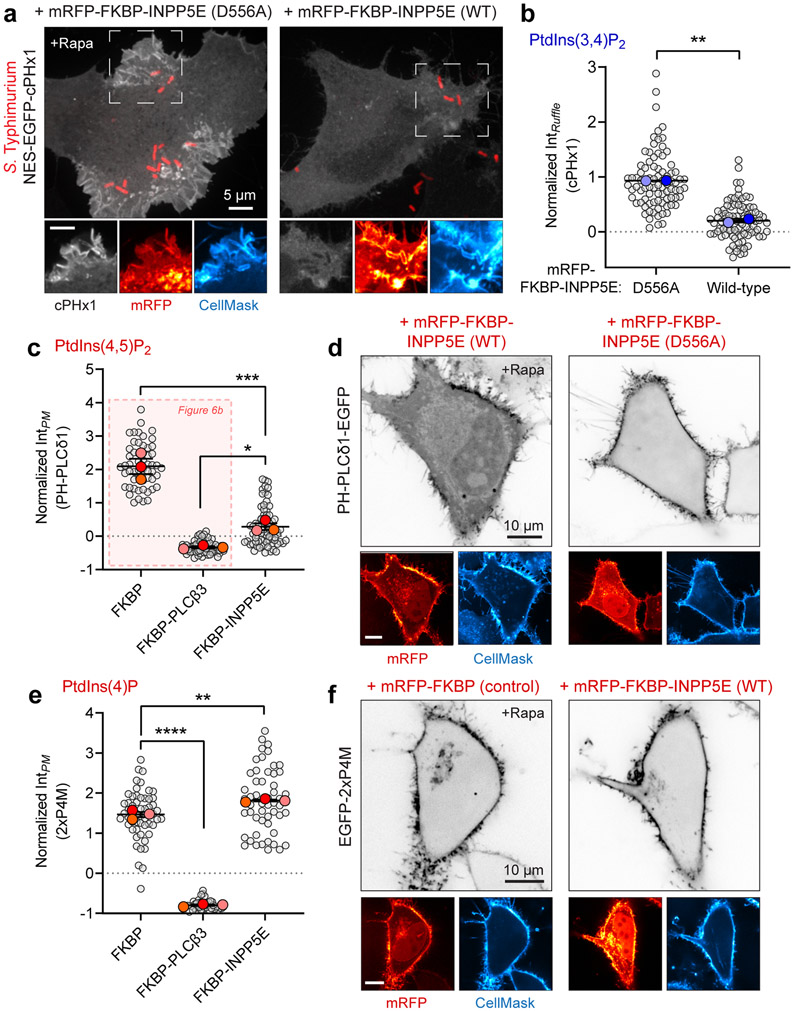
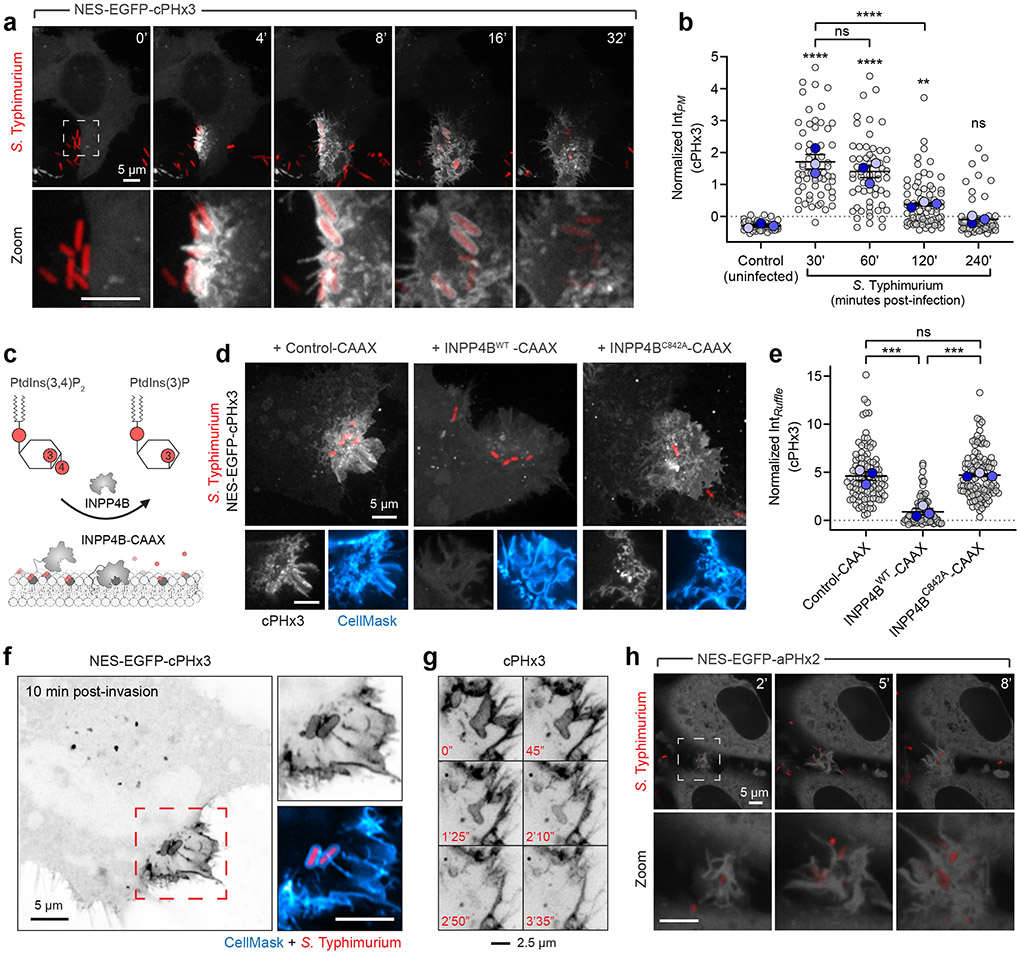
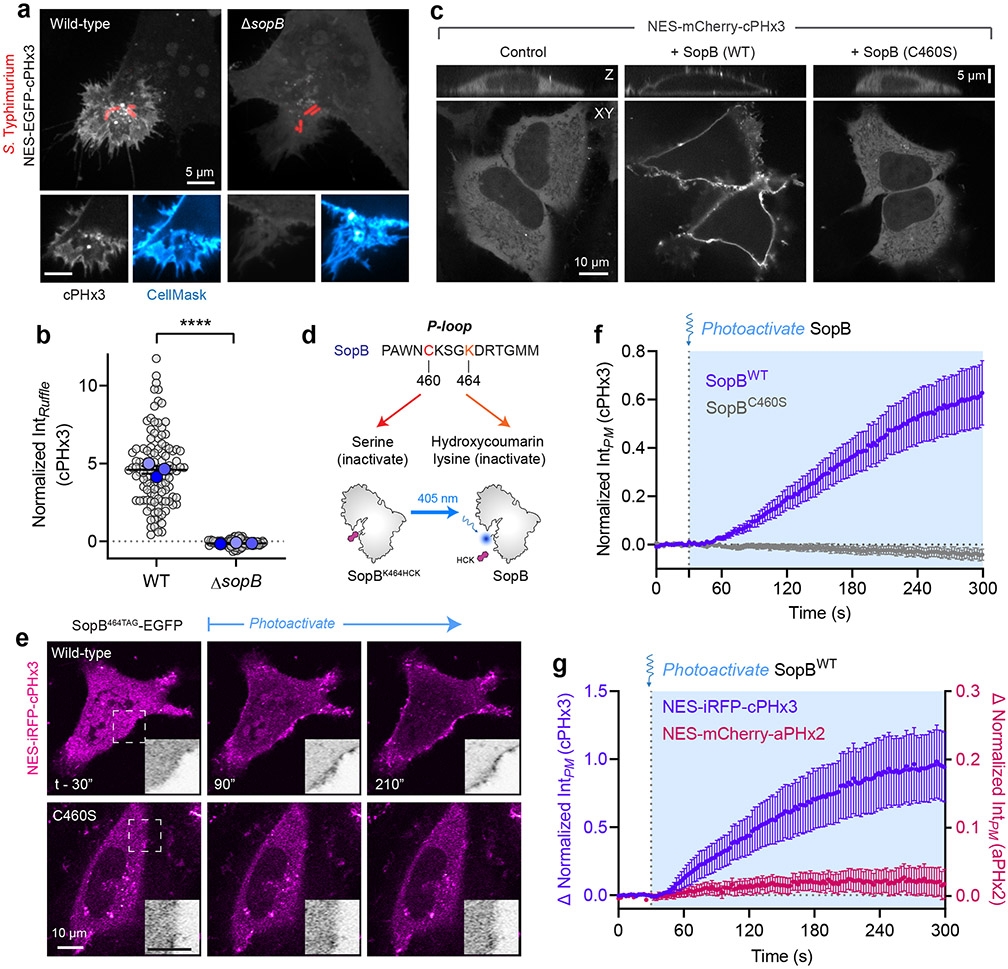
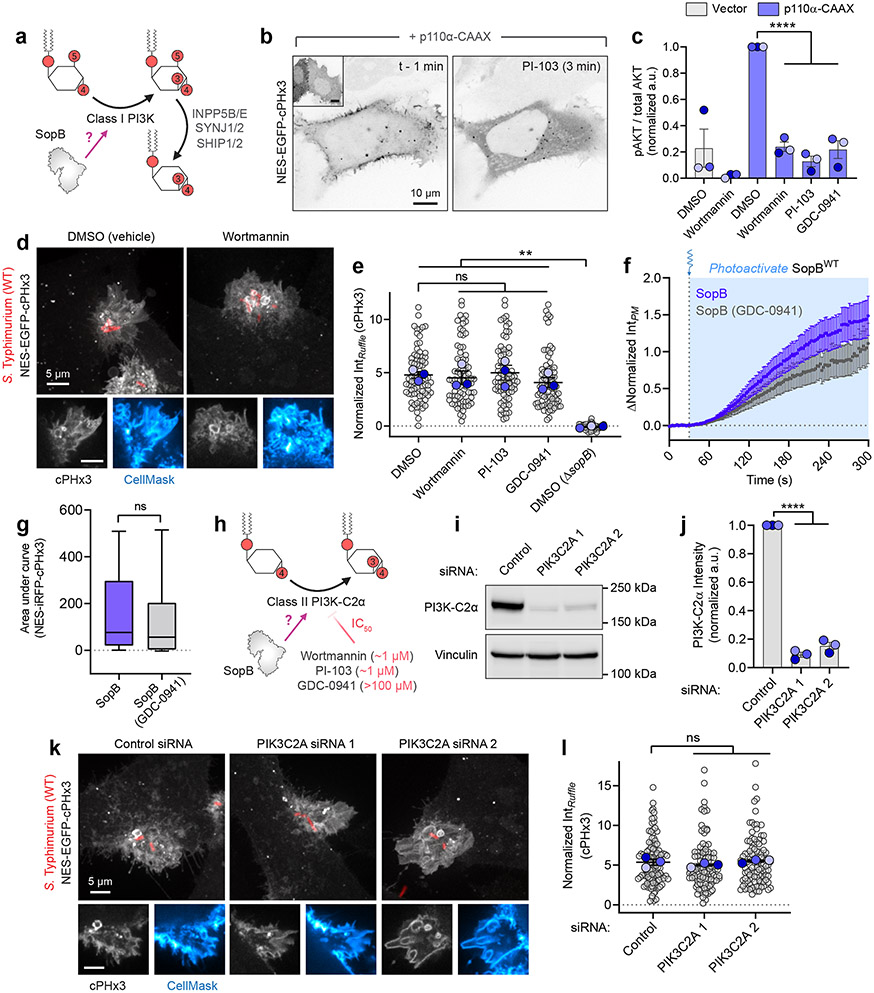
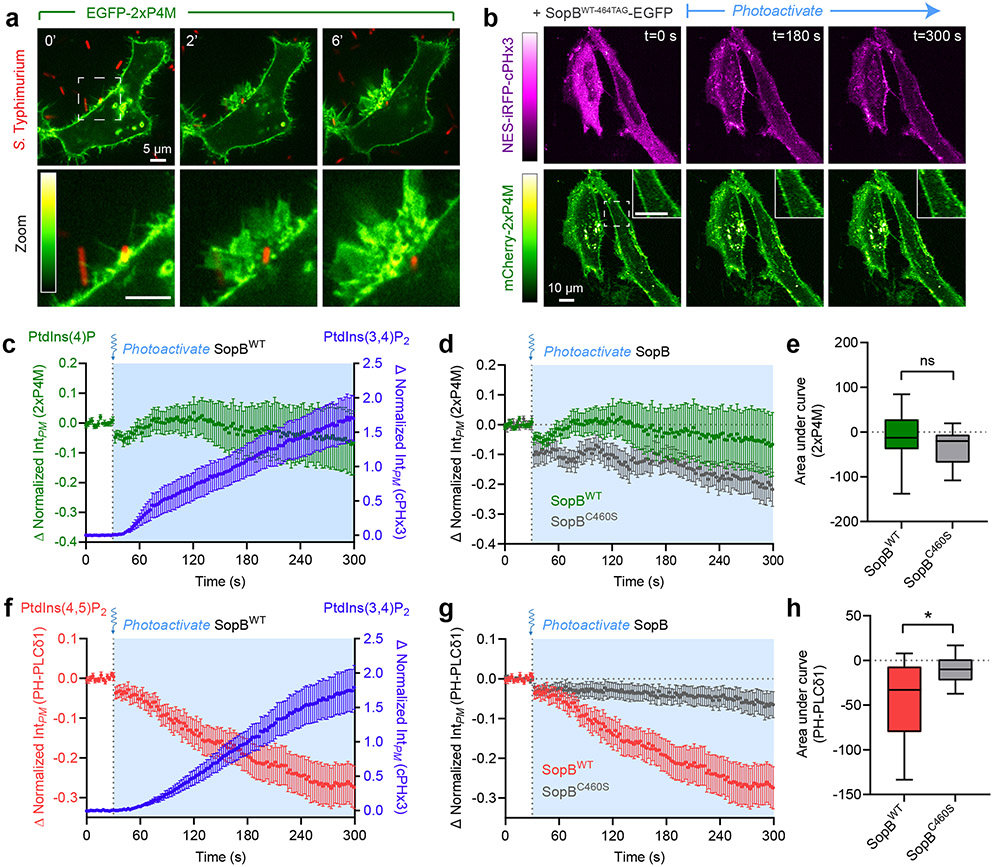
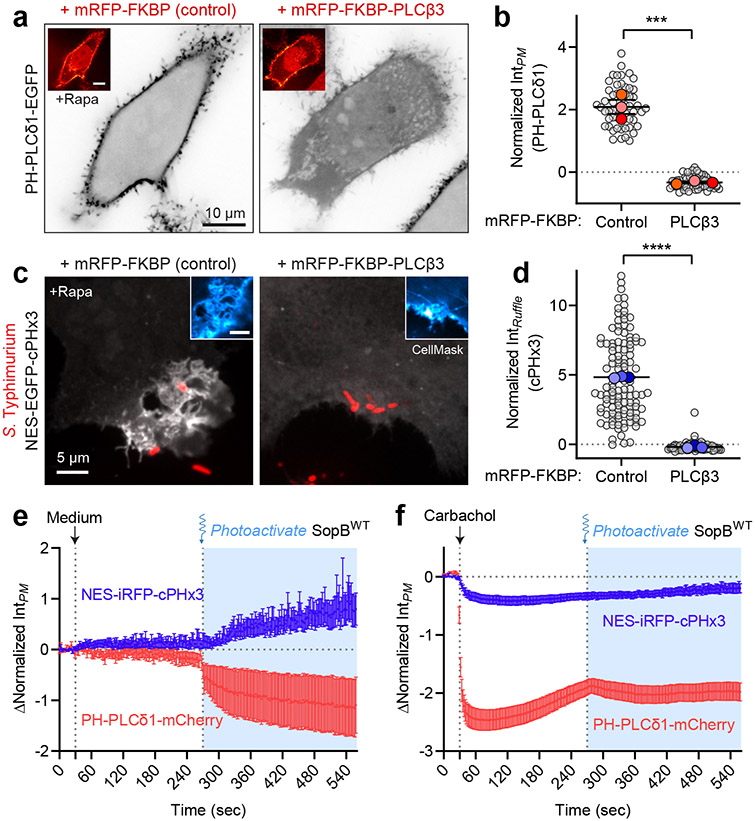
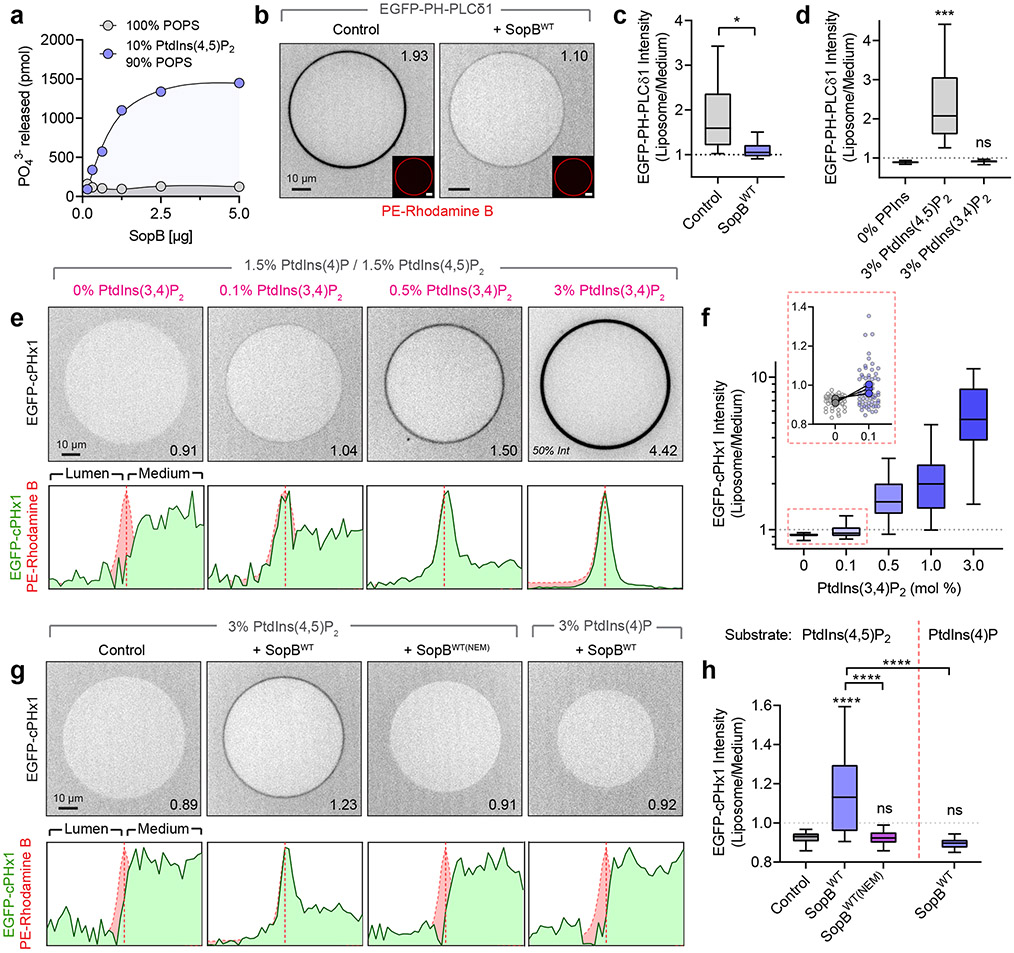
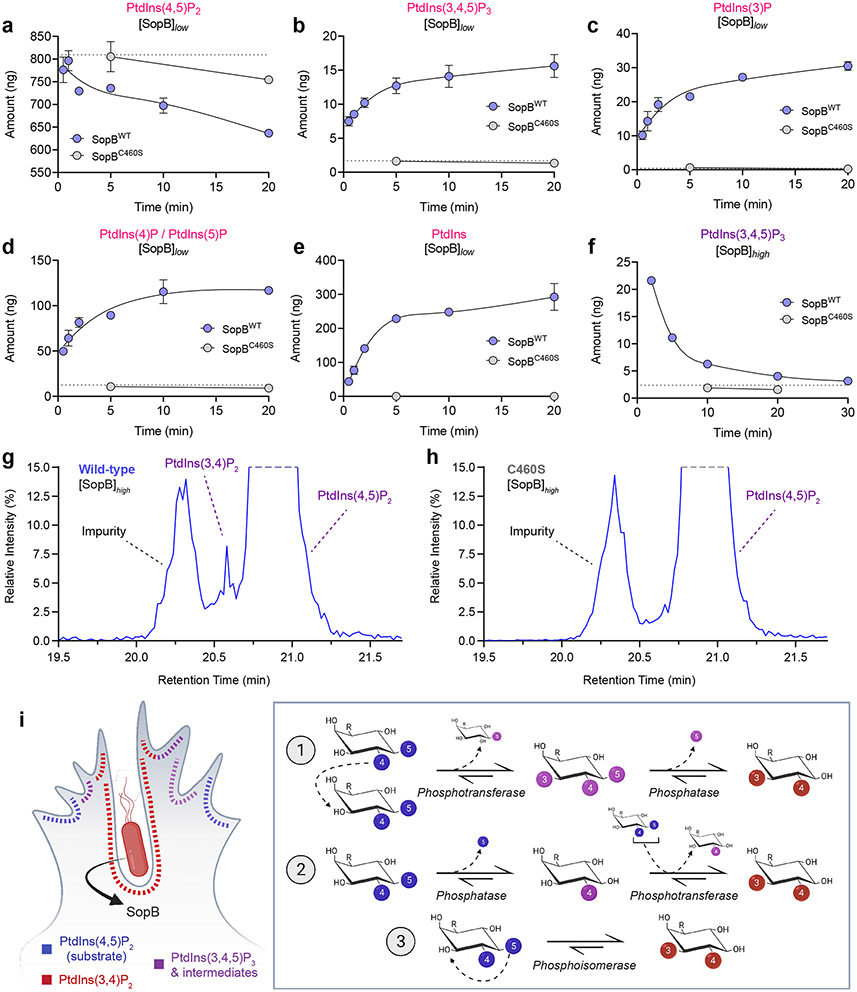
Despite their low abundance, phosphoinositides play a central role in membrane traffic and signalling. PtdIns(3,4,5)P3 and PtdIns(3,4)P2 are uniquely important, as they promote cell growth, survival and migration. Pathogenic organisms have developed means to subvert phosphoinositide metabolism to promote successful infection and their survival in host organisms. We demonstrate that PtdIns(3,4)P2 is a major product generated in host cells by the effectors of the enteropathogenic bacteria Salmonella and Shigella. Pharmacological, gene silencing and heterologous expression experiments revealed that, remarkably, the biosynthesis of PtdIns(3,4)P2 occurs independently of phosphoinositide 3-kinases. Instead, we found that the Salmonella effector SopB, heretofore believed to be a phosphatase, generates PtdIns(3,4)P2 de novo via a phosphotransferase/phosphoisomerase mechanism. Recombinant SopB is capable of generating PtdIns(3,4,5)P3 and PtdIns(3,4)P2 from PtdIns(4,5)P2 in a cell-free system. Through a remarkable instance of convergent evolution, bacterial effectors acquired the ability to synthesize 3-phosphorylated phosphoinositides by an ATP- and kinase-independent mechanism, thereby subverting host signalling to gain entry and even provoke oncogenic transformation.


Figures

Extended Data Fig. 1
Extended Data Fig. 1. Rapid and sustained PtdIns(3,4)P2 synthesis during Salmonella entry and maturation.
(a) Model of PtdIns(3,4)P2 biosensors based on single, double-, or triple-tandem carboxy-terminal PH domains from TAPP1 (PLEKHA1). NES, nuclear export signal. Right, gel electrophoresis of PCR amplicons generated by primers that house the open reading frames. (b) Cells expressing cPHx1, cPHx2, or cPHx3 were infected for 10 min with wild-type Salmonella prior to staining the PM with CellMask. Representative maximum intensity projections (main) and a corresponding confocal section of the invasion ruffle (bottom panels) are presented. (c) Confocal imaging of cells (three examples in I, II, and III) expressing cPHx3 during invasion by wild-type Salmonella. Bottom vertical panels are expanded from the white box region and correspond to the minute-by-minute time series. cPHx3 is also presented in a gray inverted lookup table (RGB intensity 0=white, 255=black). (d) As in (c), three examples (I, II, and III) of cells expressing the PtdIns(3,4,5)P3 sensor aPHx2 during invasion by wild-type Salmonella. (e) Cells serum-starved for 3 h were infected by Salmonella. Extracellular bacteria were removed, and cells returned to serum-free medium containing gentamycin. PM cPHx3 intensities were quantified in the following number of cells: 59 (control), 60 (WT, 30 min), 42 (ΔsopB, 30 min), 58 (WT, 60 min), 53 (ΔsopB, 60 min), 75 (WT, 120 min), 48 (ΔsopB, 120 min), 66 (WT, 240 min), and 36 (ΔsopB, 240 min) across n=3 independent experiments. Data are trial means ± SEM (foreground) overlaid on cell measurements (background). Data from Fig. 1c are presented with ΔsopB infections. ****P < 0.0001; **P = 0.0054 (UI-vs-WT60), **P = 0.0044 (WT120-vs-ΔsopB120); ns, not significant. (f) Cells serum-starved for 3 hours, were exposed to Salmonella (wild-type or ΔsopB) for 10 min. Extracellular bacteria were removed, and cells were returned to serum-free medium with gentamycin. Lysates were collected at the indicated time-points and analyzed on parallel membranes for pAKT (S473) or pAKT (T308) prior to stripping and re-probing for total AKT or GAPDH (loading control). Representative immunoblots are presented from n=2 independent experiments. UI, uninfected. Source numerical data and unprocessed blots are available in source data.
Extended Data Fig. 2
Extended Data Fig. 2. PtdIns(3,4,5)P3 analysis during Salmonella invasion or during optogenetic activation of SopB.
(a) Model of the PtdIns(3,4,5)P3 biosensor NES-EGFP-aPHx2 derived from tandem ARNO PH domains (2G splice variant, I303E mutation). NES, nuclear export signal. (b) Cells were exposed to invasive RFP-expressing wild-type or isogenic ΔsopB Salmonella and the PM was stained with CellMask prior to imaging. Maximum intensity projections (main) and single confocal sections of the invasion ruffle are presented at right for each. (c) Quantification from (b). Normalized intensity of aPHx2 in the PM of invasion sites from n=3 independent experiments analyzing 71 (WT) and 63 (ΔsopB) invasion sites. *P = 0.0294. (d) Normalized intensity of aPHx2 in the PM during optogenetic activation of SopBWT-464TAG or SopBC460S-464TAG. Filtered baseline-corrected time lapse data are mean ± SEM of individual cell measurements from 3 independent experiments quantifying n=29 cells (WT) and n=13 cells (C460S). (e) AUC calculations of aPHx2 intensities from (d). Data are median, box (25th-75th) and whisker (10th-90th) percentiles of n=29 cells (WT) and n=13 cells (C460S) from 3 independent experiments. P = 0.4415, ns. (f,g) SopB-mediated synthesis of PtdIns(3,4)P2 is not accompanied by a robust PtdIns(3,4,5)P3 response. Representative confocal sections of aPHx2 and cPHx3 localization during optogenetic activation of WT or C460S SopB. Left, corresponding linear RGB intensity scales are presented. The indicated times are prior to (t - 30 s) or after illumination with 405 nm light to photolyze hydroxycoumarin lysine in SopB. See corresponding quantification of (f) presented in Fig. 2g. Source numerical data are available in source data.
Extended Data Fig. 3
Extended Data Fig. 3. Sequence determinants of SopB-mediated PtdIns(3,4)P2 generation.
(a) Bacterially injected SopB localizes to the vacuolar membrane and PM invaginations. HeLa cells were exposed to ΔsopB (control) or ΔsopB + SopB-c-myc Salmonella for 10 min prior to labeling the PM (WGA) and immunostaining against c-myc and Salmonella. Inset panels are expanded from the hashed box region. Representative maximum intensity projections are from n=3 independent experiments. (b) Anti-myc fluorescence is not contaminated by non-secreted SopB or anti-Salmonella immunostaining. ΔsopB + SopB-c-myc Salmonella were centrifuged onto poly-L-lysine coated coverslips. Bacteria were processed as in (a) and imaged with equivalent acquisition settings. The representative maximum intensity projection is from n=3 independent experiments. (c) Heterologous SopB coalesces within puncta that abut cortical membranes. Full-length SopB constructs were co-transfected with cPHx3 and imaged live. Amino-terminally tagged SopB was enriched along cytosolic reticular structures; amino- and carboxy-terminal EGFP fusions also enriched on the basal footprint of cells. Representative confocal sections are presented for each construct, from more than three similar experiments. CellMask served as a PM marker. (d) SopB requires amino acids 68-172 and 520-554 for PtdIns(3,4)P2 generation. The indicated SopB plasmids (top panels) were co-transfected with cPHx3 (bottom panels) and imaged live in HeLa cells. Representative confocal sections are presented. Note that membrane-targeting of SopB is disrupted following the deletion of amino acids 68-172 while PM-targeting is preserved following the deletion of amino acids 520-554. (e) CRISPR-Cas9-mediated deletion of Cdc42. Total lysates from control sgRNA- or Cdc42-specific sgRNA-treated Henle 407 cells were immunoblotted against Cdc42. Alpha tubulin served as a loading control. (f) Cdc42 regulates SopB targeting but is not strictly required for PtdIns(3,4)P2 generation. Representative maximum intensity projections are presented of SopB (1-561)-EGFP localization in parental wild-type Henle (top) or Cdc42 KO Henle cells (bottom). Inset images depict localization of cPHx3 (confocal section). cPHx3 was markedly enriched in the PM with a concomitant decrease in cytosolic fluorescence in (mean ± SEM) 94.1 ± 2.92% of parental WT and 88.5 ± 7.28% of Cdc42 KO cells across n=3 independent experiments. (g) Quantification of SopB-EGFP puncta per cell from n=3 independent experiments analyzing the following number of Henle 407 cells: 91 (WT) and 59 (Cdc42 KO). Data are trial means ± SEM (foreground) overlaid on cell measurements (gray, background). **P = 0.0014. Source numerical data and unprocessed blots are available in source data.
Extended Data Fig. 4
Extended Data Fig. 4. 3-phosphorylated phosphoinositides promote bacterial invasion of host cells.
(a) Cells were exposed to wild-type or ΔsopB Salmonella for 10 min and extracellular bacteria were removed by extensive washing before returning to growth medium for an additional 20 min. Extracellular and intracellular bacteria were differentially stained. Data are mean ± SEM from n=3 independent experiments quantifying ≥300 infected cells per strain. *P = 0.0333. (b,c) PtdIns(3,4)P2 and/or PtdIns(3,4,5)P2 promote bacterial invasion. (b) Model of PTEN-catalyzed reactions: membrane-associated PTEN dephosphorylates both PtdIns(3,4,5)P3 and PtdIns(3,4)P2 at the 3-position of the inositol ring. (c) Cells transfected with EGFP (control) or the A4 mutant of PTEN were left untreated or pre-treated with LY294002 (10 μM, 30 min) prior to invasion. Two-fold excess of ΔsopE/sopE2 bacteria was used to obtain sufficient infected cells. Data are mean ± SEM (normalized to respective control) from n=3 independent experiments quantifying ≥300 infected cells per strain. WT: **P = 0.0022, ***P = 0.0007; ΔsopE/E2: *P = 0.0125, **P = 0.0039. (d) Cells were co-transfected with cPHx3 and PM-targeted catalytic subunit of class IA PI3K (p110α-CAAX). Images were acquired immediately before (left) or 3 min after addition of DMSO (vehicle, right). (e) HeLa cells expressing vector control or p110α-CAAX were treated for 20 min with DMSO, wortmannin (100 nM), PI-103 (500 nM), or GDC-0941 (500 nM) prior to collection of cell lysates and immunoblotting using phospho-AKT (S473) and pan AKT antibodies. The immunoblot presented is representative of n=3 independent experiments. Corresponding quantification, Fig. 3c. (f) Confirmation of anti-PI3K-C2α polyclonal antibody labelling of heterologously-expressed PI3K-C2α. HeLa cells transfected with PM-targeted myc-PI3K-C2α were co-stained for the myc epitope tag and PI3K-C2α. Panels right depict enlargement of hashed box regions (I, II), where the non-transfected cells (I) were overexposed to visualize endogenous staining. (g) Class II PI3K-C2α is not enriched at the site of Salmonella invasion. Confocal sections of uninfected and wild-type Salmonella infected HeLa cells stained for endogenous PI3K-C2α. Source numerical data and unprocessed blots are available in source data.
Extended Data Fig. 5
Extended Data Fig. 5. Lysine residues within the carboxyl-terminus of SopB support optimal phosphotransferase activity.
(a) Alignment of SopB amino acids 504-554 with other PtdIns(4,5)P2 and PtdIns(3,4,5)P3, 5-phosphatases. Basic residues in SopB are highlighted red along with conserved basic residues in the other phosphatases; additional conserved residues are highlighted purple, and regions of highest similarity are boxed (grey). Notably, residues that share sequence similarity with Mus musculus Synaptojanin-1 (SYNJ1) 534-584 fall outside of the SYNJ1 5-phosphatase domain and have not been implicated in its catalytic activity. Local homology between SopB and INPP5B or OCRL failed to be identified by NCBI BLAST. (b) Mutation of lysines 525 and 528 blunt PtdIns(3,4)P2 generation by SopB. Wild-type, K525A, K528A, and C460S SopB amino-terminally tagged with EGFP (bottom panels) were transiently expressed with cPHx3 (inverted grey, main panels). The PM was stained with CellMask before imaging live. Representative confocal sections are presented for each. Note that expression of the K528A mutant led to notable perturbation of cellular morphology including rounding, cortical membrane ‘crumpling’, and blebbing. (c) Normalized intensity of PM cPHx3 from (b) was quantified across n=3 independent experiments (WT, 78 cells; K525A, 81 cells; K528A, 86 cells; C460S, 57 cells). Data are trial means ± SEM (foreground) overlaid on cell measurements (gray, background). ****P < 0.0001. (d) cPHx3 intensities from K528A- and C460S-SopB-transfected cells (red box, panel c) plotted on an expanded axis. Subtle PM-enrichment of cPHx3 was evident in K528A-transfected cells relative to the C460S-transfected mutant. Data are trial means ± SEM (foreground) overlaid on cell measurements (gray, background). **P = 0.0017. (e,f) Lysine 525 and 528 of SopB are structurally predicted to neighbour the C(X)5R motif. The primary sequence of SopB (residues 1-561) was analyzed by RoseTTAFold and the resulting highest ranked model is presented in the surface filling view (grey). The location of lysine 525 and 528 (green) and the C(X)5R motif of SopB (blue) are annotated. Source numerical data are available in source data.
Extended Data Fig. 6
Extended Data Fig. 6. Generation of PtdIns(3,4)P2 by the Shigella flexneri effector IpgD does not require class I or class II PI3Ks.
(a) Sequence alignment of the phosphate-binding (P-loop) sequence from SopB (Salmonella enterica) and IpgD (Shigella flexneri). Residue 439 of IpgD encodes the cysteine of the C(X)5R motif. (b) IpgD reduces PM PtdIns(4,5)P2 levels in a C(X)5R-dependent manner. Heterologous expression of EGFP-IpgD (WT or C439S) and PH-PLCδ1 (inverted gray, main panels). The PM was stained with CellMask prior to imaging live. (c) Quantification of PH-PLCδ1 intensity in the PM from (b) across n=3 independent experiments quantifying 82 cells (IpgDWT) and 74 cells (IpgDC439S. Data are trial means ± SEM (foreground) overlaid on cell measurements (gray, background). ****P < 0.0001. (d) Live cell imaging of heterologously-expressed EGFP-IpgD (WT or C439S) and NES-mCherry-cPHx3 following PM staining with CellMask. Cells were treated with the indicated inhibitors (PI-103, 500 nM; wortmannin, 100 nM) for 20 min prior to and throughout imaging. (e) PM cPHx3 intensity was quantified from (d) across 3 independent trials (IpgDWT, 70 cells; IpgDC439S, 62 cells; IpgDWT(PI-103), 68 cells; IpgDWT(Wortmannin), 76 cells). Data are trial means ± SEM (foreground) overlaid on cell measurements (gray, background). ****P < 0.0001. (f) PM PtdIns(3,4)P2 synthesis in S. cerevisiae. Galactose-inducible empty vector (control), IpgDWT, or IpgDC439S were induced for 2 hours in yeast that expressed cPHx3. Trypan Blue staining demarcates the cell wall and non-viable yeast. (g) Yeast from (f) were scored for plasmalemmal cPHx3 localization across n=4 independent experiments analyzing the following number of yeast: control, 881 cells; IpgDWT, 1165 cells; IpgDC439S, 938 cells. Data are mean ± SEM. ****P < 0.0001. Source numerical data are available in source data.
Extended Data Fig. 7
Extended Data Fig. 7. SopB requires an INPP5E-sensitive plasmalemmal inositide for the generation of PtdIns(3,4)P2.
(a) Inhibition of PtdIns(3,4)P2 generated during invasion by pre-recruitment of INPP5E. HeLa cells expressing mRFP-FKBP-INPP5E (WT or D556A) together with PM-targeted Lyn(11)-FRB and the biosensor cPHx1 (gray) were treated with 1 μM rapamycin for 2 min before addition of wild-type Salmonella (BFP, red) for an additional 10 min. The PM was stained (CellMask) and cells fixed before imaging. Maximum intensity projections (main panels) and confocal sections of the boxed region (bottom panels) are presented. Re-localization of mRFP-FKBP-conjugates to the PM is depicted in the bottom panels. (b) Normalized PM intensity of cPHx1 was quantified from part (a) across n=2 independent trials (INPP5EWT, 90 cells; INPP5ED556A, 85 cells). Data are trial means ± SEM (foreground) overlaid on cell measurements (gray, background). **P = 0.0019. (c) Comparison of PtdIns(4,5)P2 depletion by chemically-induced recruitment of PLCβ3 and INPP5E. Normalized PM intensity of PH-PLCδ1 was quantified from n=3 independent experiments (control, 55 cells; PLCβ3, 56 cells; INPP5E, 74 cells). Data from Fig. 6a,b are re-plotted with INPP5E (acquired in parallel) and support that INPP5E results in a modest PtdIns(4,5)P2-depletion relative to PLCβ3. Data are trial means ± SEM (foreground) overlaid on cell measurements (gray, background). ***P = 0.0002, *P = 0.0477. (d) PtdIns(4,5)P2-depletion by INPP5E recruitment depends on its catalytic activity. Comparison of HeLa cells co-transfected as in (a) but expressing the biosensor PH-PLCδ1-EGFP. Representative confocal sections are presented following 5-min rapamycin treatment (1 μM) and PM staining with CellMask. (e,f) Chemically-induced INPP5E recruitment modestly increases PM PtdIns(4)P. HeLa cells expressing mRFP-FKBP-(control), -PLCβ3, or -INPP5E (wild-type) together with PM-targeted Lyn(11)-FRB and EGFP-2xP4M were imaged live 5 min after treatment with 1 μM rapamycin and staining the PM (CellMask). (e) The normalized PM intensity of 2xP4M was quantified from n=3 independent experiments (control, 55 cells; PLCβ3, 41 cells; INPP5E, 53 cells). Data are trial means ± SEM (foreground) overlaid on cell measurements (gray, background). **P = 0.0020. (f) Representative confocal sections of each channel are presented. Source numerical data are available in source data.
Extended Data Fig. 8
Extended Data Fig. 8. Time-resolved HPLC-MS analysis of SopB phosphotransferase-phosphatase activities.
(a) Inorganic phosphate release assessed following treatment of liposomes with 2.5 μg recombinant SopBWT or SopBC460S. Liposome composition was (mol%) POPS:PtdIns(4,5)P2 (90:10) and 2.5 nmol PtdIns(4,5)P2 was provided per reaction. At the indicated timepoints, reactions were terminated by addition of 50 mM NEM. Data are mean ± SEM of duplicate wells. Time 0 min corresponds to a no enzyme control. (b) Separation of PtdIns(3,4)P2 and PtdIns(4,5)P2 regio-isomers in a sample treated with SopBWT. An example HPLC-MS trace derived from LUVs treated with 0.5 μg (71.5 nM) SopBWT for 5 min. Note the appearance of PtdIns(3,4)P2 at ≈20.6 min. (c) Model of the PtdIns(3,4,5)P3 biosensor designed with tandem Bruton’s Tyrosine Kinase (BTK) PH domains (bPHx2). Each component was separated by flexible, serine- and glycine-rich linker sequences. NES, nuclear export signal. (d) Heterologous expression of wild-type SopB induces PM-translocation of bPHx2. Representative confocal micrographs of mCherry-tagged bPHx2 (inverted gray) co-transfected with EGFP-SopBC460S or EGFP-SopBWT. (e) Hypothesized PPIns conversions catalyzed by SopB and potential modulation by host phosphatases. In the presence of PtdIns(4,5)P2 in vitro, SopB generates the species PtdIns(3,4,5)P3, PtdIns(3,4)P2, and PtdIns(3)P. The latter species are hypothesized to arise, at least in part, by sequential dephosphorylation of PtdIns(3,4,5)P3. In vivo, Salmonella infection favours the accumulation of PtdIns(3,4)P2 likely due to the high basal activity of host 5-phosphatases (INPP5B, SYNJ1/2, SHIP1/2, and others) that rapidly convert PtdIns(3,4,5)P3 to PtdIns(3,4)P2. It remains unclear if the rapid clearance of PtdIns(3,4)P2 following fission of the Salmonella-containing vacuole from the PM is due to the intrinsic activity of SopB or to the activity of host 4-phosphatases (INPP4A/B). Nonetheless, SopB is sufficient to give rise to PtdIns(3)P in vitro from PtdIns(4,5)P2, arguing for a second –likely minor–pathway to generate this inositide in addition to Vps34-mediated synthesis on the bacterial vacuole (Mallo et. al., 2008). Finally, phosphatidylinositol may arise by direct dephosphorylation of the 4- and 5-positions of PtdIns(4,5)P2 by SopB, or indirectly by dephosphorylation of products of the phosphotransferase reaction. Source numerical data are available in source data.
Fig. 1∣
Fig. 1∣. Rapid and sustained PtdIns(3,4)P2 synthesis during Salmonella entry and maturation.
(a) Confocal imaging of cPHx3 during invasion by RFP-expressing Salmonella. Maximum intensity projections (main panels) and enlargements of the boxed region (bottom panels) are presented where 0 min indicates time of bacterial contact with the membrane. (b) Cells serum-starved for 3 h were infected by Salmonella. Extracellular bacteria were removed by washing, and cells returned to serum-free medium containing gentamycin. PM cPHx3 intensities were quantified across 59 (control), 60 (30 min), 58 (60 min), 75 (120 min), and 66 cells (240 min) from n=3 independent experiments. Data are trial means ± SEM (blue, foreground) overlaid on cell measurements (gray, background). ****P < 0.0001; **P = 0.0027; ns, not significant. (c) Model of PtdIns(3,4)P2 depletion by INPP4B-CAAX. (d,e) INPP4B impaires recruitment of the biosensor cPHx3 to Salmonella-induced ruffles. Membrane cPHx3 intensity in invasion ruffles was analyzed 10 min post-infection in cells co-transfected with TagBFP2-CAAX (Control-CAAX, 106 ruffles), TagBFP2-INPP4BWT-CAAX (112 ruffles), or catalytically inactive TagBFP2-INPP4BC842A-CAAX (113 ruffles) from n=3 independent experiments. Maximum intensity projections are presented (main), and panels below are corresponding confocal sections of the invasion ruffle. CellMask identifies the PM. TagBFP2 fluorescence is not presented. Data are trial means ± SEM (blue, foreground) overlaid on cell measurements (gray, background). ***P = 0.0006; ns, not significant. (f) Airyscan microscopy of cPHx3 within the invasion ruffle induced by Salmonella (10 min post-infection). Note the continuous cPHx3 (inverted gray) labelling that coincides with a CellMask (right panel)-stained membrane compartment. (g) Confocal time lapse of cPHx3 during bacterial entry and constriction of the invaginating membrane. Images are maximum intensity projections of a 2 μm optical slice. Bacterial fluorescence is not presented. (h) PtdIns(3,4,5)P3 during invasion. HeLa cells expressing aPHx2 were imaged live during invasion with Salmonella. Confocal sections are presented where 0 min marks the first indication of membrane ruffling induced by the bacteria. Source numerical data are available in source data.
Fig. 2∣
Fig. 2∣. SopB is necessary and sufficient for PtdIns(3,4)P2 biosynthesis in mammalian cells.
(a) Cells expressing cPHx3 were infected for 10 min with wild-type or ΔsopB Salmonella expressing RFP prior to staining the PM with CellMask. Maximum intensity projections (main) and corresponding confocal sections of the invasion ruffle (bottom) are presented. (b) Membrane cPHx3 intensity was quantified in invasion ruffles across n=3 independent experiments (WT, 113 ruffles; ΔsopB, 87 ruffles). Data are trial means ± SEM (blue, foreground) overlaid on cell measurements (gray, background). ****P < 0.0001. (c) Heterologous expression of SopB generates PtdIns(3,4)P2. Representative XY and Z confocal sections of HeLa expressing mCherry-tagged cPHx3 and co-transfected as indicated prior to imaging live. Control (EGFP-transfected, 122 cells; n=5), SopBWT-EGFP (210 cells, n=5) and SopBC460S-EGFP (107 cells; n=3), where n=independent experiments. (d) Model of hydroxycoumarin lysine (HCK) incorporation at SopB residue 464 and photolysis. Cells are transfected with SopB464TAG and plasmids that encode an Amber stop codon (UAG)-recognizing tRNA and a tRNA synthase that incorporates HCK during translation. Illumination by 405 nm light photolyzes the hydroxycoumarin to yield wild-type (active) SopB. (e) Photoactivation of SopB induces acute PtdIns(3,4)P2 formation. Representative confocal time-lapses of cells expressing cPHx3 pre- and post-photoactivation of SopBWT-464TAG or SopBC460S-464TAG. Insets are inverted grayscale images of cPHx3 from the region marked by the box in the left-most frame. (f) Quantification of PM cPHx3 intensity from experiments like those in (e) examining n=119 cells (SopBWT-464TAG) and n=50 cells (SopBC460S-464TAG) pooled from 7 independent experiments. Blue-shaded background represents 405-nm-illuminated timepoints. Data are the baseline-corrected mean ± SEM of cPHx3 measurements. (g) Quantification of PM intensity of cPHx3 (left ordinate axis) and aPHx2 (right ordinate axis) following the photoactivation of SopBWT-464TAG. Data are the filtered baseline-corrected mean ± SEM from n=29 cells across 3 independent experiments. Source numerical data are available in source data.
Fig. 3∣
Fig. 3∣. Class I PI3Ks and Class II PI3K-C2α are not required for PtdIns(3,4)P2 synthesis during Salmonella entry.
(a) Class I PI3K-mediated, indirect PtdIns(3,4)P2 synthesis. (b) cPHx3 was co-transfected with p110α-CAAX (main panels) or vector control (inset left). Representative micrographs from n=3 independent experiments are presented pre- and post-PI-103 (500 nM) treatment. (c) Control or p110α-CAAX-expressing cells were treated for 20 min with DMSO (vehicle), wortmannin (100 nM), PI-103 (500 nM), or GDC-0941 (500 nM) prior to immunoblotting for pAKT (S473) and pan AKT. pAKT/AKT densitometry is presented normalized to p110α-CAAX (DMSO) from n=3 independent experiments. Data are mean ± SEM. ****P < 0.0001. (d) cPHx3-expressing cells were pre-treated as in (c) prior to 10 min Salmonella exposure. A representative maximum intensity projection of a DMSO- or wortmannin-treated cell is presented (main) with confocal sections of the invasion ruffle (bottom). (e) cPHx3 intensity quantified in invasions ruffles from (d) following 20 min pre-treatment with PI3K inhibitors. N=3 independent experiments quantifying the following number of ruffles: DMSO, 81; wortmannin, 80; PI-103, 76; GDC-0941, 85; DMSO (ΔsopB), 58. Data are mean ± SEM (foreground) overlaid on cell measurements (background). **P < 0.001. (f) Photoactivation of SopBWT-464TAG in untreated or GCD-0941 (250 nM, 30 min) treated cells. Data are filtered baseline-corrected mean ± SEM cPHx3 intensity from n=69 cells (Control; 10 experiments, 40 cells pooled from Fig. 2f) and n=39 cells (GDC-0941; 6 experiments). (g) AUC calculation of cPHx3 intensities from (f). Data are median, box (25th-75th) and whisker (10th-90th) percentiles of n=69 control cells (10 experiments, 40 cells pooled from Fig. 2f) and n=39 GDC-0941 cells (6 experiments). P = 0.0975. (h) PI3K-C2α-mediated PtdIns(3,4)P2 synthesis and inhibitory IC50 values. (i) Cells treated with the indicated siRNAs and lysates immunoblotted against PI3K-C2α. Vinculin served as a loading control. (j) Densitometric estimation of PI3K-C2α remaining after RNAi treatment, normalized to vinculin. Data are mean ± SEM from n=3 independent experiments. ****P < 0.0001. (k) siRNA-treated cells transfected with cPHx3 and infected with Salmonella for 10 min. Representative maximum intensity projections (main) and invasion ruffle sections (bottom) are presented. (l) Quantification of cPHx3 intensity in the invasion ruffle from (k) in n=3 independent experiments quantifying the following number of ruffles (control, 117; PIK3C2A 1, 105; PIK3C2A 2, 107). Data are mean ± SEM (foreground) overlaid on cell measurements (background). P = 0.6826 (C-vs-1), P > 0.9999 (C-vs-2). Source numerical data and unprocessed blots are available in source data.
Fig. 4∣
Fig. 4∣. PtdIns(3,4)P2 generation in S. cerevisiae that are devoid of PI3K activity.
(a) PM PtdIns(3,4)P2 synthesis in S. cerevisiae. Galactose-inducible empty vector (control), SopBWT, or SopBC460S were induced for 2 hours in yeast that expressed cPHx3. Concanavalin A (ConA) and trypan blue staining demarcate both the cell wall and non-viable yeast. (b) Yeast from (a) were scored for plasmalemmal cPHx3 localization across n=3 independent experiments analyzing the following number of yeast cells (control, 929; SopBWT, 929; SopBC460S, 1116). Data are mean ± SEM. ****P < 0.0001. (c) PtdIns(3)P loss in vps34ts mutant S. cerevisiae. Cells expressing EGFP-2xFYVE were maintained at 28-30°C (permissive) during growth or shifted where indicated to 38 °C (non-permissive) for 90 min before switching carbon source and continued growth at 38 °C. (d) PtdIns(3,4)P2 synthesis by SopB persisted despite loss of Vps34p activity. Yeast expressing galactose-inducible plasmids were shifted to a non-permissive temperature as in (c) before imaging. Non-viable cells were excluded using Trypan blue (not shown). (e) Quantification of cPHx3 translocation to the PM from experiments like (d) across n=3 independent experiments. The following number of yeast cells were scored per condition: Control (WT, 455 cells; ts, 510 cells), SopBWT (WT, 597 cells; ts, 475 cells), SopBC460S (WT, 518 cells; ts, 331 cells). Data are mean ± SEM. ****P < 0.0001. Source numerical data are available in source data.
Fig. 5∣
Fig. 5∣. PtdIns(4,5)P2 levels correlate inversely with SopB-mediated PtdIns(3,4)P2 formation
(a) PtdIns(4)P during bacterial invasion. A representative time-lapse of a HeLa cell expressing 2xP4M (inset bar, linear RGB intensity scale where 0=black, 255=white) during wild-type Salmonella invasion (0 min indicates time of bacterial contact with the membrane). Panels at bottom show enlarged region denoted by white box. PtdIns(4)P remains abundant within ruffles but is rapidly cleared from the forming vacuole. (b) PM PtdIns(4)P is stable during optogenetic activation of SopB. Representative micrographs of cPHx3 and 2xP4M pre- and post-photoactivation of SopBWT-464TAG. Left bars, corresponding linear RGB intensity scales where 0=black, 255=white. Illumination of the sample with 405-nm light began at t=30 sec. Insets show enlarged region denoted by white box in frame 1. (c) Quantification of experiments like (b) plotting PM 2xP4M (left ordinate axis) and cPHx3 (right ordinate axis) intensities following the photoactivation of SopBWT-464TAG. Data are the filtered baseline-corrected mean ± SEM from n=21 cells across 3 independent experiments. (d) Comparison of 2xP4M responses to photoactivation of SopBWT-464TAG and SopBC460S-464TAG. Data are filtered baseline-corrected mean ± SEM 2xP4M intensity from n=21 cells (SopBWT-464TAG) and n=27 cells (SopBC460S-464TAG) across 3 independent experiments. (e) AUC calculations of 2xP4M intensities from (d). Data are median, box (25th-75th) and whisker (10-90th) percentiles of n=21 cells (SopBWT-464TAG) and n=27 cells (SopBC460S-464TAG) across 3 independent experiments. P = 0.064. (f) PtdIns(4,5)P2 depletion during PtdIns(3,4)P2 synthesis. Quantification of PH-PLCδ1 (left ordinate axis) and cPHx3 (right ordinate axis) PM intensities pre- and post-photoactivation of SopBWT-464TAG. Data are the filtered baseline-corrected mean ± SEM from n=40 cells across 7 independent experiments (unfiltered cPHx3 data presented in Fig. 2f). (g) Data from (f) comparing the response of PH-PLCδ1 to photoactivation of SopBWT-464TAG and SopBC460S-464TAG. Data are filtered baseline-corrected mean ± SEM PH-PLCδ1 intensity from n=40 cells (SopBWT-464TAG) and n=10 cells (SopBC460S-464TAG) across 7 independent trials. (h) AUC calculations of PH-PLCδ1 intensities from (g). Data are median, box (25th-75th) and whisker (10th-90th) percentiles of n=40 cells (SopBWT-464TAG) and n=10 cells (SopBC460S-464TAG) from 7 independent experiments. *P = 0.0297. Source numerical data are available in source data.
Fig. 6∣
Fig. 6∣. SopB requires a phospholipase C-sensitive inositide to generate PtdIns(3,4)P2.
(a) Chemically induced recruitment of PLCβ3 to deplete PtdIns(4,5)P2 from the PM. HeLa cells expressing mRFP-FKBP (control) or mRFP-FKBP-PLCβ3 together with PM-targeted Lyn(11)-FRB and the biosensor PH-PLCδ1 (inverted gray scale) were treated with 1 μM rapamycin before imaging live. Insets show re-localization of FKBP-conjugates to the PM induced by rapamycin. (b) Plasmalemmal PH-PLCδ1 intensity from experiments like (a) was quantified from n=3 independent experiments (control, 55 cells; PLCβ3, 56 cells). Data are mean ± SEM (foreground) overlaid on cell measurements (background). ***P = 0.0005 (c) Inhibition of PtdIns(3,4)P2 generated during invasion by pre-recruitment of PLCβ3. Cells transfected as in (a) but expressing cPHx3 (main panels, maximum intensity projections) were incubated with 1 μM rapamycin for 2 min before addition of wild-type BFP-expressing Salmonella for an additional 10 min. The PM was stained with CellMask (inset, confocal sections of invasion ruffle) before fixation and imaging. (d) The resulting PM cPHx3 intensities from (c) were quantified in invasion ruffles from n=3 independent experiments (control, 115 cells; PLCβ3, 76 cells). Data are mean ± SEM (foreground) overlaid on individual cell measurements (background). ****P < 0.0001. (e,f) Activation of endogenous PLCβ precludes SopB-mediated PtdIns(3,4)P2 synthesis. HeLa cells overexpressing SopBWT-464TAG and muscarinic M3 receptor were subjected to treatment with medium control (e) or 50 μM carbachol (f) at 30 sec to activate endogenous PLCβ, followed by 405-nm light illumination at 270 sec to optogenetically activate SopB. The decrease in PtdIns(4,5)P2 and response in PtdIns(3,4)P2 were monitored with PH-PLCδ1 and cPHx3, respectively. Baseline-corrected data are means ± SEM of individual cell measurements quantifying n=33 cells (medium control) and n=41 cells (carbachol) from 3 independent experiments. Note that a slight decrease in PM cPHx3 occurs following carbachol treatment likely due to inhibition of class I PI3K signaling constitutively stimulated by the presence of serum. Source numerical data are available in source data.
Fig. 7∣
Fig. 7∣. In vitro reconstitution reveals SopB phosphotransferase activity.
(a) Inorganic phosphate release following 30 min treatment of liposomes of the indicated composition with recombinant SopBWT. Data are mean ± SEM of duplicate wells from a representative experiment. (b) Confocal micrographs of GUVs treated for 30 min with SopBWT or an equal volume of dialysis buffer (control). Liposome composition was PtdCho:PtdSer:PtdIns(4,5)P2:PtdEth-Rhodamine B:DSPE-PEG-Biotin (76.8:20:3:0.1:0.1 mol %). Recombinant EGFP-PH-PLCδ1 (1 μM) was added before microscopy. Throughout the Figure, inset numbers are the Liposome/Medium EGFP intensity for the representative liposome. (c) Normalized EGFP-PH-PLCδ1 liposome intensity from (b) across n=4 independent experiments (control, 142 GUVs; SopBWT, 155 GUVs). Data are median, box (25th-75th) and whisker (5th-95th) percentiles of individual liposome measurements. *P = 0.0269. (d) Normalized EGFP-PH-PLCδ1 liposome intensity from n=3 independent experiments (0% PPIns, 86 GUVs; 3% PtdIns(4,5)P2, 84 GUVs; 3% PtdIns(3,4)P2, 83 GUVs). Data are median, box (25th-75th) and whisker (5th-95th) percentiles of individual liposome measurements. ***P = 0.0006. (e) Representative micrographs of recombinant EGFP-cPHx1 (0.5 μM) incubated with increasing mol % PtdIns(3,4)P2. Background composition of liposomes was PtdCho:PtdIns(4,5)P2:PtdIns(4)P:PtdIns(3,4)P2:PE-Rhodamine B:DSPE-PEG-Biotin (77-X:1.5:1.5:X:0.1:0.1). Corresponding normalized intensity profiles of EGFP and Rhodamine B channels are plotted below. (f) Corresponding normalized EGFP-cPHx1 liposome intensity from (e) across n=3 independent experiments (0%, 53 GUVs; 0.1%, 64 GUVs; 0.5%, 80 GUVs; 1.0%, 68 GUVs; 3.0%, 78 GUVs). Data are median, box (25th-75th) and whisker (5th-95th) percentiles of individual liposome measurements. Inset graph (red box) shows liposome measurements (background points) and paired trial averages (foreground points) from 0% and 0.1% PtdIns(3,4)P2-containing GUVs. (g) GUVs treated for 30 min with dialysis buffer (control), SopBWT, or SopBWT(NEM) (enzyme pre-treated with a molar excess of NEM) were analyzed by confocal microscopy. Representative EGFP-cPHx1 localization is presented with normalized intensity profiles below. GUV compositions (mol %) were PtdCho:PtdSer:PtdIns(4,5)P2 or PtdIns(4)P:PtdEth-Rhodamine B:DSPE-PEG-Biotin (76.8:20:3:0.1:0.1). (h) Quantification of (g) from n=5 independent experiments per condition (Control, 177 GUVs; SopBWT, 185 GUVs; SopBWT(NEM), 147 GUVs; SopB(WT)) or n=4 independent experiments (PtdIns(4)P substrate, 130 GUVs). Data are median, box (25th-75th) and whisker (5th-95th) percentiles of individual liposome measurements. ****P < 0.0001. Source numerical data are available in source data.
Fig. 8
Fig. 8. Time-resolved HPLC-MS analysis of SopB phosphotransferase-phosphatase activities.
(a-e) SopB generates multiple 3-phosphorylated PPIns species in vitro. Quantitative measurement of PPIns species by HPLC-MS. Initial LUV substrate composition (mol %) was PtdCho:PtdSer:PtdIns(4,5)P2 (75:20:5), with 0.5 nmol 18:0-20:4 PtdIns(4,5)P2 per reaction. [SopB]low-treated liposomes were incubated with either 0.1 μg (14.3 nM) recombinant SopBWT (blue) or SopBC460S (grey), or left untreated (no enzyme control, grey dotted line). At the indicated timepoints, samples were snap-frozen in liquid nitrogen. Samples were then quenched, internal standards added, and phosphate groups methylated by trimethylsilyl diazomethane during extraction. Following separation, PtdInsP3 levels (b) were quantified by infusing lipids into the mass spectrometer without ozonolysis, while the remainder (a,c,d,e) were analyzed post-ozonolysis. Data are presented as the mean amount of specified lipid (ng) per assay ± SEM from two biological replicates, corrected for relevant internal standards. (f) PtdInsP3 was analyzed as in (b) but following the incubation of LUVs with 0.5 μg of enzyme per reaction (71.5 nM, [SopB]high). Data are plotted as the mean of duplicate HPLC-MS analyses from one biological reaction replicate. (g,h) Separation of PtdIns(3,4)P2 and PtdIns(4,5)P2 regio-isomers in samples treated with (g) SopBWT or (h) SopBC460S. An example HPLC-MS trace is presented derived from [SopB]high reaction following 2 min incubation with enzyme. Note the de novo appearance of PtdIns(3,4)P2 at the highlighted elution time of ≈20.6 min. (i) Schematic illustration of possible pathways of PtdIns(4,5)P2 to PtdIns(3,4)P2 conversion by the phosphoinositide phosphotransferase activity of SopB. During invasion, PtdIns(3,4)P2 accumulates both in PM ruffles and the invaginating regions of the PM prior to fission of the vacuole neck and closure of the vacuole. PtdIns(4,5)P2 suffices to generate PtdIns(3,4)P2 via three possible phosphotransfer-based mechanisms: 1) intermolecular transfer giving rise to PtdIns(3,4,5)P3, followed by 5-phosphatase activity; 2) intermolecular transfer preceded by 5-phosphatase activity; and 3) intramolecular transfer (phosphoisomerase). The former pathways differ in the predicted intermediate species. Source numerical data are available in source data.

Comment in

References

    1. Balla T Phosphoinositides: tiny lipids with giant impact on cell regulation. Physiological reviews 93, 1019–1137 (2013). - PMC - PubMed
    1. Hakim S, Bertucci MC, Conduit SE, Vuong DL & Mitchell CA Inositol polyphosphate phosphatases in human disease. Current topics in microbiology and immunology 362, 247–314 (2012). - PubMed
    1. Sasaki T et al. Mammalian phosphoinositide kinases and phosphatases. Progress in Lipid Research 48, 307–343 (2009). - PubMed
    1. Stephens LR, Jackson TR & Hawkins PT Agonist-stimulated synthesis of phosphatidylinositol(3,4,5)-trisphosphate: a new intracellular signalling system? Biochimica et biophysica acta 1179, 27–75 (1993). - PubMed
    1. Bilanges B, Posor Y & Vanhaesebroeck B PI3K isoforms in cell signalling and vesicle trafficking. Nature Reviews Molecular Cell Biology 20, 515–534 (2019). - PubMed

Methods References

    1. Zhu L, Jorgensen JR, Li M, Chuang YS & Emr SD ESCRTS function directly on the lysosome membrane to downregulate ubiquitinated lysosomal membrane proteins. eLife 6, 1–20 (2017). - PMC - PubMed
    1. Wennström S & Downward J Role of Phosphoinositide 3-Kinase in Activation of Ras and Mitogen-Activated Protein Kinase by Epidermal Growth Factor. Molecular and Cellular Biology 19, 4279–4288 (1999). - PMC - PubMed
    1. Leibiger B et al. Insulin-feedback via PI3K-C2alpha activated PKBalpha/Akt1 is required for glucose-stimulated insulin secretion. FASEB journal : official publication of the Federation of American Societies for Experimental Biology 24, 1824–37 (2010). - PubMed
    1. Levin R et al. Multiphasic dynamics of phosphatidylinositol 4-phosphate during phagocytosis. Molecular biology of the cell 28, 128–140 (2017). - PMC - PubMed
    1. Inoue T, do Heo W, Grimley JS, Wandless TJ & Meyer T An inducible translocation strategy to rapidly activate and inhibit small GTPase signaling pathways. Nature Methods 2, 415–418 (2005). - PMC - PubMed

Publication types

MeSH terms

Substances

LinkOut - more resources