. 2022 May;28(5):946-957.
doi: 10.1038/s41591-022-01786-3. Epub 2022 Apr 28.

Immunogenicity and therapeutic targeting of a public neoantigen derived from mutated PIK3CA

Affiliations

Immunogenicity and therapeutic targeting of a public neoantigen derived from mutated PIK3CA

Smita S Chandran et al. Nat Med. 2022 May.

Abstract

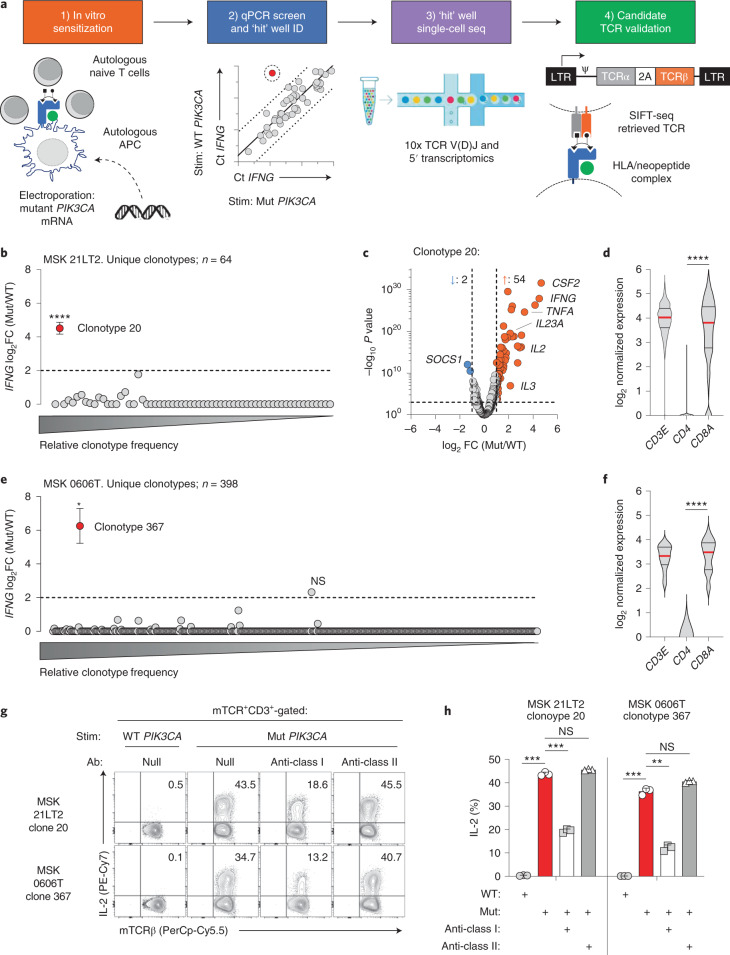
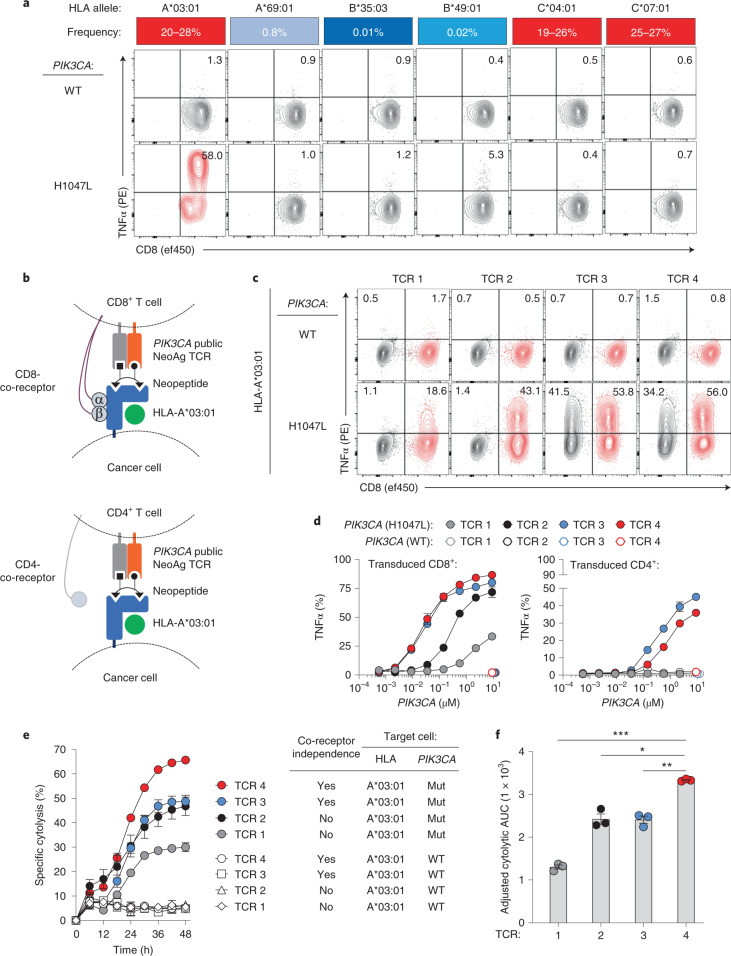
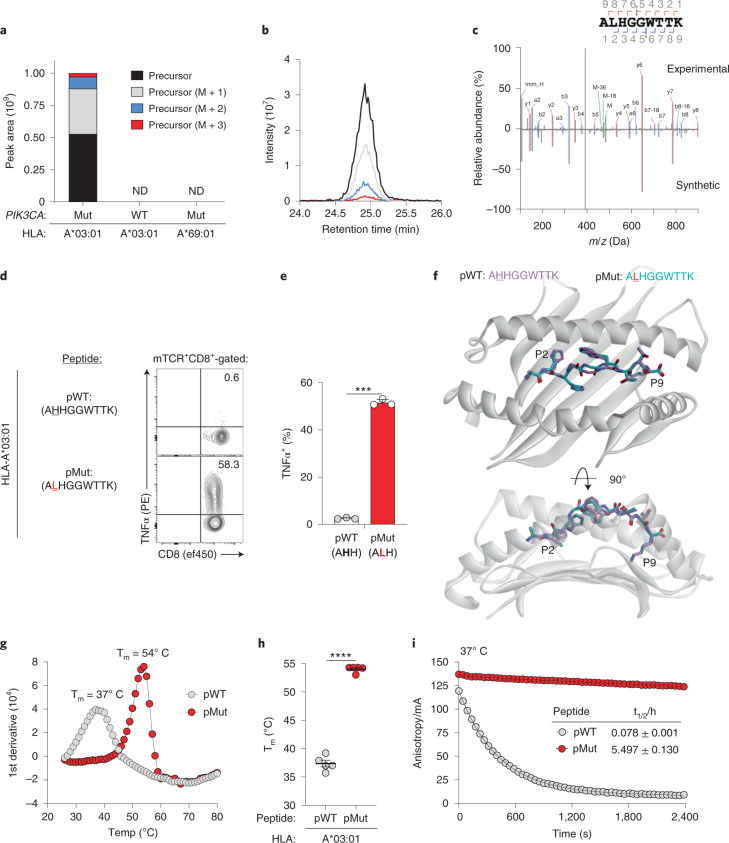
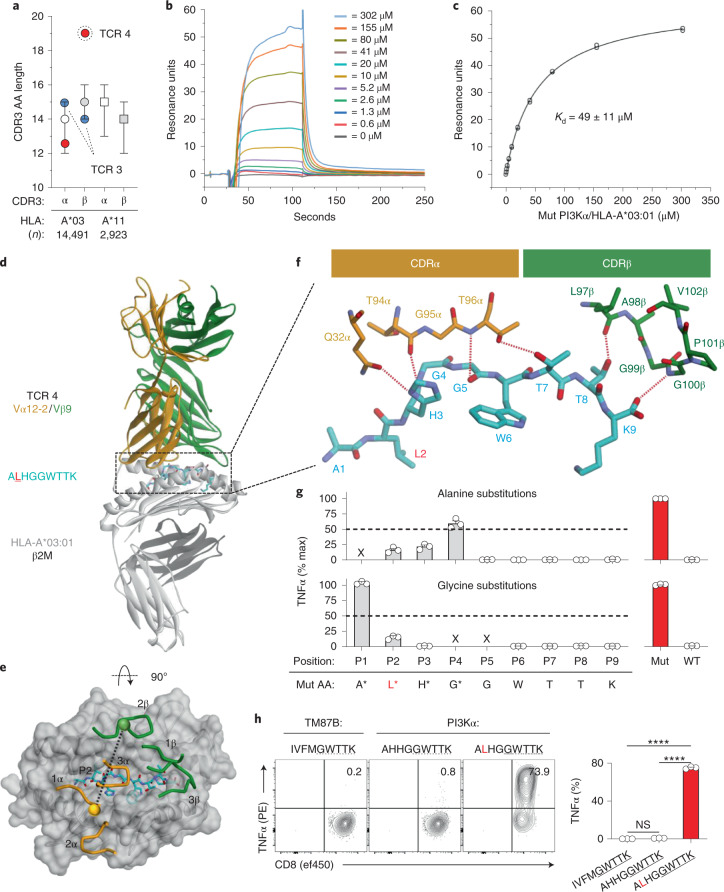
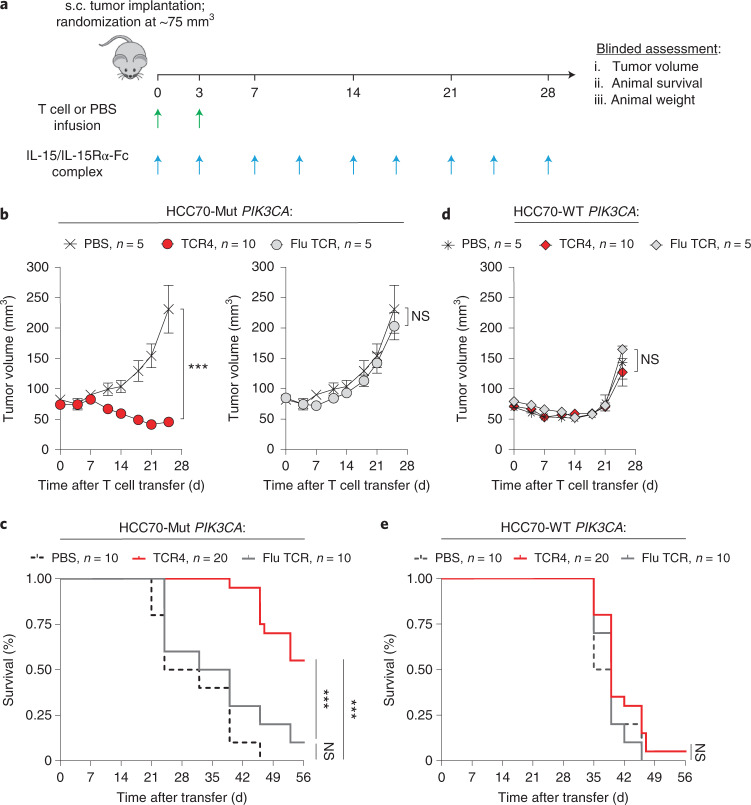
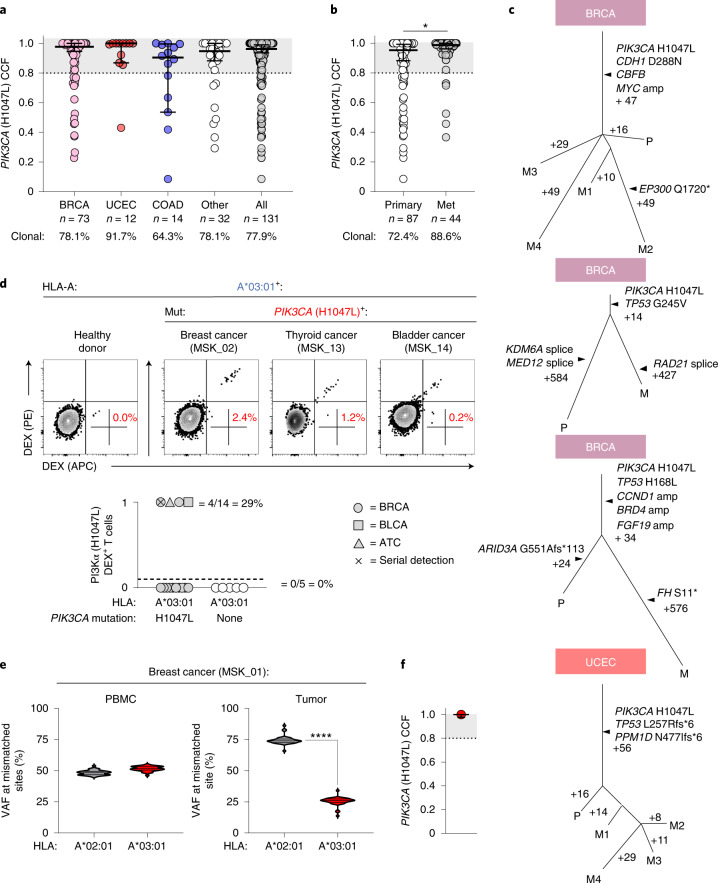
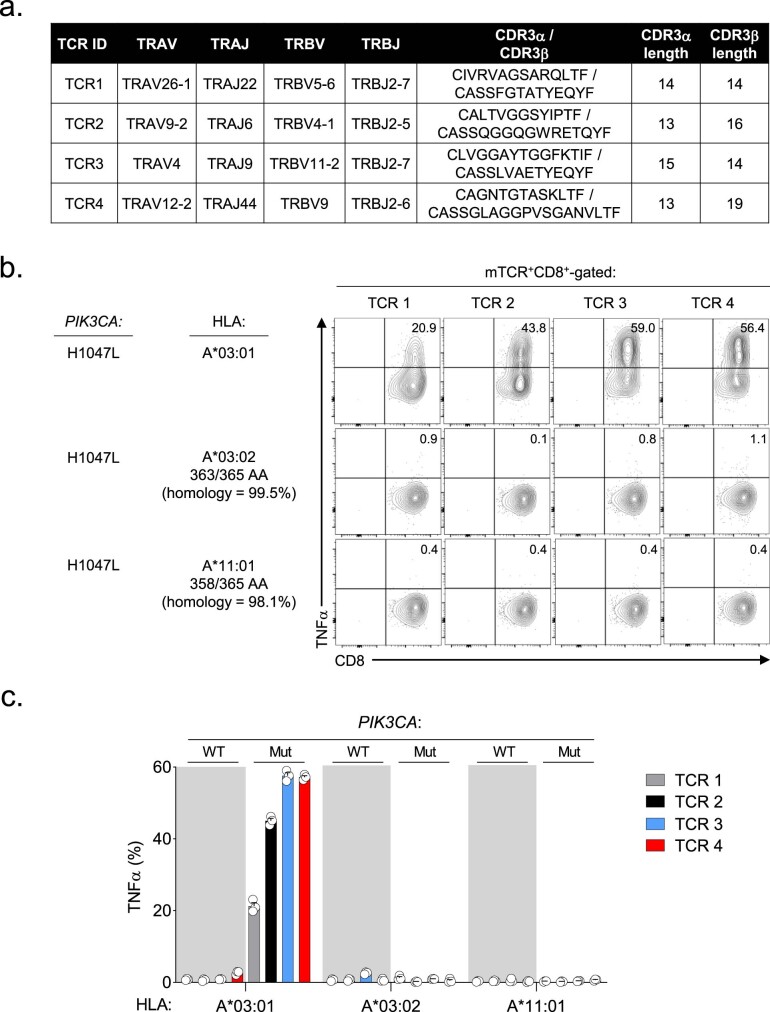
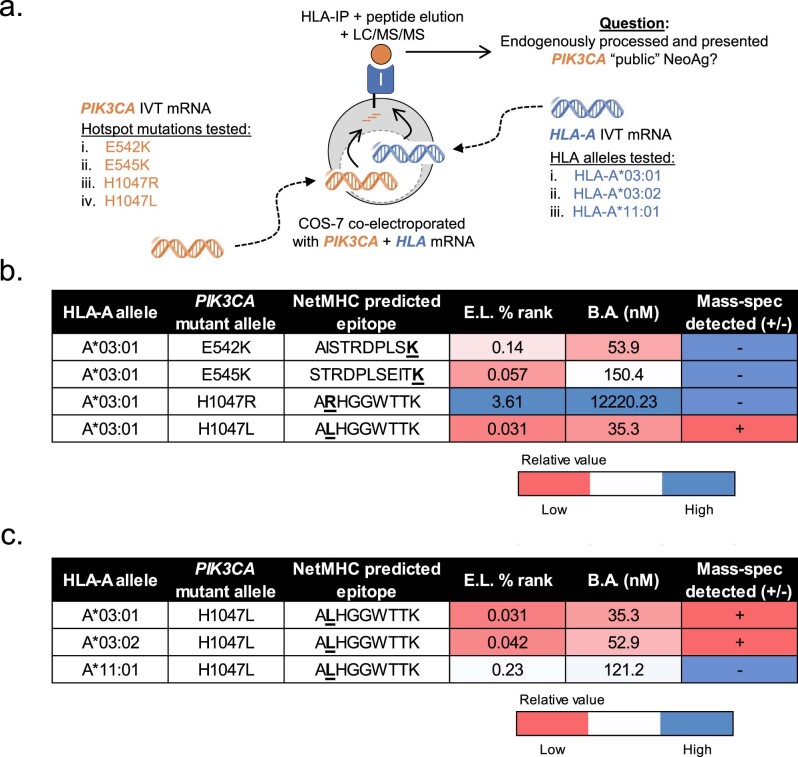
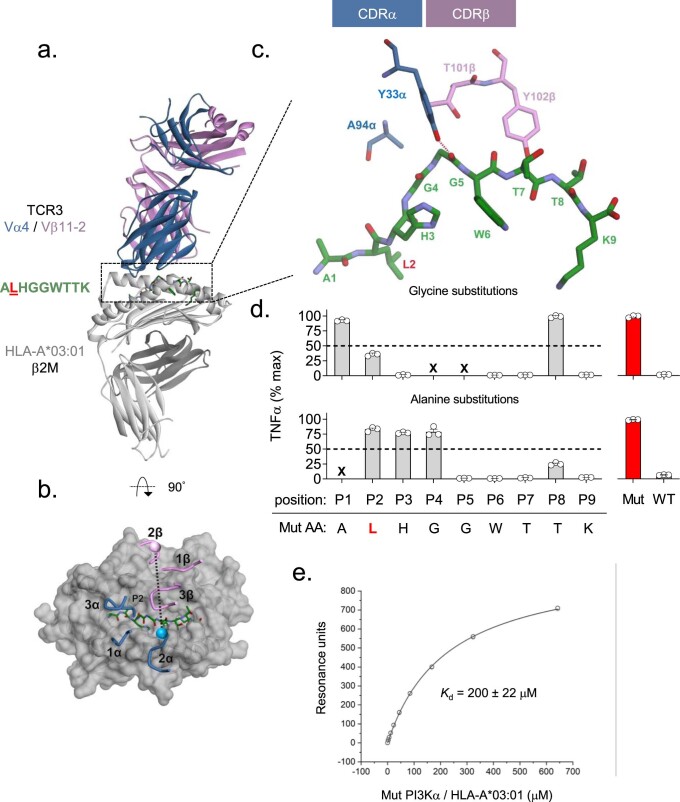
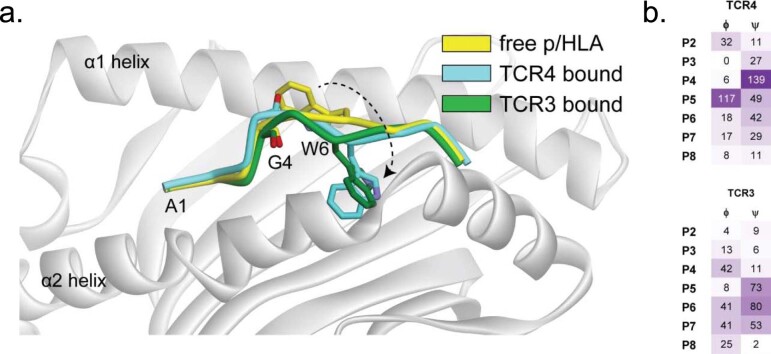
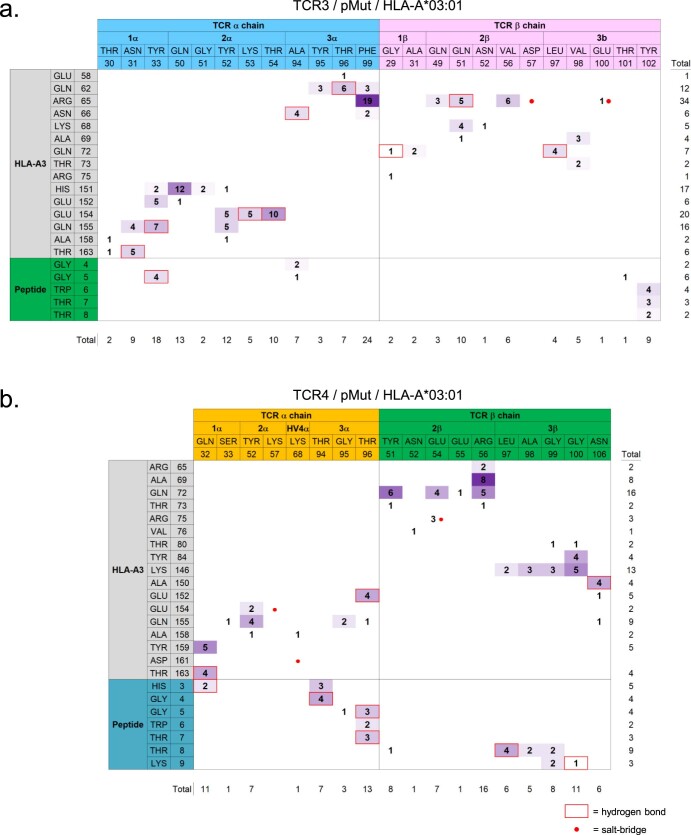
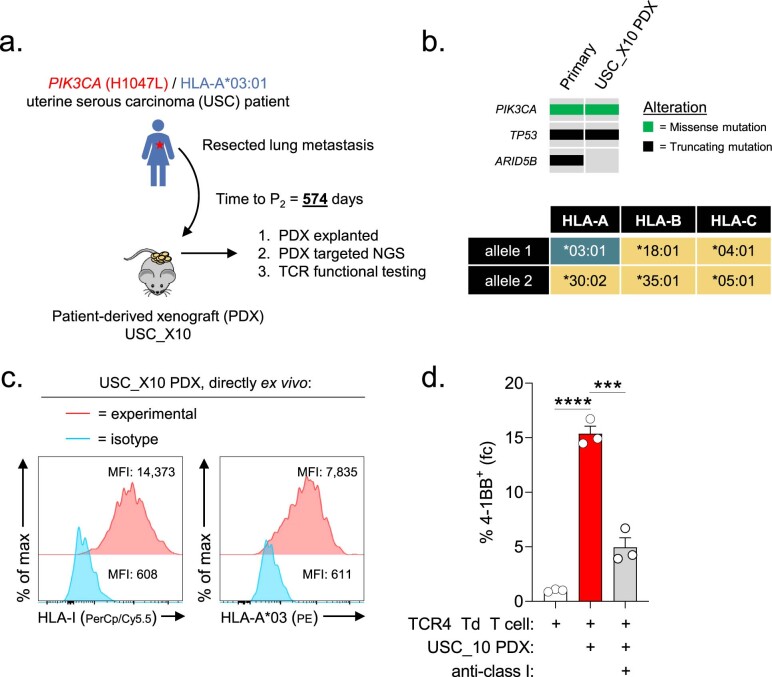
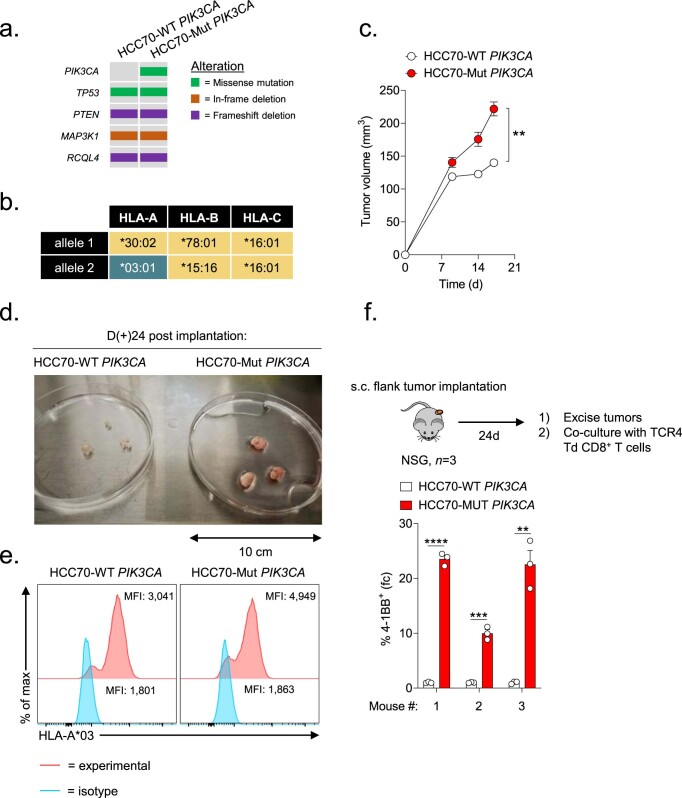
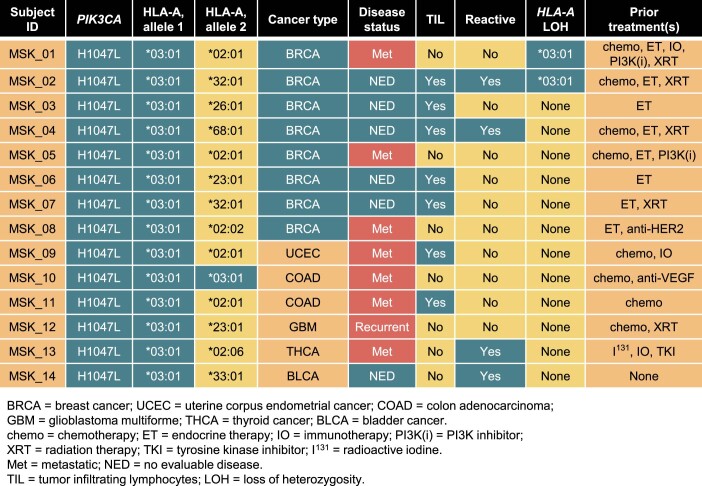
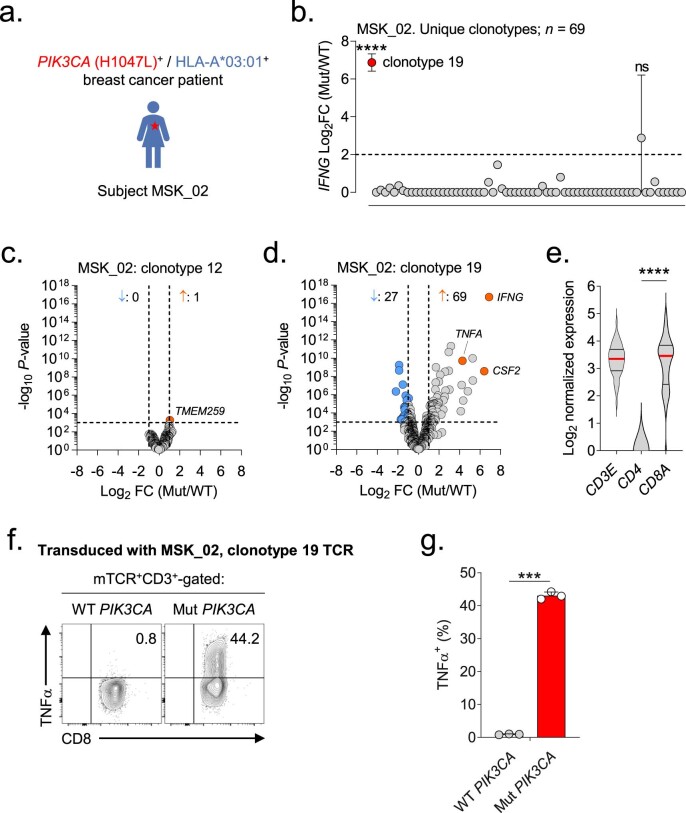
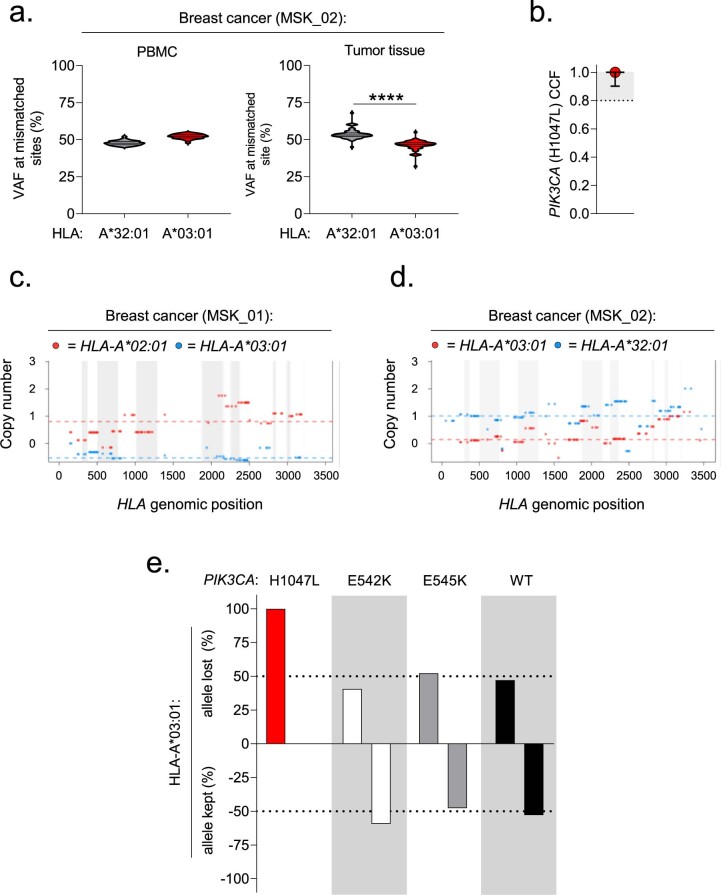
Public neoantigens (NeoAgs) represent an elite class of shared cancer-specific epitopes derived from recurrently mutated driver genes. Here we describe a high-throughput platform combining single-cell transcriptomic and T cell receptor (TCR) sequencing to establish whether mutant PIK3CA, among the most frequently genomically altered driver oncogenes, generates an immunogenic public NeoAg. Using this strategy, we developed a panel of TCRs that recognize an endogenously processed neopeptide encompassing a common PIK3CA hotspot mutation restricted by the prevalent human leukocyte antigen (HLA)-A*03:01 allele. Mechanistically, immunogenicity to this public NeoAg arises from enhanced neopeptide/HLA complex stability caused by a preferred HLA anchor substitution. Structural studies indicated that the HLA-bound neopeptide presents a comparatively 'featureless' surface dominated by the peptide's backbone. To bind this epitope with high specificity and affinity, we discovered that a lead TCR clinical candidate engages the neopeptide through an extended interface facilitated by an unusually long CDR3β loop. In patients with diverse malignancies, we observed NeoAg clonal conservation and spontaneous immunogenicity to the neoepitope. Finally, adoptive transfer of TCR-engineered T cells led to tumor regression in vivo in mice bearing PIK3CA-mutant tumors but not wild-type PIK3CA tumors. Together, these findings establish the immunogenicity and therapeutic potential of a mutant PIK3CA-derived public NeoAg.


Conflict of interest statement

S.S.C. and C.A.K. are inventors of the TCR discovery platform and the PIK3CA public NeoAg TCRs described in this manuscript, which were licensed to Intima Bioscience in December 2021. Licensing revenue is shared with S.S.C. and C.A.K. according to MSKCC institutional policies. MSKCC has filed for patent protection for D.A.S. and M.G.K. for work related to mass spectrometry. C.A.K. has consulted for, or is on the scientific and/or clinical advisory boards for Achilles Therapeutics, Aleta BioTherapeutics, Bellicum Pharmaceuticals, Bristol Myers Squibb, Catamaran Bio, Cell Design Labs, Decheng Capital, G1 Therapeutics, Klus Pharma, Obsidian Therapeutics, PACT Pharma, Roche/Genentech and T-knife. B.M.B. has previously consulted for Eurkea Therapuetics and is on the scientific advisory board of T-Cure Bioscience. D.A.S. has an equity interest in, consults for or is on the board of Sellas Life Sciences, Pfizer, Oncopep, Actinium, Co-Immune, Eureka, Repertoire, Sapience, Iovance and Arvinas. B.W. reports ad hoc membership of the scientific advisory board of Repare Therapeutics. A.D.C.P. has received honoraria or has served on advisory boards for Ignyta/Genentech/Roche, Loxo/Bayer/Lilly, Takeda/Ariad/Millenium, TP Therapeutics, AstraZeneca, Pfizer, Blueprint Medicines, Helsinn, Beigene, BergenBio, Hengrui Therapeutics, Exelixis, Tyra Biosciences, Verastem, MORE Health, Abbvie, 14ner/Elevation Oncology, ArcherDX, Monopteros, Novartis, EMD Serono, Medendi, Repare RX, Nuvalent, Merus, Chugai Pharmaceutical, Remedica, mBrace, AXIS, EPG Health, Harborside Nexus, Liberum, RV More, Ology, Amgen, TouchIME and Janssen; Associated Research Paid to Institution from Pfizer, Exelixis, GlaxoSmithKlein, Teva, Taiho and PharmaMar; Research support from Foundation Medicine; Royalties from Wolters Kluwer; Other from Merck, Puma, Merus and Boehringer Ingelheim; and CME Honoraria from Medscape, OncLive, PeerVoice, Physicians Education Resources, Targeted Oncology, Research to Practice, Axis, Peerview Institute, Paradigm Medical Communications, WebMD, MJH Life Sciences, Med Learning, Imedex, Answers in CME, Clinical Care Options, EPG Health, JNCC/Harborside, Liberum and Remedica. All other authors declare no competing interests.

Figures

Fig. 1
Fig. 1. Development and validation of the SIFT-seq discovery platform for Mut PIK3CA-specific TCRs.
a, Schematic overview of the SIFT-seq TCR discovery platform. b, log2 fold change (FC) ratio of IFNG transcripts from n = 64 unique TCR clonotypes identified using single-cell RNA and V(D)J TCR sequencing from screen-positive ‘hit’ well MSK 21LT2. Matched aliquots of sensitized T cells from HD1 were stimulated with PIK3CA (H1047L) (Mut) or WT PIK3CA before single-cell sequencing. The mean IFNG ratio for all evaluable TCR clonotypes is shown. Statistical analyses were performed for all clonotypes with a minimal ratio of ≥2 (dashed line). The x axis indicates the relative frequencies of individual TCR clonotypes. ****P = 1.37 × 10−28 using two-sided Welch’s t-test. c, Volcano plot displaying global transcriptomic changes for MSK 21LT2 clonotype 20 after stimulation with Mut versus WT PIK3CA. Vertical and horizontal dashed lines indicate thresholds for log2 gene expression FC and statistical significance, respectively. Orange and blue dots represent significantly upregulated and downregulated genes after Mut PIK3CA stimulation, respectively. d, Violin plots depicting transcript levels for the lineage markers CD3E, CD4 and CD8A from MSK 21LT2 clonotype 20. ****P < 0.0001 using two-sided Student’s t-test. e, log2 FC ratio of IFNG transcripts from n = 398 unique TCR clonotypes identified using single-cell sequencing from screen-positive ‘hit’ well MSK 06006T derived from HD2. *P = 1.41 × 10−5 using two-sided Welch’s t-test. NS, not significant. f, Violin plots depicting lineage marker transcript expression for MSK 0606T clonotype 367. ****P < 0.0001 using two-sided Student’s t-test. Representative FACS plots (g) and summary bar graph (h) (n = 3 biologically independent replicates per condition) displaying the frequency of intracellular IL-2 production in polyclonal T cells following retroviral transduction with SIFT-seq-retrieved TCR candidates. The reconstructed TCR expresses a murine constant chain (mTCR), enabling detection with an anti-mTCR-specific antibody. Transduced T cells (live+mTCR+CD3+) were co-cultured with autologous moDCs electroporated with mRNA encoding Mut or WT PIK3CA in the absence or presence of pan-HLA class I or class II blocking antibodies. ***P < 0.001, **P = 0.0036 and NS using two-sided Student’s t-test with Bonferroni correction. b,e,h, Symbols and bar graphs are displayed as mean ± s.e.m. d,f, Violin distributions are centered around the median (red horizontal line) with quartile ranges displayed above and below (dashed horizontal lines). The maxima and minima are represented by the top and bottom of each plot.
Fig. 2
Fig. 2. HLA restriction and functional characterization of PIK3CA public NeoAg-specific TCRs.
a, Deconvolution of the HLA-I restriction element for the MSK 21LT2 clonotype 20 TCR. The frequency of individual HLA-I alleles expressed by HD1 in North American and European populations is displayed as a heat map. FACS plots show the frequency of CD8+ TCR-transduced T cells that secrete TNFα after co-culture with HLA-I mono-allelic cell lines expressing WT or Mut PIK3CA. b, Cartoon illustrating the experimental design to assess the co-receptor dependence and functionality of SIFT-seq-retrieved PIK3CA public NeoAg TCR panel members. TCRs 1–4 were individually RV transduced into enriched CD8+ or CD4+ T cells and co-cultured with target cells co-expressing HLA-A*03:01 and either WT or Mut PIK3CA. c, Representative FACS plots of CD4+ (black) and CD8+ (red) T cells expressing individual PIK3CA public NeoAg TCR panel members after co-culture with HLA-A*03:01+ target cells that express either WT or Mut PIK3CA. Numbers within each plot indicate the frequency of TNFα-producing TCR-transduced CD4+ (upper left quadrant) or CD8+ (upper right quadrant) T cells. The FACS plots shown in a and c are pre-gated on live+mTCR+ T cells. d, The functional avidity of CD8+ (left) or CD4+ (right) T cells individually transduced with TCRs 1–4. Transduced T cells were co-cultured with an HLA-I mono-allelic cell line expressing HLA-A*03:01 and electroporated with indicated concentrations of WT or Mut PIK3CA mRNA. e, Kinetic impedance-based lytic assay measuring the % specific cytolysis of HLA-A*03:01+ target cells expressing WT or Mut PIK3CA. f, Adjusted cytolytic AUC values indicating the cumulative cytolytic capacity of TCRs 1–4 against A*03:01+/Mut PIK3CA+ target cells. ***P = 0.001, **P = 0.01 and *P = 0.02; two-sided Student’s t-test was used for statistical analysis. Data shown in d, e and f are representative of two independent experiments using n = 3 biologically independent replicates per condition per independent experiment. Symbols and bar graphs are displayed as mean ± s.e.m. AUC, area under the curve.
Fig. 3
Fig. 3. Mechanism of immunogenicity for a PIK3CA public NeoAg.
a, Skyline analysis of HLA-I-bound peptides resulting from an LC–MS/MS-based immune-peptidomic screen. Relative abundance of precursor ions derived from peptides encompassing the PI3Kα protein’s 1047 position eluted from the indicated HLA-A mono-allelic cell lines. Cells expressed either WT PIK3CA or Mut PIK3CA (H1047L). ND indicates conditions in which no PI3Kα-derived AA sequences encompassing the 1047 hotspot position were experimentally detected. b, Corresponding chromatographic retention times of precursor ions derived from a Mut PI3Kα peptide eluted from HLA-A*03:01+/Mut PIK3CA+ cells. c, Mirror plot displaying the MS2 spectra of the Mut PI3Kα-derived public neoepitope (ALHGGWTTK; pMut; top) eluted from HLA-A*03:01+/Mut PIK3CA+ cells and a synthetically generated peptide (bottom). Peaks represent b ions in blue and y ions in red. Representative intracellular FACS analysis (d) and summary bar graph (e) for TNFα production in T cells transduced with TCR4 and co-cultured with HLA-A*03:01+ target cells pulsed with 1 μM of pMut versus pWT. Results shown after gating on live+mTCR+CD8+ lymphocytes. Bar graph is displayed as mean ± s.e.m. using n = 3 biologically independent replicates per condition. ***P = 0.001 using two-sided Student’s t-test. f, Structural superimposition of the pMut and pWT peptides bound to HLA-A*03:01. The conformations of pMut and pWT peptides are nearly identical with all α carbon atoms superimposing with a root mean square deviation of 0.73 Å. Representative thermal melt curves (g) and summary scatter plot (h) displaying the melting temperatures (Tm) of the pMut and pWT/HLA-A*03:01 complexes using differential scanning fluorimetry. Symbols are displayed as mean ± s.e.m. using n = 5 independently performed experiments. ****P < 0.0001 using two-sided Student’s t-test. i, Dissociation of a fluorescently labeled pMut or pWT from soluble HLA-A*03:01 complexes at 37 °C using fluorescence anisotropy. Solid lines show fits to exponential decay functions. Half-lives (t1/2) are shown for each peptide ± s.e.m. Data are representative of n = 3 technical replicates per condition per time point. mA, millianisotropy.
Fig. 4
Fig. 4. Structural correlates of affinity and specificity for a PIK3CA public NeoAg-specific TCR.
a, CDR3α and CDR3β AA lengths of PIK3CA public NeoAg-specific TCR3, TCR4 and a panel of n = 17,414 HLA-A*03:01-restricted and HLA-A*11:01-restricted TCR sequences. Results shown as median ± interquartile range. Representative SPR sensorgram (b) and steady-state binding equilibrium (c) measuring the dissociation constant (Kd) for TCR4 to the pMut/HLA-I complex. Results shown are the average ± s.d. of n = 4 independent experiments. d, Structural overview of the TCR4 pMut/HLA-A*03:01 ternary complex at 3.1-Å resolution. The color scheme is indicated and replicated throughout. e, Top view of the pMut/HLA-A*03:01 complex displaying the crossing angle and positions of the six CDR loops of TCR4. Spheres represent the centers of mass of the TCR’s Vα and Vβ domains. f, AAs of TCR4’s CDRα and CDRβ loops that interact with the pMut peptide. Hydrogen bonds (n = 6) are indicated by red dashed lines. AAs are identified by standard one-letter codes followed by position number. The side chains of contacting residues from the TCR are also identified by AA and hemi-chain position number. g, Identification of TCR4’s peptide recognition motif using alanine and glycine scanning. Intracellular FACS for TNFα production to Ala (upper) or Gly (lower) substituted peptides. TCR4-transduced T cells (identified by gating on mTCR+ lymphocytes) were co-cultured with HLA-A*03:01+ targets pulsed with 1 μM of indicated peptides. Results are shown as the mean ± s.e.m. percent maximum response relative to the native pMut peptide using n = 3 biologic replicates per condition. ‘x’ indicates positions not amenable to substitution. h, Measurement of the cross-reactivity potential of TCR4. TCR4-transduced T cells were co-cultured with HLA-A*03:01+ targets pulsed with 1 μM of peptides containing the motif ‘x-x-x-x-G-W-T-T-K’. Results are shown as mean ± s.e.m. using n = 3 biologic replicates per condition. ****P < 0.0001 using two-sided Student’s t-test with Bonferroni correction. NS, not significant.
Fig. 5
Fig. 5. In vivo anti-tumor efficacy of adoptively transferred T cells genetically engineered with a PIK3CA public NeoAg TCR.
a, Experimental overview for the evaluation of the in vivo anti-tumor efficacy and safety of targeting Mut PIK3CA using TCR-transduced CD8+ T cells. Mice were randomized between indicated treatment groups once subcutaneously (s.c.) implanted HCC70-Mut PIK3CA or HCC70-WT PIK3CA tumors were established to ~75 mm3. All mice received a twice-weekly intraperitoneal injection of 1 μg of IL-15 pre-complexed with IL-15Rα-Fc (1:1 M) and intravenous injection of CD8+ T cells transduced with TCR4, CD8+ T cells transduced with an influenza (Flu)-specific TCR, or PBS. Mice received 7.5 × 106 and 2.5 × 106 TCR+ T cells on D0 and D3 after randomization. Tumor volumes (b) and overall survival (c) of mice bearing HCC70-Mut PIK3CA tumors infused with the indicated treatment. Tumor volumes (d) and overall survival (e) of mice bearing established HCC70-WT PIK3CA tumors infused with the indicated treatment. Data in b and d are shown as mean ± s.e.m. and are representative of two independently performed experiments (TCR4 n = 10, Flu TCR n = 5, PBS n = 5). ***P < 0.001 and NS using two-way ANOVA. Pooled survival data from two identically performed experiments are shown in c and e and are plotted as a Kaplan–Meier survival curve (TCR4 n = 20, Flu TCR n = 10, PBS n = 10). ***P < 0.001 and NS using log-rank test. D, day; NS, not significant.
Fig. 6
Fig. 6. Clonality, immunogenicity and immune resistance to a PIK3CA public NeoAg in patients with cancer.
a, Pan-cancer analysis measuring the clonality of PIK3CA (H1047L) in n = 131 unique MSK patients with cancer. Clonality is defined as a CCF of ≥80%, indicated by the shaded gray area. b, Comparison of PIK3CA (H1047L) CCF in primary versus metastatic tumor sites. P = 0.0245 using two-sided Student’s t-test. c, Phylogenetic analysis measuring the clonal conservation of PIK3CA (H1047L) in primary (P) and metastatic (M) tumor sites within the same patient. d, Representative FACS and summary plot for the detection of circulating CD8+ T cells specific for the pMut/HLA-A*03:01 (A*03:01) epitope in n = 14 HLA-A*03:01+ patients with a history of a PIK3CA (H1047L) cancer or n = 5 HLA-A*03:01+ healthy donors. Percentages in FACS plots represent the frequency of gated live+CD8+dual pMut/HLA-A*03:01 dextramer+ lymphocytes. 0 = no detection; 1 = detection. e, f, Variant allele frequency (VAF) at each of the positions in HLA-A that are mismatched between HLA-A*02:01 and HLA-A*03:01 are shown for the PMBC and tumor samples of patient MSK_01 who demonstrated a tumor-specific HLA-A*03:01 LOH in the setting of PIK3CA (H1047L) clonal conservation. P < 0.0001 by two-sided Student’s t-test. Results in a, b and f are displayed as median ± 95% confidence interval. Violin distributions in e are centered around the median (solid horizontal line) with quartile ranges displayed above and below (dashed horizontal lines). The maxima and minima are represented by the top and bottom of each plot. ATC, anaplastic thyroid cancer; BLCA, bladder cancer; BRCA, breast invasive carcinoma; COAD, colon adenocarcinoma; DEX, HLA dextramer; UCEC, uterine corpus endometrial carcinoma.
Extended Data Fig. 1
Extended Data Fig. 1. Variable chain gene sequences and HLA specificity of a PIK3CA public NeoAg-specific TCR panel.
(a) Table listing TRAV, TRAJ, TRBV and TRBJ gene segment composition, CDR3 sequences, and CDR3 lengths for a panel of PIK3CA public NeoAg TCRs retrieved using the SIFT-seq discovery platform. (b) Representative FACS plots and (c) summary bar graphs demonstrating the specificity of PIK3CA public NeoAg TCRs 1-4 for HLA-A03 supertype members HLA-A*03:01, HLA-A*03:02, and HLA-A*11:01. The number of shared amino acids and % homology of each supertype member to HLA-A*03:01 are shown. T cells transduced with individual TCR panel members were co-cultured with mono-allelic cell lines co-expressing the indicated HLA-A03 supertype member and either Mut or WT PIK3CA. Numbers within each FACS plot and bar graph indicate the frequency of TNFα producing T cells after pre-gating on live+mTCR+CD8+ cells. Bar graphs displayed as mean ± SEM using n = 3 biologic replicates per condition. Data shown is representative of 2 independent experiments.
Extended Data Fig. 2
Extended Data Fig. 2. An immuno-peptidomic screen for HLA-A3 supertype-restricted public neoantigens resulting from common PIK3CA hotspot mutations.
(a) Schematic overview of an HLA immunoprecipitation/liquid chromatography tandem mass-spectrometry (HLA-IP/MS) screen to identify endogenously processed and presented peptides resulting from the PIK3CA hotspot mutations E542K, E545K, H1047R and H1047L in the context of various HLA-A3 supertype members. COS-7 was co-electroporated with IVT mRNA encoding either HLA-A*03:01, HLA-A*03:02, or HLA-A*11:01 and an individual PIK3CA hotspot mutation. (b) Summary table listing the NetMHCpan 4.1 predicted peptide sequence, eluted ligand % rank, and binding affinity (B.A.) of various peptides containing a PI3Kα hotspot mutations to HLA-A*03:01. Whether the peptide was detected by HLA-IP/MS is listed in the adjacent column. (c) Summary table listing the NetMHCpan 4.1 predicted peptide sequence, eluted ligand (E.L.) % rank, and binding affinity (B.A.) of the ALHGGWTTK peptide (pMut) to HLA-A*03:01, HLA-A*03:02, and HLA-A*11:01. Whether the peptide was detected by HLA-IP/MS is listed in the adjacent column. Heat map colors in (b) and (c) indicate the relative value for the NetMHCpan 4.1 prediction (red = low, blue = high) or whether the peptide sequence was detected by HLA-IP/MS (red = yes, blue = no).
Extended Data Fig. 3
Extended Data Fig. 3. Structural details of the TCR3/pMut/HLA-A*03:01 complex, correlations with TCR3’s peptide recognition motif, and measurement of TCR3’s binding affinity.
(a) Structural overview of the TCR3 pMut/HLA-A*03:01 ternary complex at 2.1 Å resolution. The color scheme is indicated and replicated throughout. (b) Top view of the pMut/HLA-A*03:01 complex displaying the crossing angle and positions of TCR3’s six CDR loops. Spheres show the centers of mass of the TCR Vα and Vβ domains. (c) Amino acids of TCR3’s CDRα and CDRβ loops that interact with the pMut peptide. The single hydrogen bond formed between TCR3 and pMut is indicated by a dashed red line. Amino acids are identified by standard one-letter codes followed by position number. The side chains of contacting residues from the TCR are also identified by AA and hemi-chain position number. (d) Identification of TCR3’s peptide recognition motif using alanine and glycine scanning. Intracellular FACS for TNFα production to Gly (upper) or Ala (lower) substituted peptides. TCR3-transduced T cells (identified by gating on mTCR+ lymphocytes) were co-cultured with HLA-A*03:01+ targets pulsed with 1μM of indicated peptides. Results shown as the mean ± SEM percent maximum response relative to the native pMut peptide using n = 3 biologic replicates per condition. ‘x’ indicates positions not amenable to substitution. (e) Steady-state binding equilibrium measuring the dissociation constant (Kd) for TCR3 to the pMut/HLA-I complex. Results shown are the average ± standard deviation of n = 3 independent experiments.
Extended Data Fig. 4
Extended Data Fig. 4. Mutant peptide conformational changes following TCR3 or TCR4 binding.
(a) Visualization of the conformations of the pMut backbone in the unbound state and upon binding of TCR3 and TCR4, emphasizing changes that occur in the positions of the P6 Trp side chain and the P4 Gly backbone carbonyl. (b) Table summarizing changes (in degrees) in the backbone dihedral angles (ϕ) and (ψ) of the pMut peptide following binding of TCR4 (top) or TCR3 (bottom). For binding of TCR4, the peptide conformational change is primarily driven by a change in the P4 ψ and P5 ϕ, whereas for TCR3 the change is driven by smaller dihedral changes spanning P4 to P7.
Extended Data Fig. 5
Extended Data Fig. 5. Contact matrices defining interatomic interactions between either TCR3 or TCR4 and the pMut/HLA-A*03:01 complex.
Contact matrices for the (a) TCR3/pMut/HLA-A*03:01 or the (b) TCR4/pMut/HLA-A*03:01 complexes. Contacting amino acids, defined as interatomic distances ≤4 Å, are shown. The numbers in each cell represent the number of interatomic contacts for each amino acid pair listed. Red boxes indicate the presence of a hydrogen bond; red circles indicate a salt-bridge (can be >4 Å). Cells are colored according to the total number of contacts, from white (minimum) to purple (maximum). Residue numbers listed for each TCR hemichain and HLA-A*03:01 reflect subtraction of each protein’s leader sequence as indicated in the PDB data files.
Extended Data Fig. 6
Extended Data Fig. 6. HLA class I-dependent recognition of an HLA-A*03:01+ / PIK3CA (H1047L)+ patient-derived xenograft by TCR4-transduced CD8+ T cells directly ex vivo.
(a) Graphical overview of the generation and experimental testing of a patient-derived xenograft (PDX) from an HLA-A*03:01+ patient with uterine serous carcinoma (USC) associated with the PIK3CA (H1047L) mutation. The PDX (henceforth PDX USC_X10) was established from a surgically resected lung metastasis. (b) Comparison of the mutational landscape and HLA-I haplotype of the primary cancer versus PDX USC_X10 using high-coverage next-gen sequencing (NGS) with the MSK-IMPACT platform. The clonal PIK3CA (H1047L) mutation and TP53 mutation were shared; however, a subclonal ARID5B (p.L1124fs) mutation (variant allele frequency < 7%) detected in the primary tumor was not found in the lung metastasis-derived PDX. (c) FACS analysis of HLA-I and HLA-A*03 expression on a single-cell digest of the explanted USC_X10 PDX after two serial passages in NSG mice. (d) Comparison of the fold-change (fc) in 4-1BB expression on TCR4 transduced CD8+ T cells co-cultured overnight with a single cell-digest of explanted PDX USC_X10 cells in the absence or presence of an anti-HLA-I antibody. Results shown as mean ± SEM using n = 3 biologic replicates per condition. ****P < 0.0001 and ***P = 0.001 using a two-sided Student’s t-test with Bonferroni correction.
Extended Data Fig. 7
Extended Data Fig. 7. Establishment of a transplantable HLA-A*03:01+ / PIK3CA (H1047L) breast cancer tumor model and associated WT PIK3CA control.
(a) Mutational landscape and (b) HLA-I haplotype of isogenic HCC70 breast adenocarcinoma tumor cell lines that express either WT PIK3CA (HCC70-WT PIK3CA) or PIK3CA (H1047L) (HCC70-Mut PIK3CA). (c) In vivo growth kinetics of HCC70-WT PIK3CA or HCC70-Mut PIK3CA following subcutaneous (s.c.) implantation of 3 x 10⁶ tumor cells into immune-deficient NSG mice. Data shown as mean ± SEM for n = 3 mice per tumor cell line. **P = 0.0056 using a two-way ANOVA. (d) Image comparing explanted tumor sizes and (e) FACS analysis of HLA-A*03 expression on HCC70-WT PIK3CA or HCC70-Mut PIK3CA cells 24 days after s.c. implantation. (f) Comparison of the fold-change (fc) in 4-1BB expression on TCR4 transduced (Td) CD8+ T cells co-cultured overnight with a single cell-digest of explanted HCC70-WT PIK3CA or HCC70-Mut PIK3CA tumor cells. Results shown as mean ± SEM using n = 3 biologic replicates per condition. ****P < 0.0001, ***P = 0.0002, and **P = 0.001 using a two-sided Student’s t-test.
Extended Data Fig. 8
Demographics of HLA-A*03:01+ cancer patients expressing the PIK3CA (H1047L) public neoantigen.
Extended Data Fig. 9
Extended Data Fig. 9. Application of the SIFT-seq discovery platform for the identification and retrieval of a Mut PIK3CA-specific TCR from a public NeoAg-expressing breast cancer patient.
(a) PBMC was sampled from an HLA-A*03:01+ breast cancer patient (subject MSK_02) whose tumor harbored the PIK3CA (H1047L) mutation (Mut). (b) Log2 fold-change (FC) ratio of IFNG transcripts from n = 69 unique TCR clonotypes identified using single-cell RNA and V(D)J TCR sequencing from a screen positive ‘hit’ well. Matched aliquots of sensitized T cells from the patient were stimulated with Mut PIK3CA or wildtype PIK3CA (WT) prior to single-cell sequencing. The mean IFNG ratio for all evaluable TCR clonotypes is shown. Statistical analyses were performed for all clonotypes with a minimal ratio ≥2 (dashed line). ****P = 1.98e−17 and ns = not significant using a two-sided Welch’s t-test. Volcano plots displaying global transcriptomic changes for (c) non-reactive MSK_02 clonotype 12 or (d) reactive MSK_02 clonotype 19 following stimulation with Mut versus WT PIK3CA. Vertical and horizontal dashed lines indicate thresholds for gene expression FC and statistical significance, respectively. Orange and blue dots represent significantly up and down-regulated genes following Mut PIK3CA stimulation, respectively. (e) Violin plots depicting transcript levels for the lineage markers CD3E, CD4, and CD8A from MSK_02 clonotype 19. Violin distributions are centered around the median (red horizontal line) with quartiles ranges displayed above and below (dashed horizontal lines). The maxima and minima are represented by the top and bottom of each plot. ****P < 0.0001 using a two-sided Student’s t-test with Bonferroni correction. (f) Representative FACS plots and (g) summary bar graph of TNFα production by CD8+ T cells transduced with the SIFT-seq retrieved MSK_02 clonotype 19 TCR. Transduced T cells were co-cultured with HLA-A*03:01+ target cells that express either WT or Mut PIK3CA. Symbols and bar graphs displayed as mean ± SEM using n = 3 biologic replicates per condition. ***P = 0.0003 using a two-sided Student’s t-test.
Extended Data Fig. 10
Extended Data Fig. 10. HLA-A loss of heterozygosity events in HLA-A*03:01+ cancer patients with tumors harboring PIK3CA (H1047L), PIK3CA (E542K), PIK3CA (E545K), or WT PIK3CA.
(a) Variant allele frequency (VAF) at each of the positions in HLA-A that are mismatched between HLA-A*32:01 and HLA-A*03:01 are shown for the PMBC and tumor samples of subject MSK_02. Violin distributions are centered around the median (solid horizontal line) with quartiles ranges displayed above and below (dashed horizontal lines). The maxima and minima are represented by the top and bottom of each plot. ****P < 0.0001 using a two-sided Student’s t-test. (b) Cancer cell fraction (CCF) for PIK3CA (H1047L) in subject MSK_02. Results displayed as median ± 95% confidence interval. (c,d) Display of HLA-A allele-specific copy numbers for subjects MSK_01 and MSK_02 as an alternative method for establishing HLA loss of heterozygosity. Results were generated using the LOHHLA algorithm. (e) Comparison of which HLA-A allele is lost in HLA-A*03:01+ cancer patients with an HLA-A LOH event and a tumor (any histology) harboring PIK3CA (H1047L), PIK3CA (E542K), or PIK3CA (E545K) mutation. HLA-A LOH events in HLA-A*03:01+ patients with a WT PIK3CA breast cancer are shown as an additional comparison. Hashed lines indicate ±50% threshold.

References

    1. Schumacher TN, Schreiber RD. Neoantigens in cancer immunotherapy. Science. 2015;348:69–74. doi: 10.1126/science.aaa4971. - DOI - PubMed
    1. Parkhurst MR, et al. Unique neoantigens arise from somatic mutations in patients with gastrointestinal cancers. Cancer Discov. 2019;9:1022–1035. doi: 10.1158/2159-8290.CD-18-1494. - DOI - PMC - PubMed
    1. Hu Z, Ott PA, Wu CJ. Towards personalized, tumour-specific, therapeutic vaccines for cancer. Nat. Rev. Immunol. 2018;18:168–182. doi: 10.1038/nri.2017.131. - DOI - PMC - PubMed
    1. McGranahan N, et al. Clonal neoantigens elicit T cell immunoreactivity and sensitivity to immune checkpoint blockade. Science. 2016;351:1463–1469. doi: 10.1126/science.aaf1490. - DOI - PMC - PubMed
    1. Miao D, et al. Genomic correlates of response to immune checkpoint blockade in microsatellite-stable solid tumors. Nat. Genet. 2018;50:1271–1281. doi: 10.1038/s41588-018-0200-2. - DOI - PMC - PubMed

Publication types

Substances