. 2022 Apr 28;12(1):6914.
doi: 10.1038/s41598-022-10634-w.

Dopamine influences attentional rate modulation in Macaque posterior parietal cortex

Affiliations

Dopamine influences attentional rate modulation in Macaque posterior parietal cortex

Jochem van Kempen et al. Sci Rep. .

Abstract

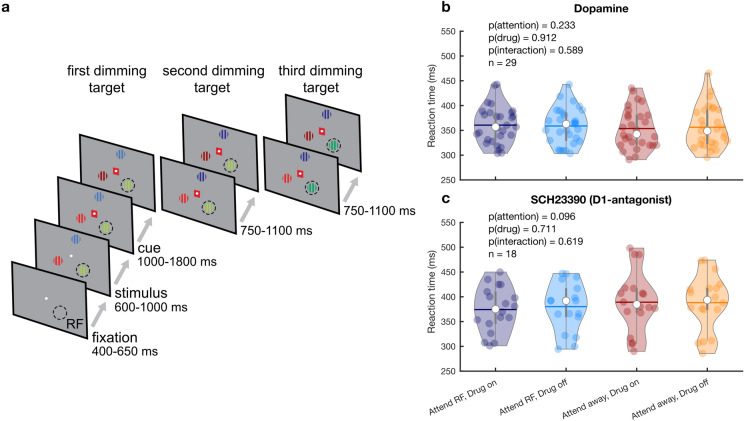
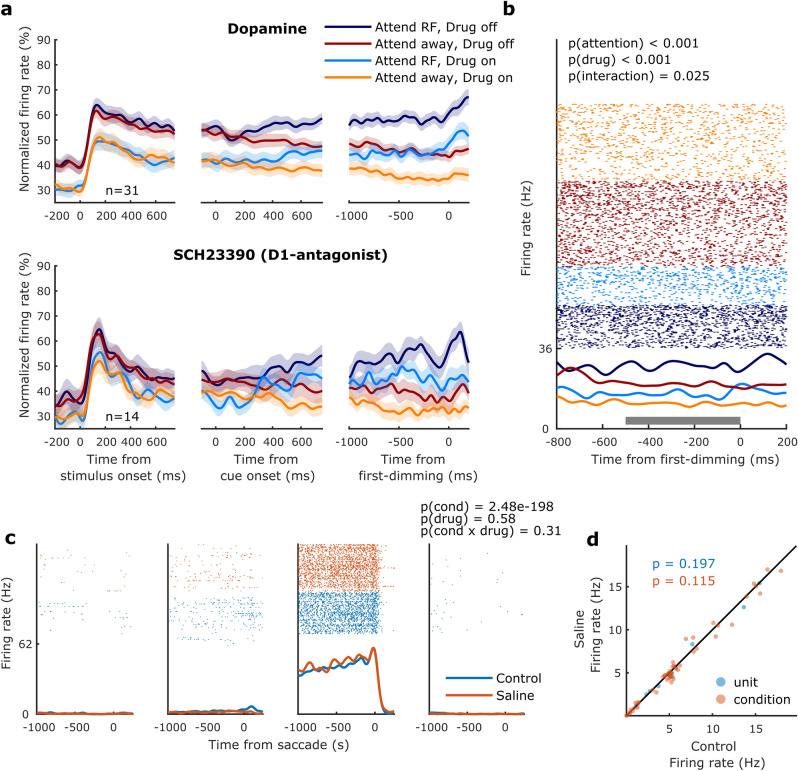
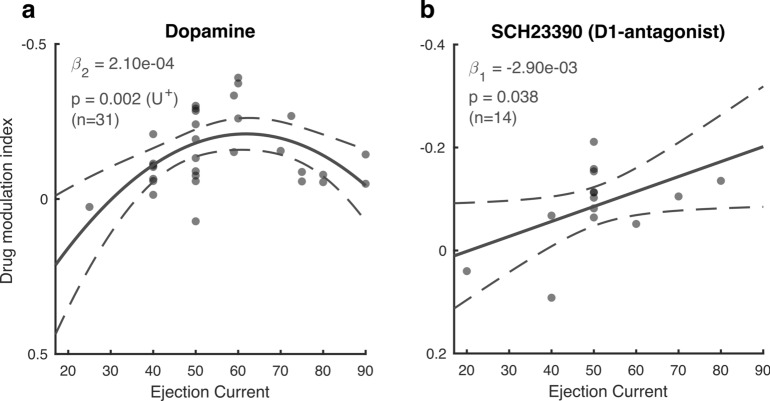
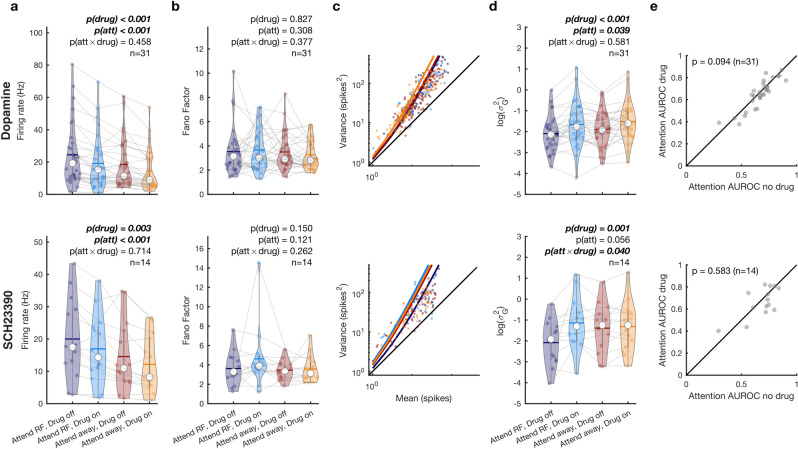
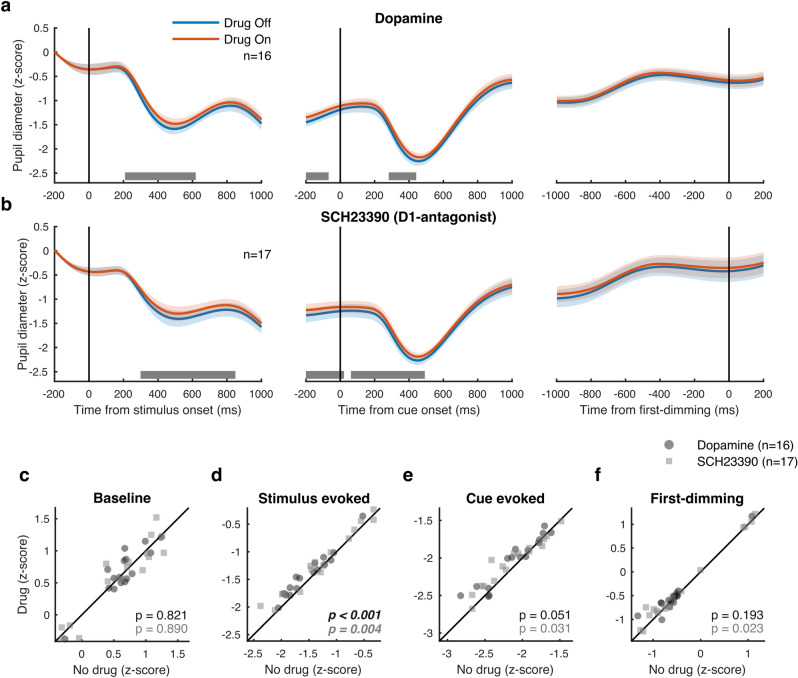
Cognitive neuroscience has made great strides in understanding the neural substrates of attention, but our understanding of its neuropharmacology remains incomplete. Although dopamine has historically been studied in relation to frontal functioning, emerging evidence suggests important dopaminergic influences in parietal cortex. We recorded single- and multi-unit activity whilst iontophoretically administering dopaminergic agonists and antagonists while rhesus macaques performed a spatial attention task. Out of 88 units, 50 revealed activity modulation by drug administration. Dopamine inhibited firing rates according to an inverted-U shaped dose-response curve and increased gain variability. D1 receptor antagonists diminished firing rates according to a monotonic function and interacted with attention modulating gain variability. Finally, both drugs decreased the pupil light reflex. These data show that dopamine shapes neuronal responses and modulates aspects of attentional processing in parietal cortex.


Conflict of interest statement

The authors declare no competing interests.

Figures

Figure 1
Figure 1
Paradigm and behavioral performance. (a) Behavioral paradigm. The monkey held a lever and fixated on a central fixation spot to initiate the trial. One of three colored gratings was presented inside the receptive field (RF) of the neurons under study. After a variable delay a cue matching one of the grating colors surrounded the fixation spot, indicating which grating was behaviorally relevant (target). In pseudorandom order the stimuli decreased in luminance (dimmed). Upon dimming of the target, the monkey had to release the lever to obtain a reward. (b, c) Average RT on attend RF and attend away trials for the non-specific agonist dopamine (b) and the D1R antagonist SCH23390 (c). Individual markers represent the average RT during a single recording session. Error bars denote the interquartile range. Horizontal bars denote the mean. Statistics: linear mixed-effects model analysis.
Figure 2
Figure 2
Population activity, example unit, and saline control. (a) Population histograms for all units recorded during dopaminergic drug application selective for attention and drug application. Population activity aligned to stimulus onset (left), cue onset (middle) and the first dimming event (right), for the non-specific agonist dopamine (top) and the D1R antagonist SCH23390 (bottom). Activity is normalized for each unit by its maximum activity. Error bars denote ± 1 SEM. (b) Activity from a cell recorded during dopamine application. This cell’s activity, aligned to the first dimming event, was significantly modulated by attention, drug application and showed a significant interaction between these factors. The grey bar indicates the time window used for statistical analyses. Statistics: two-factor ANOVA. (c) Activity from a representative cell recorded during application of saline (with pH matched to the dopaminergic drugs) whilst the monkey performed a memory-guided saccade task. The four panels correspond to the four quadrants in which the visual stimulus was presented. This cell’s activity, aligned to saccade onset, was significantly modulated by the spatial location of the stimulus/saccade but not by iontophoretic saline application. Statistics: two-factor ANOVA. (d) Average firing rates between control and saline conditions. Each marker indicates the average activity of one unit across the four conditions (blue markers) or the average activity of one unit for one of the four conditions (red markers). Statistics: two-sided Wilcoxon signed rank test.
Figure 3
Figure 3
Dose–response curves. (a, b) Drug modulation index plotted against ejection current for the non-specific agonist dopamine (a) and the D1R antagonist SCH23390 (b). Note the reversed y-axis. Solid and dotted lines represent significant model fits (applied to all cells simultaneously) and their 95% confidence intervals, respectively. A monotonic relationship is shown if a first-order fit was better than a constant fit, and a non-monotonic relationship is shown if a second-order fit was better than a linear fit. U+ indicates a significant U-shaped relationship. Only cells that revealed a main or interaction effect for the factors drug and attention were included in this analysis. Statistics: linear mixed-effects model analysis.
Figure 4
Figure 4
Dopaminergic modulation of firing rates and rate variability. (a) Average firing rates between attention and drug conditions for the non-specific agonist dopamine (top) and the D1R antagonist SCH22390 (bottom) (b) Fano factors between attention and drug conditions for the non-specific agonist dopamine (top) and the D1R antagonist SCH22390 (bottom). (c) Variance-to-mean relationship across attention and drug conditions for the non-specific agonist dopamine (top) and the D1R antagonist SCH22390 (bottom). Individual dots depict the variance and mean across trials for a single condition. Solid lines show the predicted mean-to-variance relationship given the average fitted dispersion parameter (σG2). (d) Gain variability (σG2) for each unit between attention and drug conditions for the non-specific agonist dopamine (top) and the D1R antagonist SCH22390 (bottom). (e) Area under the receiver operating characteristic (AUROC) curve between no drug and drug conditions for the non-specific agonist dopamine (top) and the D1R antagonist SCH23390 (bottom). Only units that revealed a main or interaction effect for the factors drug and attention were included in this analysis. Individual markers represent the average firing rate, Fano Factor or gain variability for a single unit (a, b, d). The white marker denotes the median and the error bars the interquartile range. Horizontal bars denote the mean. Statistics: linear mixed-effect models (a, b, d) and two-sided Wilcoxon signed rank test (e).
Figure 5
Figure 5
Modulation of pupil diameter by dopamine in parietal cortex. (a) Pupil diameter during sessions where dopamine was administered aligned to stimulus onset (left), cue onset (middle) and the first dimming event (right). The grey bar indicates the times where drug application brought about a significant difference in pupil diameter. (b) As (a) but for sessions where D1R antagonist SCH23390 was applied. (c–f) Average pupil diameter during pre-stimulus baseline period (c), after stimulus onset (d), after cue onset (e), and before the first dimming event (f). Shaded regions denote ± 1 SEM. Statistics: Wilcoxon signed rank test (FDR corrected). Statistics deemed significant after multiple comparison correction are displayed in italic and boldface fonts.

References

    1. Corbetta M, Shulman GL. Spatial neglect and attention networks. Annu. Rev. Neurosci. 2011;34:569–599. doi: 10.1146/annurev-neuro-061010-113731. - DOI - PMC - PubMed
    1. Desimone R, Duncan J. Neural mechanisms of selective visual attention. Annu. Rev. Neurosci. 1995;18:193–222. doi: 10.1146/annurev.ne.18.030195.001205. - DOI - PubMed
    1. Posner M. The attention system of the human brain. Annu. Rev. Neurosci. 1990;13:25–42. doi: 10.1146/annurev.ne.13.030190.000325. - DOI - PubMed
    1. Herrero JL, Gieselmann MA, Sanayei M, Thiele A. Attention-induced variance and noise correlation reduction in macaque v1 is mediated by NMDA receptors. Neuron. 2013;78:729–739. doi: 10.1016/j.neuron.2013.03.029. - DOI - PMC - PubMed
    1. Dasilva M, Brandt C, Alwin Gieselmann M, Distler C, Thiele A. Contribution of ionotropic glutamatergic receptors to excitability and attentional signals in macaque frontal eye field. Cereb. Cortex. 2021 doi: 10.1093/cercor/bhab007. - DOI - PMC - PubMed

Publication types