. 2022 Apr 28;12(1):6926.
doi: 10.1038/s41598-022-10352-3.

Temporal and sex-dependent gene expression patterns in a renal ischemia-reperfusion injury and recovery pig model

Affiliations

Temporal and sex-dependent gene expression patterns in a renal ischemia-reperfusion injury and recovery pig model

Stéphane Nemours et al. Sci Rep. .

Erratum in

Abstract

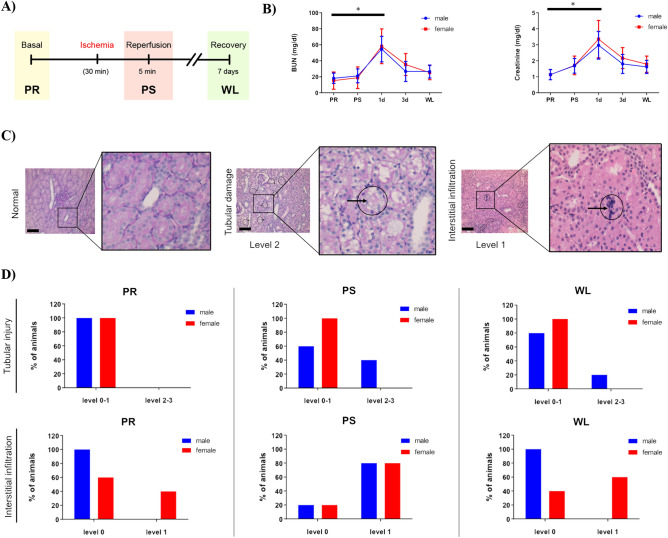
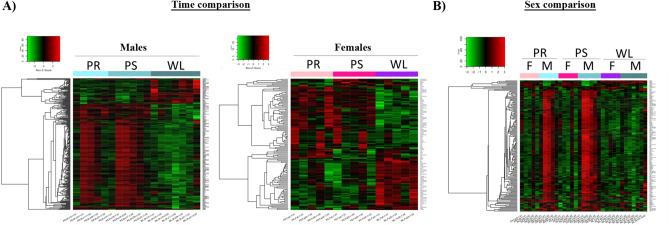
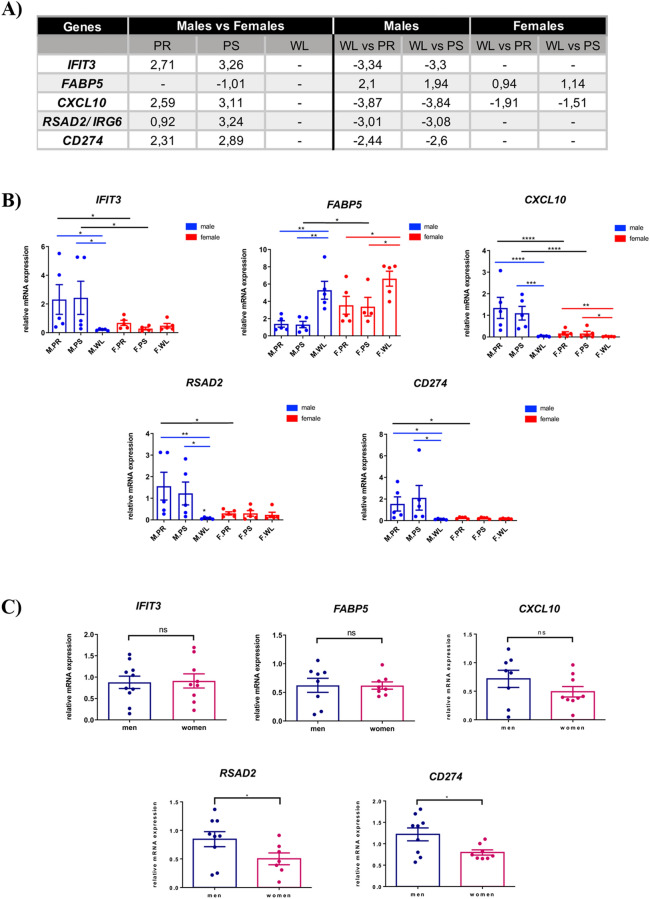
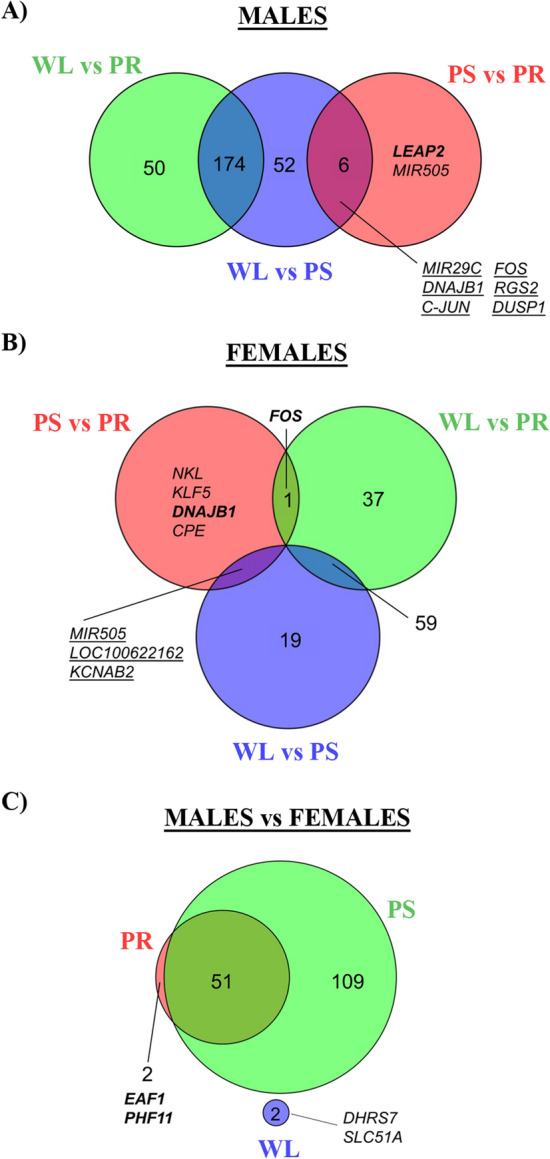
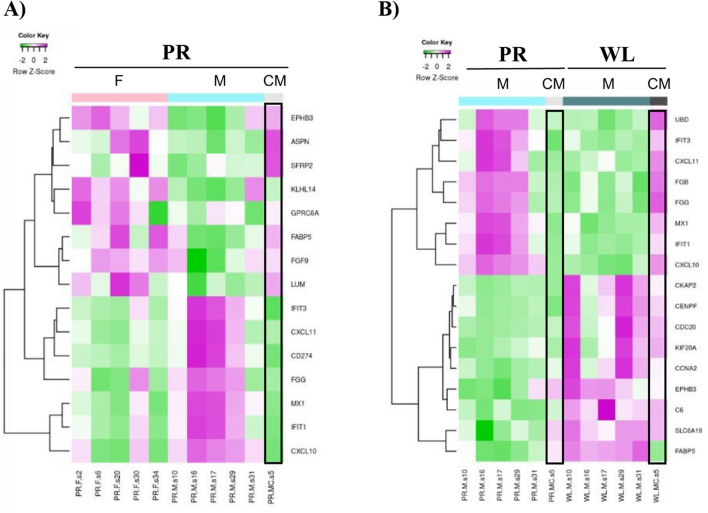
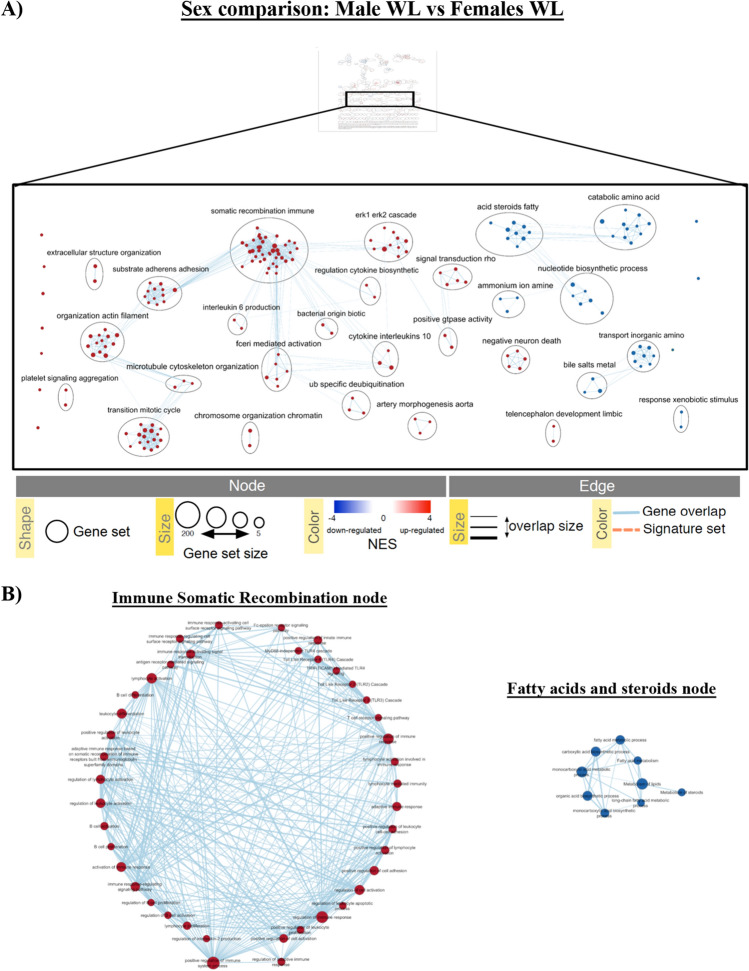
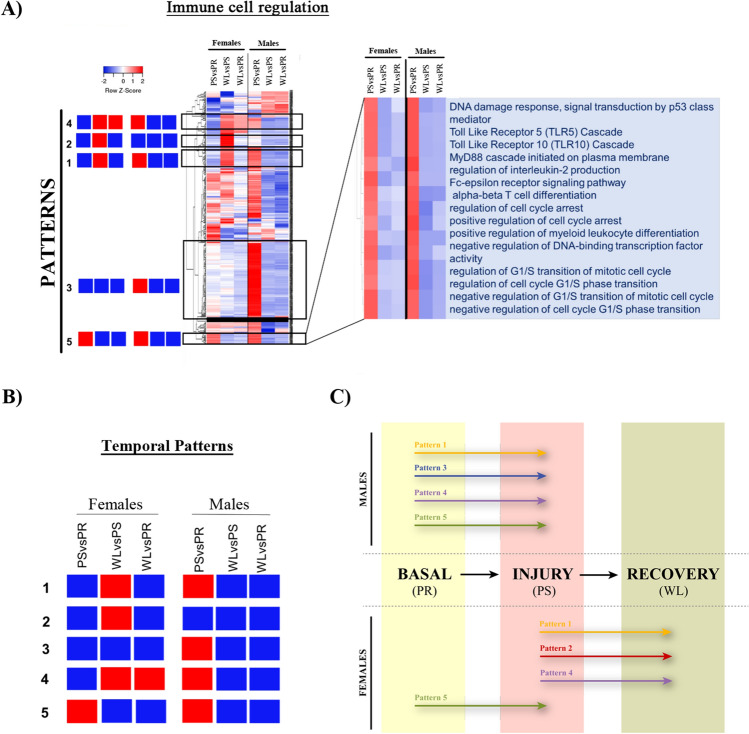
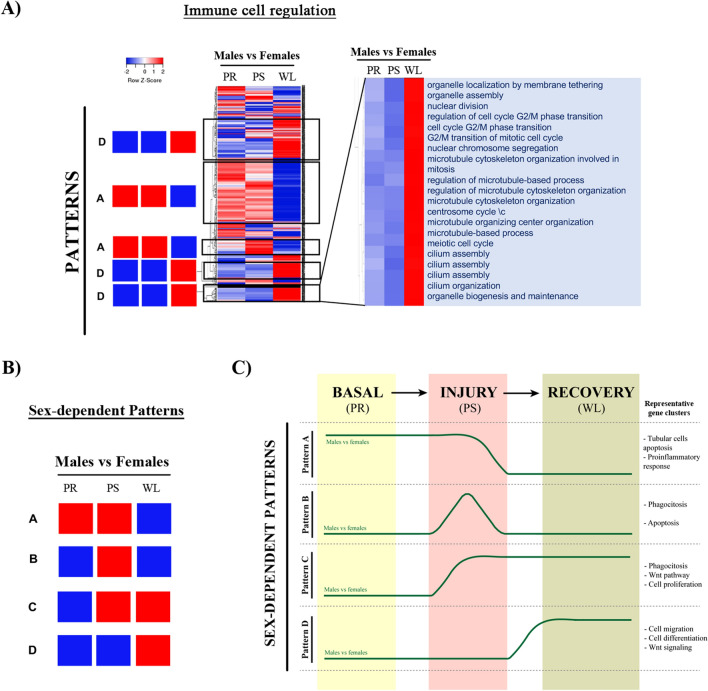
Men are more prone to acute kidney injury (AKI) and chronic kidney disease (CKD), progressing to end-stage renal disease (ESRD) than women. Severity and capacity to regenerate after AKI are important determinants of CKD progression, and of patient morbidity and mortality in the hospital setting. To determine sex differences during injury and recovery we have generated a female and male renal ischemia/reperfusion injury (IRI) pig model, which represents a major cause of AKI. Although no differences were found in blood urea nitrogen (BUN) and serum creatinine (SCr) levels between both sexes, females exhibited higher mononuclear infiltrates at basal and recovery, while males showed more tubular damage at injury. Global transcriptomic analyses of kidney biopsies from our IRI pig model revealed a sexual dimorphism in the temporal regulation of genes and pathways relevant for kidney injury and repair, which was also detected in human samples. Enrichment analysis of gene sets revealed five temporal and four sexual patterns governing renal IRI and recovery. Overall, this study constitutes an extensive characterization of the time and sex differences occurring during renal IRI and recovery at gene expression level and offers a template of translational value for further study of sexual dimorphism in kidney diseases.


Conflict of interest statement

The authors declare no competing interests.

Figures

Figure 1
Figure 1
Assessment of biochemical parameters and histological examination following porcine renal ischemia/reperfusion injury. (A) Experimental design of renal unilateral IRI following contralateral nephrectomy. Ischemia was induced for 30 min. Data were collected before injury, 5 min and 7 days following renal clamping. (B) Measurement of blood urea nitrogen (BUN) and serum creatinine (SCr) levels in males (blue) and females (red). The “y” axis represents blood urea nitrogen and serum creatinine concentration, respectively, and the “x” axis represents the time points. Average values ± SEM are plotted in the graph (N = 5). (C) Representative images of different levels of tubular injury and interstitial infiltration in pig kidney. Arrows indicate specifically damaged cells. Magnification = 20X, scale bar = 100 µm. (D) Quantification of tubular injury (upper panel) and interstitial infiltration (lower panel) scored by an expert pathologist was classified by group and sex (males in blue, females in red). The y-axis represents the % of animals showing each level of injury or infiltration, respectively. BUN blood urea nitrogen, PR pre-ischemia, PS post-ischemia, WL one week later. *p < 0.05.
Figure 2
Figure 2
Hierarchical clustering of microarray assays based of kidney porcine throughout renal IRI in a time and sex manner. Gene expression for males and females were compared at different time points (PR, PS, and WL). (A) Heatmaps graphically illustrating the differences in the gene expression levels for the time comparison in males (left) and females (right). Similar pattern of expression was observed for both sexes. (B) Heatmap representing the difference in expression by comparing males and females at the same time point (sex comparison). The green color represents genes with lower expression and the red color represent the ones with higher expression. Genes represented in the heatmaps have an adj.p value ≤ 0.25 and |log FC| ≥ 1. F female, M male, PR pre-ischemia, PS post-ischemia, WL one week later.
Figure 3
Figure 3
Validation of porcine renal IRI microarray assays by qRT-PCR experiments followed by evaluation of mRNA levels of selected targets in human ischemic kidney biopsies. (A) Expression values of five selected targets from microarray assays displaying time and sex differences. (B) Relative mRNA levels of FABP5, IFIT3, RSAD2, CXCL10, CD274 were measured and compared by qRT-PCR. For the time comparison, the different time points (PR, PS, WL) were compared with each other for each sex (blue male, red female). For the sex comparison, a selected time point in male was compared to the equivalent time point in female. Blue and red lines represent a time comparison in male or female, respectively. Black lines represent sex comparison at equivalent time points. (C) RSAD2, CXCL10, CD274, FABP5 and IFIT3 expression levels were evaluated by qPCR in post-surgery (PS) conditions from samples of 36–80 and 53–83 years old men and women, respectively (N > 7). *p value ≤ 0.05; **p value ≤ 0.01; ***p value ≤ 0.001; ****p value ≤ 0.0001, ns: not significant. F female, M male, PR pre-ischemia, PS post-ischemia, WL one week later.
Figure 4
Figure 4
Venn diagrams of time and sex comparisons between males and females throughout renal IRI. Venn diagrams depicting the number of commonly regulated genes (A) in male and (B) in females at different time point comparisons: PS versus PR, WL versus PS and WL versus PR. Males showed an overall higher number of regulated genes. (C) Venn diagrams depicting the number of commonly regulated genes in the sex comparison at different time points: PR, PS and WL. Only two genes were commonly regulated one week following injury. Genes represented only in italic are down-regulated, whereas genes in bold and italic are up-regulated. Genes underlined are both up- and down-regulated in respective comparisons. Complete gene tables are available in supplemental material. adj. p value ≤ 0.25 and log |FC | ≥ 1. F female, M male, PR pre-ischemia, PS post-ischemia, WL one week later.
Figure 5
Figure 5
IPA heatmap gene expression representation of top regulated genes. Microarray data files of pig experiments were uploaded in IPA software. Results were reported in hierarchical clustering of top up and down regulated genes in (A) a sex- (MPR vs. FPR) and (B) time- (MPR vs. MWL) comparisons. Data from a castrated male was compared with male and female pig expression patterns. The castrated male showed a gene expression pattern similar to females. F female, M male, CM castrated male, PR pre-ischemia, WL one week later.
Figure 6
Figure 6
Enrichment map example of over-represented genes in individual sex comparisons M.WL versus F.WL following GSEA analyses. (A) Representation of different clusters (nodes) regulated in the comparison. The map allows visualization of clusters containing nodes in which red and blue represent up- or down-regulated gene sets for each node, respectively. The clusters take their name from the most common containing names of the nodes within the cluster. (B) Example of the different gene sets that form somatic recombination immune and acid steroids fatty nodes, where red and blue nodes represent up- or down-regulated gene sets, respectively (FDR: 0.01–0.1).
Figure 7
Figure 7
Patterns of gene sets regulation in male and female kidneys throughout renal IRI in the time comparison. An example of the gene sets of selected clusters represented by hierarchical clustering. (A) Heatmap (of time comparisons) was created with the normalized enrichment score (NES) values of the gene sets calculated by GSEA analysis. The red and blue colors refer to gene sets that are over- or under-represented in the heat-maps. (B) Five prominent patterns for time comparison were determined. (C) A summary of these five temporal patterns is depicted in a diagram, where patterns displayed in each sex are illustrated by a colored arrow positioned at the time point where they are up-regulated (PR, PS, WL). PR pre-ischemia, PS post-ischemia, WL one week later.
Figure 8
Figure 8
Patterns of gene sets regulation in male and female kidneys throughout renal IRI in the sex comparison. Gene sets of selected clusters were represented by hierarchical clustering. (A) Heatmaps (of sex comparisons) were created with the normalized enrichment score (NES) values of the gene sets calculated by GSEA analysis. The red and blue colors refer to gene sets that are over- or under-represented in the heat-maps. (B) Four prominent patterns for sex comparison were determined. (C) A summary of these four temporal patterns is depicted in a diagram. PR pre-ischemia, PS post-ischemia, WL one week later.

References

    1. Bellomo R, Kellum JA, Ronco C. Acute kidney injury. Lancet. 2012;380(9843):756–766. doi: 10.1016/S0140-6736(11)61454-2. - DOI - PubMed
    1. Lameire N, Van Biesen W, Vanholder R. The changing epidemiology of acute renal failure. Nat. Clin. Pract. Nephrol. 2006;2(7):364–377. doi: 10.1038/ncpneph0218. - DOI - PubMed
    1. Bonventre JV, Yang L. Cellular pathophysiology of ischemic acute kidney injury. J. Clin. Investig. 2011;121(11):4210–4221. doi: 10.1172/JCI45161. - DOI - PMC - PubMed
    1. Chawla LS, Eggers PW, Star RA, Kimmel PL. Acute kidney injury and chronic kidney disease as interconnected syndromes. N. Engl. J. Med. 2014;371(1):58–66. doi: 10.1056/NEJMra1214243. - DOI - PMC - PubMed
    1. Coca SG, Singanamala S, Parikh CR. Chronic kidney disease after acute kidney injury: A systematic review and meta-analysis. Kidney Int. 2012;81(5):442–448. doi: 10.1038/ki.2011.379. - DOI - PMC - PubMed

Publication types