. 2022 May;23(5):692-704.
doi: 10.1038/s41590-022-01185-3. Epub 2022 Apr 28.

Mitochondrial electron transport chain is necessary for NLRP3 inflammasome activation

Affiliations

Mitochondrial electron transport chain is necessary for NLRP3 inflammasome activation

Leah K Billingham et al. Nat Immunol. 2022 May.

Abstract

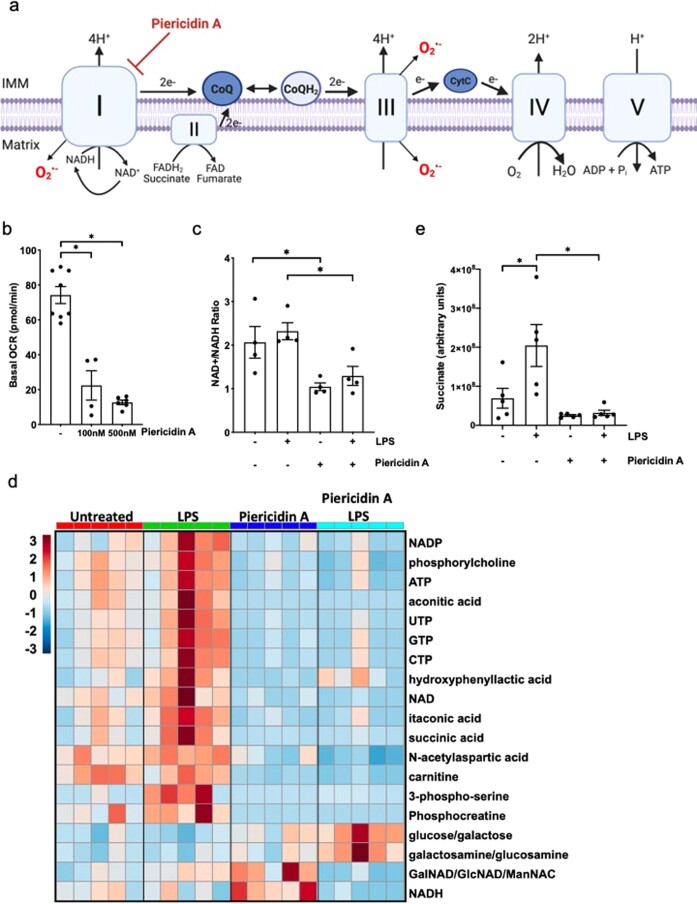
The NLRP3 inflammasome is linked to sterile and pathogen-dependent inflammation, and its dysregulation underlies many chronic diseases. Mitochondria have been implicated as regulators of the NLRP3 inflammasome through several mechanisms including generation of mitochondrial reactive oxygen species (ROS). Here, we report that mitochondrial electron transport chain (ETC) complex I, II, III and V inhibitors all prevent NLRP3 inflammasome activation. Ectopic expression of Saccharomyces cerevisiae NADH dehydrogenase (NDI1) or Ciona intestinalis alternative oxidase, which can complement the functional loss of mitochondrial complex I or III, respectively, without generation of ROS, rescued NLRP3 inflammasome activation in the absence of endogenous mitochondrial complex I or complex III function. Metabolomics revealed phosphocreatine (PCr), which can sustain ATP levels, as a common metabolite that is diminished by mitochondrial ETC inhibitors. PCr depletion decreased ATP levels and NLRP3 inflammasome activation. Thus, the mitochondrial ETC sustains NLRP3 inflammasome activation through PCr-dependent generation of ATP, but via a ROS-independent mechanism.


Conflict of interest statement

The authors declare no competing interests.

Figures

Fig. 1
Fig. 1. NDI1 expression confers resistance to mitochondrial complex I inhibitor piericidin A.
a, Schematic of the mitochondrial electron transport chain in WT (top) and NDI1-expressing (bottom) BMDMs during LPS stimulation. Piericidin A inhibition of mitochondrial complex I on electron flow is rescued by NDI1 expression. IMM, inner mitochondrial membrane; RET, reverse electron transport. b, NDI1 mRNA levels (ΔΔCt) in WT and NDI1 BMDMs (n = 5 WT; n = 12 NDI1). c, Coupled OCR in WT and NDI1 BMDMs (n = 9 for each genotype). d, Basal OCR in WT and NDI1 BMDMs after 1 h treatment with 100 nM or 500 nM piericidin A (n = 13 vehicle for each genotype; n = 9 100 nM piericidin A for each genotype; n = 4 500 nM piericidin A for each genotype). e, NAD+/NADH ratio in WT and NDI1 BMDMs after 4 h treatment with or without LPS (100 ng ml–1) in the presence or absence of piericidin A (500 nM) (n = 3 WT LPS + piercidin A; n = 4 all other treatments). f, Rate of H2O2 production in WT and NDI1 BMDMs in the presence of succinate (500 μM) with or without piericidin A treatment (500 nM) (n = 9). g, Heatmap of significantly altered metabolites in WT and NDI1 BMDMs treated with LPS (100 ng ml–1) alone, piericidin A alone (500 nM) or both LPS and piericidin A for 4 h. The relative abundance of each metabolite is depicted as z score across rows (red, high; blue, low) (n = 5 for all treatments). h, Arbitrary units of succinate in WT and NDI1 BMDMs with or without LPS (100 ng ml–1) and piericidin A (500 nM) for 4 h (n = 5 for all treatments). Data are mean ± s.e.m. *P < 0.05, two-tailed t-test (b, P = 0.0001), ANOVA with Tukey’s post hoc test for multiple comparisons (d, *P = 0.0008 WT UT/100 nM, *P = 0.0047 WT UT/500 nM; e, *P = 0.006 WT UT/WT piericidin A, *P = 0.0034 WT LPS/WT LPS + piericidin A; f, *P = 0.0465 WT succinate/WT succinate + piericidin A, *P = 0.0493 NDI1 succinate/NDI1 succinate + piericidin A; h, *P = 0.0478), or ANOVA with Fisher’s LSD (g). n indicates number of individual mice. Parts of this figure were created with BioRender.com. Source data
Fig. 2
Fig. 2. Reverse electron transport is not required for NLRP3 inflammasome activation.
a, IL-1β protein levels in the serum of WT and NDI1 mice 2 h post i.p. injection of 100 mg kg–1 crude LPS (n = 6 WT; n = 5 NDI1; symbols indicate independent experiments). b, IL-1β protein levels in cell culture supernatant of WT and NDI1 BMDMs treated with LPS (100 ng ml–1) and ATP (5 mM) with or without piericidin A (100 nM) (n = 7 WT; n = 11 NDI1). c, IL-1β protein levels in cell culture supernatant of WT and NDI1 BMDMs treated with LPS (100 ng ml–1) and ATP (5 mM), with or without piericidin A (100 nM) and/or DMM (10 mM) (n = 10 LPS + DMM + piericidin A for each genotype; n = 11 LPS for each genotype; n = 7 LPS + piericidin A for each genotype; n = 5 LPS + DMM for each genotype). d, Intracellular Caspase-1 (p20 fragment) protein expression in cell lysates from WT and NDI1 BMDMs treated as in c (n = 4 WT; n = 7 NDI1). e, Pro-IL-1β protein expression in cell lysates from WT and NDI1 BMDMs treated with LPS (100 ng ml–1) with or without piericidin A (100 nM) (n = 3 WT; n = 5 NDI1). f, Pro-Caspase-1 protein expression in cell lysates from WT and NDI1 BMDMs treated with LPS (100 ng ml–1) and ATP (5 mM) with or without piericidin A (100 nM) (n = 4 WT; n = 7 NDI1). g, NLRP3 protein expression in cell lysates from WT and NDI1 BMDMs treated with LPS (100 ng ml–1) (n = 4 WT all treatments, NDI1 UT; n = 6 NDI1 + LPS, NDI1 + LPS + piericidin A). h, ASC protein expression in cell lysates from WT and NDI1 BMDMs treated as in e (n = 4 WT all treatments, NDI1 UT; n = 6 NDI1 + LPS, NDI1 + LPS + piericidin A). Data are means ± s.e.m. *P < 0.05, ANOVA with Tukey’s post hoc test for multiple comparisons (b, *P < 0.0001; c, *P = 0.0038 WT LPS + ATP/ WT LPS + ATP + Piericidin A, *P = 0.0083 WT LPS + ATP/WT LPS + ATP + DMM, *P < 0.0001 WT LPS + ATP/WT LPS + ATP + DMM + Piericidin A, *P = 0.0037 NDI1 LPS + ATP/NDI1 LPS + ATP + DMM, *P = 0.0003 NDI1 LPS + ATP/NDI1 LPS + ATP + DMM + Piericidin A; d, *P = 0.0129). ND, not detected. Source data
Fig. 3
Fig. 3. Mitochondrial-generated H2O2 production is not required for NLRP3 inflammasome activation.
a, Schematic of the mitochondrial ETC in WT (top) and QPC-KO/AOX BMDMs (bottom). In WT BMDMs, myxothiazol inhibition of complex III blocks onward electron flow to oxygen. In QPC-KO/AOX BMDMs, AOX accepts electrons from reduced CoQ, maintaining electron flow but without generating O2. Mitochondrial complex I pumps proton to generate a proton motive force to sustain ATP levels in QPC-KO/AOX. b, OCR in WT, QPC-KO and QPC-KO/AOX BMDMs with or without 100 nM myxothiazol (n = 4 for each genotype). c, Coupled OCR in WT and QPC-KO/AOX BMDMs after 1 h treatment with 100 nM myxothiazol (n = 4 for each genotype). d, Rate of H2O2 production in WT, QPC-KO and QPC-KO/AOX BMDMs in the presence of 500μM succinate (n = 6 for each genotype). e, IL-1β protein levels in cell culture supernatant of WT, QPC-KO and QPC-KO/AOX BMDMs treated with LPS (100 ng ml–1) and ATP (5 mM), with or without myxothiazol (100 nM) (N = 8 WT both treatments; n = 9 QPC-KO both treatments; n = 10 QPC-KO/AOX both treatments). f, Pro-caspase-1 protein expression in cell lysates from WT and QPC-KO/AOX BMDMs treated with LPS (100 ng ml–1) and ATP (5 mM), with or without myxothiazol (100 nM) (n = 6 WT UT, WT LPS + ATP, WT LPS + myxothiazol + ATP, QPC-KO/AOX UT, QPC-KO/AOX LPS + ATP, QPC-KO/AOX + myxothiazol + ATP; n = 3 WT LPS, WT LPS + myxothiazol, QPC-KO/AOX LPS, QPC-KO/AOX LPS + myxothiazol). g, Intracellular caspase-1 (p20 fragment) protein expression in cell lysates from WT and QPC-KO/AOX BMDMs treated with as in f (n = 5 for each treatment and genotype). h, IL-1β protein levels in the serum of WT and QPC-KO/AOX mice 2 h post i.p. injection of 50 mg kg–1 crude LPS (n = 12 WT; n = 13 QPC-KO/AOX; symbols indicate distinct independent experiments). Data are means ± s.e.m. *P < 0.05, one-way ANOVA with Tukey’s post hoc test for multiple comparisons (b, *P = 0.0077 WT UT/WT Myxothiazol, *P = 0.0231 WT UT/QPC-KO UT, P = 0.0023 WT UT/QPC-KO Myxothiazol; c, *P = 0.042, d, *P = 0.0027 WT/QPC-KO, *P = 0.0124 WT/QPC-KO/AOX; e, *P = 0.0022 WT LPS + ATP/WT LPS + ATP + Myxothiazol, *P = 0.0108 WT LPS + ATP/QPC-KO LPS + ATP, *P = 0.0017 WT LPS + ATP + Myxothiazol/QPC-KO LPS + ATP + Myxothiazol; f, *P = 0.0063 WT LPS + ATP/WT LPS + Myxothiazol+ATP). Parts of this figure were created with BioRender.com. Source data
Fig. 4
Fig. 4. Mitochondrial-generated PCr during priming supports NLRP3 inflammasome activation.
a, PCr levels (a.u.) in cells treated with or without cyclocreatine (10 mM), with or without LPS for 4 h (n = 5 for each treatment). b, Intracellular ATP levels (a.u.) in cells treated for 4 h with piericidin A (100 nM) or cyclocreatine (10μM), with or without LPS (100 ng ml–1) or nigericin (20 μM) (n = 19 LPS alone; n = 12 LPS + nigericin; n = 8 piericidin A, piericidin A + LPS, piericidin A + LPS + nigericin; n = 17 cyclocreatine; n = 13 cyclocreatine + LPS, cyclocreatine + LPS + nigericin). c, IL-1β protein levels in cell culture supernatant of BMDMs treated LPS (100 ng ml–1) and nigericin (20 μM) with or without cyclocreatine (10 μM) (n = 6 for all treatments). d, IL-1β protein levels in cell culture supernatant of BMDMs treated LPS (100 ng ml–1) and ATP (5 mM) with or without cyclocreatine (10 μM) (n = 6 for all treatments). e, Intracellular pro-caspase-1 protein expression in cell lysates from WT BMDMs treated with LPS (100 ng ml–1) and ATP (5 mM) with or without cyclocreatine (10 μM) (n = 5 for all treatments). f, Intracellular caspase-1 (p20 fragment) protein expression in cell lysates from WT BMDMs treated as in e (n = 4 WT; n = 7 NDI1). g, Intracellular pro-caspase-1 protein expression in cell lysates from BMDMs transfected with vehicle control or siRNA against Ckb treated or not with LPS (100 ng ml–1) and ATP (5 mM) (n = 5 independent experiments). h, Intracellular caspase-1 (p20 fragment) protein expression in cell lysates from BMDMs transfected with vehicle control or siRNA against Ckb treated or not with LPS (100 ng ml–1) and ATP (5 mM) (n = 5 independent experiments). i, IL-1β protein levels in the serum of mice administered cyclocreatine before i.p. administration of 50 mg kg–1 crude LPS. Serum samples were collected 2 h post LPS injection (n = 13 H2O + PBS; n = 11 cyclocreatine + cyclocreatine; symbols indicate independent experiments). Data are means ± s.e.m. *P < 0.05, one-way ANOVA with Tukey test for multiple comparisons (a, *P = 0.0037 UT/cyCr, *P = <0.0001 UT/LPS + Cycr; b, *P < 0.0001 LPS/LPS + Nigericin, *P = 0.0404 LPS + Nigericin/LPS + Piericidin+Nigericin, *P = 0.0313 LPS + Nigericin/LPS + CyCr+Nigericin; f, *P = 0.0007; h, *P = 0.0086), two-tailed t-test (c, *P = 0.0008; d, *P = 0.0008; i, *P = 0.0153), one-sample t-test (b, *P = 0.0097 UT/Piericidin A, *P < 0.0001 UT/cyCr). Source data
Fig. 5
Fig. 5. Nigericin decreases OCR in an active caspase-1-dependent manner.
a, Percentage LDH release from BMDMs treated with LPS (100 ng ml–1) and Nigericin (20 μM), with or without VX-765 (20 μg ml–1) (n = 10 UT, LPS, LPS + 60 min nigericin; n = 8 LPS + 10 min nigericin, LPS + 20 min nigericin, LPS + 30 min + nigericin; n = 6 LPS + 5 min nigericin, LPS + 60 min nigericin + VX-765; n = 4 LPS + 120 min nigericin, LPS + 120 min nigericin + VX-765). b, OCR of BMDMs treated for 6 h with LPS in the presence or absence of VX-765 (20 µg ml–1). Nigericin was added (final concentration 20 μM) at indicated time (n = 2; error bars s.d. of four technical replicates). c, ECAR of BMDMs treated as in b (n = 2; error bars represent s.d. of four technical replicates). d, OCR of BMDMs treated for 6 h with LPS (100 ng ml–1), with or without VX-765 (20 µg ml–1). Nigericin (final concentration 20 μM), Oligomycin (final concentration 2 μM), and 2DG (final concentration 50 mM) were added at indicated timepoints (n = 2, representative of eight mice in four independent experiments). e, ECAR of BMDMs treated as in d (n = 2, representative of eight mice in four independent experiments). f, OCR of BMDMs treated for 6 h with LPS (100 ng ml–1) and VX-765 (20 μg ml–1) with or without piericidin A (500 nM) (n = 2, representative of eight mice in four independent experiments). g, ECAR of BMDMs treated as in f (n = 2, representative of eight mice in four independent experiments). Data are means ± s.e.m. (a) or s.d. (bg). *P < 0.0001, one-way ANOVA with Turkey’s post hoc test for multiple comparisons.
Fig. 6
Fig. 6. Mitochondrial complex I inhibition is necessary for CL097 activation of NLRP3 inflammasome.
a, Percent LDH release from BMDMs treated with LPS (100 ng ml–1) and CL097 (70 μM), with or without VX-765 (20 μg ml–1); n = 4. b, OCR of BMDMs treated with LPS (100 ng ml–1), with or without VX-765 (20 μg ml–1). Data is shown as a percent of the basal OCR of untreated. CL097 (70 μM), Oligomycin (2 μM) and 2-deoxy-d-glucose (2DG) (50 mM) were added at indicated timepoints; n = 4. c,d, OCR of WT and NDI1 BMDMs treated with LPS (100 ng ml–1). Data are shown as a percentage of the basal OCR of untreated. Piericidin A (500 nM) (c) or CL097 (70 μM) (d), Oligomycin (2 μM) and 2DG (50 mM) were added as indicated; n = 3 for each genotype. e, IL-1β protein levels in cell culture supernatant of WT or NDI1 BMDMs treated LPS (100 ng ml–1) and CL097 (70 μM); n = 6. f, Intracellular caspase-1 (p20 fragment) protein expression in cell lysates from WT and NDI1 BMDMs treated as in Fig. e (70 μM); n = 6. g, Intracellular pro-caspase-1 expression in cell lysates treated as in e; n = 6. h, IL-1β protein levels in cell culture supernatant of WT BMDMs treated with LPS (100 ng ml–1) and CL097 (70 μM), piericidin A (100 nM), myxothiazol (100 nM), antimycin A (100 nM) or oligomycin (50 nM); n = 4. i, IL-1β protein levels in cell culture supernatant of BMDMs treated with LPS (100 ng ml–1) and CL097 (70 μM), with or without piericidin A (500 nM); n = 4. j, Intracellular pro-caspase-1 protein expression in cell lysates from BMDMs treated as in i; n = 4. k, Intracellular caspase-1 protein expression in cell lysates from BMDMs treated as in i; n = 4. l, IL-1β protein levels in cell culture supernatant of BMDMs treated with LPS (100 ng ml–1) and CL097 (70 μM), with or without CyCr (10 μM) (n = 4). m, Intracellular caspase-1 protein expression in cell lysates treated as in l; n = 4. n, Intracellular pro-caspase-1 protein expression in cell lysates from BMDMs treated as in l; n = 4. Data are means ± s.e.m. *P < 0.05, two-tailed t-test (i, *P = 0.007; l, *P = 0.0127) one-way ANOVA with Tukey’s post hoc test for multiple comparisons (a, *P = 0.0399 UT/LPS + 20 min; *P < 0.0001 UT/LPS + 30 min, UT/LPS + 60 min, LPS + 30 min/LPS + 30 min+VX-765, LPS + 60 min/LPS + 60 min + VX-765; *P = 0.0013 (e); *P < 0.0001 (f); *P = 0.0273 (j); *P < 0.0001 (m)). Source data
Fig. 7
Fig. 7. Mitochondrial ROS is not necessary for CLO97-dependent NLRP3 inflammasome activation.
a, Intracellular pro-caspase-1 expression in cell lysates from WT and NDI1 BMDMs treated with LPS (100 ng; ml–1) and CL097 (70 μM); N = 4 for all treatments. b, Intracellular caspase-1 (p20 fragment) protein expression in WT and NDI1 BMDMs treated as in a (n = 4 NDI1 all treatments, WT UT, WT LPS, WT LPS + CL097 + antimycin A; n = 3 WT LPS + CL097). c, IL-1β protein levels in cell culture supernatant of WT and NDI1 BMDMs treated with LPS (100 ng ml–1) and CL097 (70 μM). Antimycin (Anti; 100 nM), myxothiazol (Myxo; 100 nM), FCCP (10 μM) or oligomycin (Oligo; 50 nM) were added 30 min before inflammasome activation (n = 5 for all treatments). d, IL-1β protein levels in cell culture supernatant of BMDMs treated with LPS (100 ng ml–1) and ATP (5 mM). MitoTempo (500 μM) was added 30 min before ATP (n = 6 for each condition). e, IL-1β protein levels in cell culture supernatant of BMDMs treated with LPS (100 ng ml–1) and CL097 (70 μM). MitoTempo (500 μM) was added 30 min before the addition of CL097 (n = 6 for each condition). f, IL-1β protein levels in cell culture supernatant of BMDMs treated with LPS (100 ng ml–1) and ATP (5 mM). S1QEL (S1; 1 μM) or S3QEL (S3; 10 μM) was added 30 min before ATP (n = 6 for each condition). g, IL-1β protein levels in cell culture supernatant of BMDMs treated with LPS (100 ng ml–1) and CL097 (70 μM). S1QEL (S1;1 μM) or S3QEL (S3; 10 μM) was added 30 min before CL097 (n = 6 for each condition). h, IL-1β protein levels in cell culture supernatant of BMDMs treated with LPS (100 ng ml–1) and CL097 (70 μM). Paraquat (25 μM) was added 30 min before CL097 (n = 5 WT all treatments; n = 3 NDI1 all treatments). i, Schematic of K+ efflux-dependent (left) and independent (right) NLRP3 inflammasome activation. Error bars represent means ± s.e.m. *P < 0.05, one-way ANOVA with Tukey’s post hoc test for multiple comparisons (b, *P = 0.0454 WT LPS + CL097/NDI1 LPS + CL097, *P = 0.0229 NDI1 LPS + CL097/NDI1 LPS + CL097 + Antimycin A; c, *P < 0.0001 WT LPS + CL097/NDI1 LPS + CL097, *P = 0.0434 NDI1 LPS/CL097/NDI1 LPS + CL097 + Anti, *P = 0.0373 NDI1 LPS + CL097/NDI1 LPS + CL097 + Myxo, *P = 0.0053 NDI1 LPS + CL097/NDI1 LPS + CL097 + FCCP). Parts of this figure were created with BioRender.com. Source data
Extended Data Fig. 1
Extended Data Fig. 1. Dimethyl malonate (DMM) inhibits mitochondrial complex II.
a) Timeline of treatment of BMDMs with metabolic inhibitors, LPS, and inflammasome activators. b) Schematic of the mitochondrial ETC, indicating forward and reverse (RET) electron transport. Dimethyl malonate (DMM) inhibits mitochondrial complex II, preventing succinate oxidation and linked electron transport in either direction. c) OCR in BMDMs after 3 hours treatment with or without 10 mM DMM (Untreated: N = 11; 10 mM DMM: N = 6). d) Heatmap of significantly altered metabolites in BMDMs treated with DMM (10 mM) with or without LPS (100 ng/mL) for 4 hours. The relative abundance of each metabolite is depicted as z score across rows (red, high; blue, low). (N = 5, each treatment). e) Succinate concentration (AU, arbitrary units) in WT BMDMs with or without treatment with LPS (100 ng/mL) and DMM (10 mM) for 4 h (N = 5, each treatment). f) NAD+/NADH ratio in BMDMs after 4 hours treatment with or without LPS (100 ng/mL), with or without DMM (10 mM) (N = 4, each treatment). Data are means + /− SEM. * p < 0.05, two-tailed t-test (c *p < 0.0001), one-way ANOVA with Tukey test for multiple comparisons (e *p = 0.0057 UT/DMM, *p = 0.0205 LPS/LPS + DMM), or one-way analysis of variance (ANOVA) with Fisher’s LSD (d). N indicates number of individual mice. Parts of this figure were created with BioRender.com. Source data
Extended Data Fig. 2
Extended Data Fig. 2. Dimethyl malonate (DMM) decreases NLRP3 inflammasome activation.
a) Il1b mRNA expression (ΔΔCt) in BMDMs treated with LPS (100 ng/mL) for 4 hours, with or without DMM (10 mM) (N = 5 UT, LPS; N = 6 LPS + DMM). b) Tnf mRNA expression (ΔΔCt) in BMDMs treated as in a (N = 5 for all treatments). c) Il10 mRNA expression (ΔΔCt) in BMDMs treated as in a (N = 5 for all treatments). d) Pro-IL-1β protein levels in cell lysates of BMDMs treated with LPS (100 ng/mL), with or without DMM (10 mM). (N = 4 for all treatments). e) IL-1β protein levels in cell culture supernatant from BMDMs treated with LPS (100 ng/mL) and ATP (5 mM), with or without DMM (10 mM). (N = 5 for all treatments). f) TNFα protein levels in cell culture supernatant from BMDMs treated as in e. (N = 3 for all treatments). g) Intracellular pro-caspase-1 protein expression in cell lysates from BMDMs treated with or without LPS (100 ng/mL) and ATP (5 mM), with or without DMM (10 mM). (N = 3 for all treatments). h) Intracellular caspase-1 (p20 fragment) protein expression in cell lysates from BMDMs treated with or without LPS (100 ng/mL) and ATP (5 mM), with or without DMM (10 mM) (N = 3 for all treatments). Data are means + /− SEM. * p < 0.05, two-tailed t-test (e *p = 0.0001), one-way analysis of variance (ANOVA) with a Tukey test for multiple comparisons (h *p < 0.0001). Source data
Extended Data Fig. 3
Extended Data Fig. 3. Piericidin A inhibits mitochondrial complex I.
a) Schematic of the mitochondrial ETC, indicating forward and reverse (RET) electron transport. Piericidin A inhibits mitochondrial complex I, preventing proton pumping, superoxide production, and both forward and reverse electron transport. b) OCR in BMDMs after 1-hour treatment with or without 100 nM or 500 nM piericidin A (N = 8 basal; N = 4 100 nM; N = 6 500 nM). c) NAD+/NADH ratio in BMDMs after 4-hour treatment with or without LPS (100 ng/mL), with or without piericidin A (500 nM) (N = 4 for each condition). d) Heatmap of significantly altered metabolites in BMDMs treated with piericidin A (500 nM) with or without LPS (100 ng/mL) for 4 hours. The relative abundance of each metabolite is depicted as z score across rows (red, high; blue, low). (N = 5 for each condition). e) Succinate concentration (AU, arbitrary units) in WT BMDMs with or without treatment with LPS (100 ng/mL), with or without piericidin A (500 nM) for 4 hours (N = 5, for each condition). Data are means + /− SEM. * p < 0.05, one-way ANOVA with Tukey test for multiple comparisons (b *p < 0.0001; c *p = 0.0442 UT/Piericidin A, *p = 0.0426 LPS/LPS + Piericidin A; e *p = 0.0258 UT/LPS, *p = 0.0043 LPS/LPS + Piericidin), or one-way ANOVA with Fisher’s LSD (d). Parts of this figure were created with BioRender.com. Source data
Extended Data Fig. 4
Extended Data Fig. 4. Piericidin A decreases NLRP3 inflammasome activation.
a) Il1b mRNA expression (ΔΔCt) in BMDMs treated with or without LPS (100 ng/mL) for 4 hours, with or without piericidin A (100 nM, 500 nM) (N = 6 for each condition). b) Tnf expression (ΔΔCt) in BMDMs treated as in a (N = 5 for all conditions). c) Il10 mRNA expression (ΔΔCt) in BMDMs treated as in a (N = 5 for all conditions). d) Pro-IL-1β protein expression in cell lysates from BMDMs treated with or without LPS (100 ng/mL), with or without piericidin A (100 nM). (N = 7 LPS; N = 6 UT, LPS + piericidin A; N = 4 LPS + ATP, LPS + piericidin A + ATP). e) Intracellular pro-caspase-1 protein expression in cell lysates from BMDMs treated with or without LPS (100 ng/mL) and ATP (5 mM), with or without piericidin A (100 nM). (N = 8 LPS; N = 7 UT, LPS + piericidin A; N = 6 LPS + ATP, LPS + piericidin A). f) IL-1β protein levels in cell culture supernatant treated with or without LPS (100 ng/mL) and ATP (5 mM), with or without piericidin A (100 nM, 500 nM). (N = 4 for each condition). g) Intracellular caspase-1 (p20 fragment) protein expression in cell lysates from BMDMs treated with or without LPS (100 ng/mL) and ATP (5 mM), with or without piericidin A (100 nM). (N = 6 LPS, LPS + ATP, LPS + piericidin A + ATP; N = 5 UT, LPS + piericidin A.). h) IL-1β protein levels in cell culture supernatant from BMDMs treated with or without LPS (100 ng/mL) and Nigericin (20μM), with or without piericidin A (100 nM, 500 nM). Subsequently, (N = 7 for each condition). i) TNFα protein levels in cell culture supernatant from BMDMs treated as in H. (N = 9 for all conditions). Data are means + /− SEM. * p < 0.05, one-way ANOVA with Tukey test for multiple comparisons (f *p < 0.0001; g *p = 0.0027; h *p < 0.0001). Source data
Extended Data Fig. 5
Extended Data Fig. 5. Piericidin A inhibits mitochondrial complex I to modulate LPS-dependent mRNA expression.
a) Principal component analysis of RNASeq data on WT and NDI1 BMDMs treated, or not, with LPS (100 ng/mL) for 4 hours. Each dot represents RNASeq data from a single sample. (N = 5 for each treatment). b) Principal component analysis of RNASeq data on WT and NDI1 BMDMs treated with LPS (100 ng/mL) for 4 hours, with or without piericidin A (500 nM). Each dot represents RNASeq from a single sample. (N = 5 for each treatment).
Extended Data Fig. 6
Extended Data Fig. 6. Mitochondrial complex III inhibitor myxothiazol decreases NLRP3 inflammasome activation.
a) OCR in BMDMs with or without 1-hour treatment with 100 nM myxothiazol (N = 6 for each treatment). b) Il1b mRNA expression (ΔΔCt) in BMDMs treated with or without LPS (100 ng/mL), with or without myxothiazol (100 nM) (N = 7 for each treatment). c) Tnf mRNA expression (ΔΔCt) in BMDMs treated as in a (N = 7 for each treatment). d) Il10 mRNA expression (ΔΔCt) in BMDMs treated as in a (N = 6 UT, LPS; N = 5 LPS + myxothiazol). e) Pro-IL-1β protein expression in cell lysates from WT and NDI1 BMDMs treated with LPS (100 ng/mL) and with or without myxothiazol (100 nM) (N = 6 for all treatments). f) IL-1β protein levels in cell culture supernatant from BMDMs treated with LPS (100 ng/mL) for 5.5 hours, with or without myxothiazol (100 nM and ATP (5 mM). (N = 5 for each condition). g) IL-1β protein levels in cell culture supernatant from WT and NDI1 BMDMs treated LPS (100 ng/mL) and ATP (5 mM), with or without myxothiazol (100 nM). (N = 13 both genotypes LPS; N = 10 both genotypes LPS + ATP, LPS + ATP + piericidin A; N = 6 for both genotypes LPS + ATP + myxothiazol + piericidin A). h) Intracellular Pro-caspase-1 protein expression in cell lysates from WT and NDI1 BMDMs treated with LPS (100 ng/mL), with or without myxothiazol (100 nM) and ATP (5 mM)(N = 4 for each treatment and genotype). i) Intracellular caspase-1 (p20 fragment) protein expression in cell lysates from WT and NDI1 BMDMs treated as in h (N = 6 for each condition). Data are means + /− SEM. * p < 0.05, two-tailed t-test (a *p < 0.0001; f *p = 0.0033), or one-way ANOVA with Tukey test for multiple comparisons (g *p < 0.0001; i *p = 0.0025). Source data
Extended Data Fig. 7
Extended Data Fig. 7. Oligomycin or FCCP cause an increase or decrease in mitochondrial membrane potential, respectively.
a) Schematic of mitochondrial membrane potential (Ψψm) at baseline (top), during in the presence of oligomycin (middle), and in the presence of FCCP (bottom). At baseline, mitochondrial complexes I, III and IV pump protons across the inner mitochondrial membrane to generate and maintain a high membrane potential. Mitochondrial complex V uses this proton motive force to generate ATP from ADP and Pi. Oligomycin inhibits mitochondrial complex V, preventing the passage of protons through complex V into the mitochondrial matrix. This causes an increase in the membrane potential as protons build up in the intermembrane space. FCCP is a protonophore and allows for the free passage of protons across the inner mitochondrial membrane. This decreases the membrane potential, preventing ATP generation. b) Relative MFI (geometric mean of TMRE stain, relative to UT control) of BMDMs treated with LPS (100 ng/mL), or not, with FCCP (10μM), piericidin A (Pier) (100 nM), Oligomycin (50 nM), or Myxothiazol (100 nM) (N = 5 Myxo, FCCP + LPS, Myxo + LPS; N = 7 FCCP, Pier, Pier + LPS; N = 9 Oligo, Oligo + LPS, UT). c) Example gating strategy for b with representative histograms of untreated, FCCP treated, and oligomycin treated BMDMs. Cell counts are standardized to mode. Data are means + /− SEM. * p < 0.05, one-sample t-test (b *p < 0.0001 UT/FCCP, p = 0.0116 UT/Oligo). Parts of this figure were created with BioRender.com.
Extended Data Fig. 8
Extended Data Fig. 8. Oligomycin and FCCP decrease NLRP3 inflammasome activation.
a) OCR in BMDMs from WT mice after one-hour treatment with or without oligomycin (50 nM) (N = 4, each treatment). b) Il1b mRNA expression (ΔΔCt) in BMDMs treated with or without LPS (100 ng/mL) for 4 hours with or without oligomycin (50 nM) (N = 5 for each treatment). c) Pro-IL-1β protein expression in cell lysates from BMDMs treated with LPS (100 ng/mL) for 5.5 hours, with or without oligomycin (50 nM). (N = 8 for each treatment). d) IL-1β protein levels in cell culture supernatant of BMDMs treated with LPS (100 ng/mL) and ATP (5 mM), with or without oligomycin (50 nM). (N = 6 for each condition). e) Intracellular caspase-1 protein expression in cell lysates from from BMDMs treated with LPS (100 ng/mL) and ATP (5 mM), with or without oligomycin (50 nM). (N = 6 for each condition). f) Intracellular pro-caspase-1 protein expression in cell lysates from BMDMs treated as in e. (N = 6 for each condition). g) Il1b mRNA expression (ΔΔCt) in BMDMs treated with or without LPS (100 ng/mL) for 4 hours with or without FCCP (10μM) (N = 5 for each condition). h) Pro-IL-1β protein expression in cell lysates from BMDMs treated with LPS (100 ng/mL) for 5.5 hours, with or without FCCP (10μM). (N = 5 for each treatment). i) IL-1β protein levels in cell culture supernatant of BMDMs treated with LPS (100 ng/mL) and ATP (5 mM), with or without FCCP (10μM). (N = 6 for both treatments). j) Intracellular caspase-1 (p20 fragment) protein expression in cell lysates from BMDMs treated with LPS (100 ng/mL) and ATP (5 mM), with or without FCCP (10μM). (N = 6 for all treatments). Data are means + /− SEM. *p < 0.05, two-tailed t-test (a *p = 0.0328; d *p < 0.0001; i *p = 0.0077), one-way ANOVA with Tukey test for multiple comparisons (e *p = 0.0026; j *p = 0.0041). Source data
Extended Data Fig. 9
Extended Data Fig. 9. Mitochondrial ETC inhibitors decrease phosphocreatine levels.
a) Heatmap of top 16 altered metabolites in BMDMs treated with LPS (100 ng/mL) for 4 hours with or without myxothiazol (100 nM) or oligomycin (50 nM). The relative abundance of each metabolite is depicted as z score across rows (red, high; blue, low). (N = 5 UT, LPS, Myxothiazol, Myxothiazol + LPS; N = 4 Oligomycin, Oligomycin + LPS). b) Heatmap of top 50 altered metabolites in BMDMs treated with LPS (100 ng/mL) with or without FCCP (10μM) for 4 hours. The relative abundance of each metabolite is depicted as z score across rows (red, high; blue, low). (N = 5 or all treatments). Source data
Extended Data Fig. 10
Extended Data Fig. 10. Creatine kinase (CKB) RNAi decreases secretion of IL-1β protein levels in response to LPS plus ATP.
a) Schematic of the phosphocreatine shuttle. A phosphate group from mitochondria-generated ATP is transferred to creatine (Cr) by CKMT2, generating phosphocreatine (PCr) and ADP. PCr is able to cross the mitochondrial membrane to the cytoplasm. Creatine kinase (CKB) transfers its phosphate group to ADP to generate ATP to meet cellular energetic demands. In this way the generation of PCr provides an energy buffer to quickly generate ATP. Cyclocreatine (cyCr) disrupts this buffer. CyCr is phosphorylated by CKB to produce phosphocyclocreatine, a poor donor of phosphate to ADP for generation of ATP. b) Ckb mRNA expression (ΔΔCt) in BMDMs transected with scramble siRNA control (sc) or siRNA against Ckb (N = 3, N are biological replicates from 3 independent experiments). c) IL-1β protein concentration in cell culture supernatant of BMDMs transfected with vector control or siRNA against Ckb treated with LPS (100 ng/mL) and ATP (5 mM). Each panel represents an independent experiment with N = 4 technical replicates. Data are means + /− SEM. * p < 0.05, one-way ANOVA with Tukey test for multiple comparisons (b *p = 0.0041 sc/1, *p = 0.0051 sc/2, *p = 0.0274 sc/3; c mouse 1: *p = 0.0001 sc+LPS/1+LPS, *p = 0.001 sc+LPS/2+LPS, *p < 0.0001 sc+LPS/3+LPS; mouse 2: *p = 0.0002 sc+LPS/2+LPS, *p = 0.0001 sc+LPS/3+LPS; mouse 3: *p = 0.0062 sc+LPS/1+LPS, *p = 0.0003 sc+LPS/2+LPS, *p = 0.0011 sc+LPS/3+LPS). Parts of this figure were created with BioRender.com.

Comment in

References

    1. Rathinam VAK, Fitzgerald KA. Inflammasome complexes: emerging mechanisms and effector functions. Cell. 2016;165:792–800. doi: 10.1016/j.cell.2016.03.046. - DOI - PMC - PubMed
    1. Muñoz-Planillo R, et al. K+ efflux is the common trigger of NLRP3 inflammasome activation by bacterial toxins and particulate matter. Immunity. 2013;38:1142–1153. doi: 10.1016/j.immuni.2013.05.016. - DOI - PMC - PubMed
    1. Groß CJ, et al. K+ efflux-independent NLRP3 inflammasome activation by small molecules targeting mitochondria. Immunity. 2016;45:761–773. doi: 10.1016/j.immuni.2016.08.010. - DOI - PubMed
    1. Agostini L, et al. NALP3 forms an IL-1beta-processing inflammasome with increased activity in Muckle-Wells autoinflammatory disorder. Immunity. 2004;20:319–325. doi: 10.1016/S1074-7613(04)00046-9. - DOI - PubMed
    1. Sandall CF, Ziehr BK, MacDonald JA. ATP-binding and hydrolysis in inflammasome activation. Molecules. 2020;25:E4572. doi: 10.3390/molecules25194572. - DOI - PMC - PubMed

Publication types

MeSH terms

Substances