. 2022 Apr;3(4):471-485.
doi: 10.1038/s43018-022-00355-4. Epub 2022 Apr 28.

MYCN mediates cysteine addiction and sensitizes neuroblastoma to ferroptosis

Affiliations

MYCN mediates cysteine addiction and sensitizes neuroblastoma to ferroptosis

Hamed Alborzinia et al. Nat Cancer. 2022 Apr.

Abstract

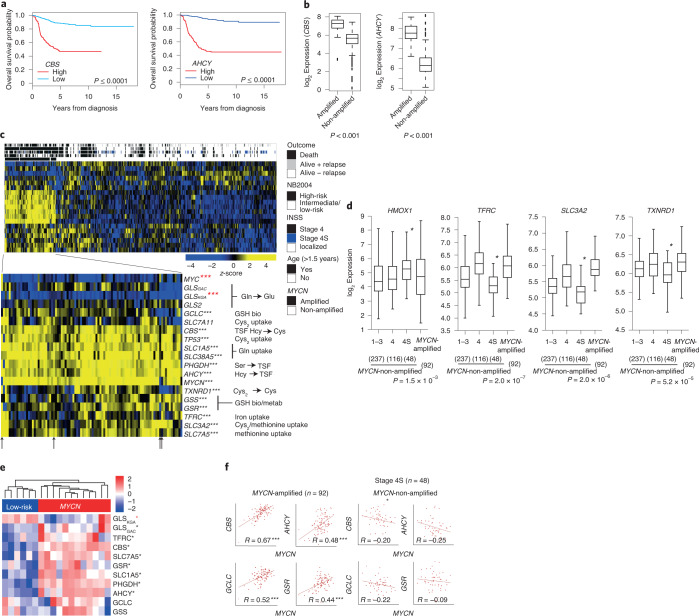
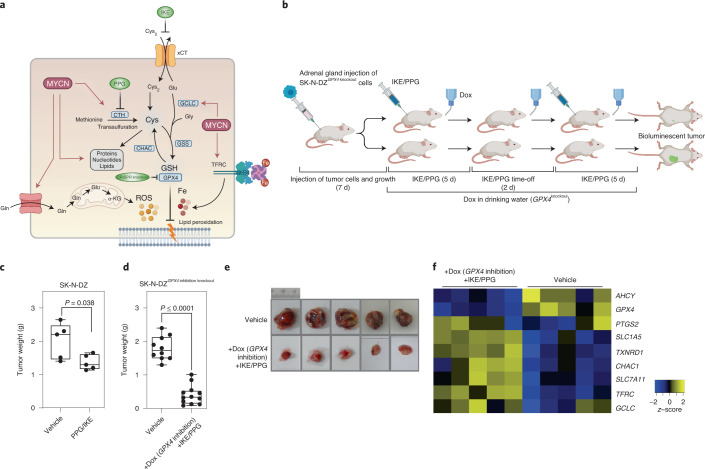
Aberrant expression of MYC transcription factor family members predicts poor clinical outcome in many human cancers. Oncogenic MYC profoundly alters metabolism and mediates an antioxidant response to maintain redox balance. Here we show that MYCN induces massive lipid peroxidation on depletion of cysteine, the rate-limiting amino acid for glutathione (GSH) biosynthesis, and sensitizes cells to ferroptosis, an oxidative, non-apoptotic and iron-dependent type of cell death. The high cysteine demand of MYCN-amplified childhood neuroblastoma is met by uptake and transsulfuration. When uptake is limited, cysteine usage for protein synthesis is maintained at the expense of GSH triggering ferroptosis and potentially contributing to spontaneous tumor regression in low-risk neuroblastomas. Pharmacological inhibition of both cystine uptake and transsulfuration combined with GPX4 inactivation resulted in tumor remission in an orthotopic MYCN-amplified neuroblastoma model. These findings provide a proof of concept of combining multiple ferroptosis targets as a promising therapeutic strategy for aggressive MYCN-amplified tumors.


Conflict of interest statement

The authors declare no competing interests.

Figures

Fig. 1
Fig. 1. Cystine addiction in MYCN-expressing neuroblastoma cells.
a, Representative western blot of IMR5/75 neuroblastoma cells on MYCN knockdown using Dox (expression: −Dox, high; +Dox, low); the experiment was replicated three times. b, Intracellular amino acid quantification after MYCN inhibition for 96 h (+Dox, n = 5 samples and −Dox, n = 6 samples, or 10058-F4, inhibiting MYCN–MAX binding, n = 4 samples and dimethyl sulfoxide (DMSO)-treated, n = 5 samples). Data represent the mean ± s.e.m. The experiment was replicated three times. c, Standardized viability of IMR5/75 after single amino acid depletions (48 h). Data represent the mean ± s.e.m.; n = 3 samples. The experiment was replicated three times. d,e, Cellular responses to Cys2 deprivation in high MYCN (−Dox) and low MYCN (+Dox) state in IMR5/75 (d) and Tet21N (e) cells; the mean viability of cells was standardized to untreated (full medium) and representative western blot of neuroblastoma Tet21N cells. Data represent the mean ± s.e.m.; n = 3 samples. The experiment was replicated three times. Images of the cells are shown on the left. Scale bar, 50 μm. f, Sensitivity to Cys2 deprivation versus level of MYC(N) activity in a panel of neuroblastoma cell lines. g, Relative viability (survival of compound-treated cells divided by survival of vehicle-treated cells) of IMR5/75 cells after Cys2 deprivation for 72 h in the presence or absence of Fer-1. Data represent the mean ± s.e.m.; n = 3 samples. The experiment was replicated three times. Images of the cells are shown on the left. Scale bar, 50 μm. h, Analysis of lipid peroxidation in Cys2-deprived high or low MYCN IMR5/75 cells (n = 3 samples; the experiment was replicated 3 times). i, Analysis of lipid peroxidation in Cys2-deprived high or low MYCN IMR5/75 cells in the presence or absence of Trolox, CPX, Lip-1, GSH or Fer-1. The experiment was replicated three times. j, Relative viability of SK-N-DZ, IMR5/75, SK-N-FI and normal human dermal fibroblasts (NHDFs) after Cys2 deprivation in the presence or absence of GSH and Fer-1. n = 4 samples. The experiment was replicated three times. k, Quantification of total intracellular GSH (n = 8 samples) levels and the reduced GSH/GSH disulfide (GSSG) ratio in IMR5/75 cells (n = 3 samples). Analysis of intracellular ROS levels using CellROX staining and flow cytometry in IMR5/75 cells in high MYCN (−Dox) and low MYCN (+Dox) state (n = 3 samples). Data represent the mean ± s.e.m. The experiment was replicated three times. Statistical analysis was performed using a two-tailed Student’s t-test. Source data
Fig. 2
Fig. 2. Gln is required for ferroptosis in high MYCN cells.
ac, Cysteine (a), total GSH levels (b) and cell viability (c) on Cys2 and Gln deprivation. Data represent the mean ± s.e.m.; n = 3 samples. The experiment was replicated three times. d, RNA-seq of IMR5/75 cells on treatment with the conditions indicated in the figure. n = 3 samples. e, siRNA-mediated GLSKGA/GAC knockdown (72 h) on Cys2 deprivation (24 h) in IMR5/75 cells. Representative western blots of each isoform. Data represent the mean ± s.e.m.; n = 4 samples. The experiment was replicated three times. f, Expression of glutaminolysis genes (mitochondrial GLSGAC; cytosolic GLSKGA and GLS2) compared with MYCN-regulated genes (CBS, AHCY, GSR) in high MYCN and low MYCN IMR5/75 cells. TPM, transcripts per million. Data represent the mean ± s.e.m. The statistical analysis was performed using a two-tailed Student’s t-test. Source data
Fig. 3
Fig. 3. Inhibition of GPX4 is synthetic lethal with high MYCN.
a, MYCN synthetic lethal druggable genome-wide siRNA screening approach in IMR5/75 cells. b, Effects of individual siRNAs (gray dots): high MYCN versus low MYCN, including key players (median of two or three siRNAs) of the top MYCN synthetic lethal hits (single star symbol) of GSH metabolism (black) and biosynthesis (green). c, MYCN effects on lipid peroxide formation and intracellular amino acid levels (fold changes shown in red), the xc system (Cys2 uptake), the two-step biosynthesis of GSH and GSH metabolism; the single star symbol marks the top MYCN synthetic lethal hits of GSH metabolism, with an FDR of 0.2. The action of ferroptosis inhibitors (CPX, Fer-1, Lip-1, Trolox and 10058-F4), class I (erastin, IKE, sulfasalazine), class II ferroptosis inducers (RSL3, ML-210) and the GSH biosynthesis inhibitor buthionine sulfoximine as indicated. d, siRNA GPX4 knockdown in the presence or absence of Fer-1. Data represent the mean ± s.e.m.; n = 4 samples. The experiment was replicated three times. e, Relative viability (survival of compound-treated cells divided by survival of vehicle-treated cells) of the KELLY cell line after cotreatment with iron sucrose (25 µg ml−1) and RSL3. Data represent the mean ± s.e.m.; n = 3 samples. The experiment was replicated three times. f, Relative viability of IMR5/75 cells treated with RSL3 in the presence or absence of Fer-1 or GSH. n = 4 samples. The experiment was replicated three times. g, DRIVE database (RSA values, Pearson’s correlation, P = 0.01; filled circle, MYCN-amplified; white circle, MYCN-non-amplified). h, Cellular responses of neuroblastoma cell lines to 72 h of RSL3 treatment: cells with MYCN amplification (black symbols), moderate MYCN expression (white circle) and lack thereof (white triangle). Data represent the mean ± s.e.m.; n = 3 samples. The experiment was replicated three times. i, Dox-inducible GPX4 CRISPR–Cas9 knockout in a 3D model with MYCN-amplified SK-N-DZ cells in the presence or absence of MYCN–MAX inhibition. Data represent the mean ± s.e.m. Right: representative western blot; n = 4 samples. The experiment was replicated three times. j, Orthotopic mouse neuroblastoma model allowing CRISPR–Cas9-mediated GPX4 deletion. Panel created with BioRender. k, Tumor weight after GPX4 knockout (+Dox) (n = 5 mice per group). A representative western blot for CRISPR–Cas9-mediated GPX4 deletion is shown. l, Elevated messenger RNA expression of the ferroptosis markers CHAC1 and TFRC. Data represent the mean ± s.e.m.; n = 4 samples from each group. Statistical analysis was performed using a one-tailed Student’s t-test for the in vivo experiments and a two-tailed Student’s t-test for the in vitro experiments. Box plots: the center line indicates the median value, the lower and upper hinges represent either the 25th and 75th percentiles or the minimum and maximum points and the whiskers denote 1.5× the interquartile range (IQR). Each dot corresponds to one sample; one-sided Student’s t-test; P values as indicated. Source data
Fig. 4
Fig. 4. Inhibition of cystine uptake by SLC7A11 induces ferroptosis in high MYCN cells.
a, SLC7A11 knockdown effect in the IMR5/75 cell line. b, Correlation between MYC(N) activity and sensitivity to SLC7A11 repression (DRIVE). c, Relative viability (survival of compound-treated cells divided by survival of vehicle-treated cells) of both high and low MYCN IMR5/75 cells after treatment with sulfasalazine. d,e, Treatment with erastin for 72 h with MYCN knockdown (d) and MYC/MAX inhibitor (e). Data represent the mean ± s.e.m.; n = 3 samples. The experiment was replicated three times. f,g, Cellular responses of neuroblastoma cell lines to 72 h of erastin treatment. Data represent the mean ± s.e.m.; n = 3 samples. The experiment was replicated three times) (f) and confirmed by the CTRPv2 (ref. ) data (g). AUC, area under the curve. h, Cysteine and GSH levels and reduced GSH/GSSG ratio in IMR5/75 cells treated with erastin. Data represent the mean ± s.e.m.; n = 3 samples. The experiment was replicated three times. i, Relative viability of IMR5/75 cells treated with erastin in the presence or absence of Fer-1 or GSH (72 h). Data represent the mean ± s.e.m.; n = 4 samples. The experiment was replicated three times. Box plots: the center line indicates the median value, the lower and upper hinges represent the 25th and 75th percentiles, respectively and the whiskers denote 1.5× the IQR. Each dot corresponds to one sample; Wilcoxon rank-sum test, P values as indicated. Source data
Fig. 5
Fig. 5. MYCN activates transsulfuration genes controlling methionine-to-cysteine conversion in MYCN-amplified cells.
a, Illustration of Cys2 uptake/metabolism, glutaminolysis, methionine cycle and transsulfuration (#). The single star indicates the top hits from the MYCN siRNA screen; the red arrows indicate genes transcriptionally activated by MYCN in IMR5/75 (FDR = 0.001, using likelihood ratio testing); the blue arrows indicate genes transcriptionally activated by Cys2 deprivation in IMR5/75 cells. b,c, siRNA screen in the IMR5/75 cell line and MYCN synthetic lethality with knockdown of key transsulfuration genes (two individual siRNAs) and MYC(N) activity correlation with CTH (b) and AHCY (c). d, Relative viability of IMR5/75, Tet21N and GI-ME-N cells after Cys2 deprivation for 48 h in the presence or absence of Hcy or Cysta. Data represent the mean ± s.e.m.; n = 3 samples. The experiment was replicated three times. ectMYCN, ectopic MYCN. e, Relative viability (survival of compound-treated cells divided by survival of vehicle-treated cells) of IMR5/75, SK-N-DZ and MYCN-expressing mesenchymal Tet21N and MYC-expressing SK-N-AS cells after cotreatment with PPG and erastin or IKE. Data represent the mean ± s.e.m.; n = 3 samples. The experiment was replicated three times. f,g, Colony formation, GSH synthesis (f) and reduced GSH/GSSG ratio (g) in IMR5/75 and SH-EP cells on AHCY inhibition (by knockdown or using small molecule D9). Representative western blots are shown in the figure. Data represent the mean ± s.e.m.; n = 3 samples. The experiment was replicated three times. h, Relative viability of IMR5/75 cells after siRNA-mediated CARS knockdown (72 h) and Cys2 deprivation (24 h). Representative western blots are shown in the figure. Data represent the mean ± s.e.m.; n = 4 samples. The experiment was replicated three times. i, CBS expression in 32 neuroblastoma cell lines (RNA-seq) categorized using MYCN-amplified, MYCN/MYC-translocated/activated cell lines and MYC(N) non-expressors. MYCNt/MYCt, MYCN or MYC translocation; MYCact, activated MYC due to unknown mechanism. j,k, Bimodal CBS expression for MYCN/MYC-translocated/activated cell lines along with adrenergic and mesenchymal cell type mRNA expression (RNA-seq) and input-normalized read counts of histone modifications and MYCN (ChIP–seq) at the CBS locus in representative MYCN-amplified and MYCN-non-amplified cells (j) and tumors (k). Box plots: the center line indicates the median value, the lower and upper hinges represent the 25th and 75th percentiles, respectively and the whiskers denote 1.5× the IQR. Each dot corresponds to one sample; Wilcoxon rank-sum test; P values as indicated. Source data
Fig. 6
Fig. 6. Gene and protein markers indicating ferroptosis sensitivity in high- and low-risk neuroblastomas.
a, Kaplan–Meier overall survival estimates for subgroups defined by CBS expression, high CBS (n = 123) and low CBS (n = 375). Kaplan–Meier overall survival estimates for subgroups defined by AHCY expression. The cutoff values for the dichotomization of AHCY expression were estimated by maximally selected log-rank statistics, high AHCY expression (n = 165) and low AHCY expression (n = 333). b, CBS and AHCY expression in MYCN status-dependent expression in 498 primary neuroblastomas (92 MYCN-amplified, 406 MYCN non-amplified tumors, RNA-seq); Wilcoxon rank-sum test. c, Gene expression heatmap of subgroups hierarchically clustered with average linkage and non-centralized correlation distance function. Row: transcript; column: sample, according the NB2004 study. ***P < 0.001 (black) higher and ***P < 0.001 (red) lower gene expression. Wilcoxon rank-sum test; the arrows mark MYCN-non-amplified tumors. d, Differential expression of cysteine uptake and iron-regulating genes in primary neuroblastomas dependent on the stage of the disease and MYCN amplification status. Differential expression in stage 4S versus all other neuroblastoma subtypes tested by Wilcoxon rank-sum test. e, Differential expression of proteins mediating GSH synthesis/metabolism and GSH-relevant amino acid uptake/metabolism compared between MYCN-amplified and low-risk, normal MYCN tumors. *P ≤ 0.01; higher (black) and lower (red) protein expression. P values were calculated using a two-sided Welch’s t-test. Exact P values are given in the source data. Intensities are given as z-scores. See the legend for color-coding. f, Pearson’s correlation analysis of MYCN expression and GSH synthesis/metabolism and transsulfuration genes in MYCN-amplified (n = 92) and MYCN-non-amplified, low-risk stage 4S (n = 48) tumors. Box plots: the center line indicates the median value, the lower and upper hinges represent the 25th and 75th percentiles, respectively and the whiskers denote the 1.5× the IQR. Each dot corresponds to one sample; Wilcoxon rank-sum test; P values as indicated. Source data
Fig. 7
Fig. 7. Triple combination inhibiting GPX4, cystine uptake and transsulfuration eliminates MYCN-amplified tumors in vivo.
a, Regulation of pro- and anti-ferroptotic players by oncogenic MYCN in MYCN-amplified neuroblastoma cells that may trigger ferroptosis when both cysteine and GSH availability is limited. Therapeutic intervention points are indicated in green. b, Dosage scheme applied with either double (IKE/PPG) or triple combination (GPX4 knockout, IKE and PPG). c,d, Tumor weight after combination treatment with IKE and PPG (n = 5 mice per group; c) and the triple combination of GPX4 reduction plus IKE/PPG treatment (n = 9 in the control group and n = 12 mice in the treated group; d). e, Representative photographs of fully grown tumors in the vehicle group versus residual tumors after triple combination. f, Transcriptional changes of ferroptosis markers after GPX4 reduction plus IKE/PPG in residual tumor tissue (n = 5 tumor samples from each group). Statistical analysis was performed using a one-tailed Student’s t-test for the in vivo experiments. Box plots: the center line indicates the median value and the lower and upper hinges represent the minimum and maximum points. Each dot corresponds to one sample; P values as indicated. Panels a and b created with BioRender. Source data
Extended Data Fig. 1
Extended Data Fig. 1. Cell lines phenotypic data.
a, Doubling time calculation from exponential growth curve quantified by FACS and impedance measured using the RCTA xCELLigence system for high-MYCN (–Dox) and low-MYCN ( + Dox) IMR5/75 cells. Cell proliferation curves of exponentially growing cells (n = 3 samples, experiment replicated 3 times). b, Viability quantification using FACS and propidium iodide staining in exponentially growing cells: high MYCN (–Dox) vs. low MYCN ( + Dox) (n = 3 samples, experiment replicated 3 times). c, d, Fold changes of intracellular amino acid levels after MYCN inhibition (+Dox or 10058-F4, inhibiting MYCN/MAX binding, 96 h). e, MYC(N) RNA, protein expression (experiment replicated 3 times) and f, ‘MYC(N) activity’ score for a panel of adrenergic neuroblastoma cell lines. MYC(N) activity score of 32 neuroblastoma (NB) cell lines (CLs) having different MYC(N) genetic status (t = translocation; amp = amplification; act = activated due to unknown mechanism). g, Relative viability of IMR5/75 cells after Cys2 deprivation in the presence or absence of Inhibitors of apoptosis (z-VAD FMK, n = 5 samples), autophagy (Bafilomycin A1, Baf-A1, n = 4 samples,) and necroptosis (RIPK1 inhibitor, Necrostatin-1, Nec-1, n = 3 samples) and h, Trolox, or intracellular iron chelator ciclopirox olamine (CPX); n = 3 samples, experiment replicated 3 times. i, Relative viability of neuroblastoma cell lines after Cys2 deprivation in the presence or absence of ferrostatin-1 (Fer-1) or glutathione (GSH); n = 4 samples for SK-N-AS, NB69 and SH-SY5Y cell lines and n = 6 samples for GI-ME-N cell line; experiment replicated 3 times. j, Total GSH and k, cysteine (Cys) levels in neuroblastoma cells with amplified MYCN, MYC(N) translocations or normal MYC(N) status; Wilcoxon rank-sum test; center line indicates the median value, lower and upper hinges represent the 25th and 75th percentiles, respectively, and whiskers denote 1.5× interquartile range. Each dot corresponds to one sample; p-values as indicated. Source data
Extended Data Fig. 2
Extended Data Fig. 2. Additional screen targets and expression data.
a, MYCN synthetic lethal screen hits. MYCN effects on the two-step biosynthesis of GSH and GSH metabolism (top MYCN synthetic lethal hits of GSH metabolism, false discovery rate of 0.2) (median of 2-3 siRNAs). b, Western Blot and quantification of siRNA-mediated GPX4 knockdown (96 h) in Tet21N cells with doxycycline-regulatable MYCN (experiment replicated 3 times). c, Relative viability (survival of compound-treated cells divided by survival of vehicle-treated cells) of IMR5/75 cell line after treatment with RSL-3 in the presence or absence of MYC inhibitor (10058-F4) (n = 4 samples, experiment replicated 3 times) and d, Response to GPX4 inhibitors (RSL-3, ML-210) (CTRPv2 database); H = high and L = low MYC(N) activity; Wilcoxon rank-sum test. e, Sensitivity to RSL-3-induced ferroptosis in MYCN-amplified neuroblastoma cell lines (n = 4 samples, experiment replicated 3 times). f, MYC(N) activity correlation with GCLC or GSR dependency in nine neuroblastoma cell lines (DRIVE database). g, Low expression of SLC7A11 and high expression of CBS associated with GPX4 dependency in 384 cancer cell lines (DRIVE database). TXNRD1 expression dependent on GPX4 knockdown sensitivity in 384 cancer cells lines (Wilcoxon rank-sum test). h, GPX4 dependency in 348 cancer cell lines grouped according to cancer entities (DRIVE database). k, Relative viability of NB69, SH-SY5Y and SK-N-DZ cell lines after treatment with erastin. n = 3 samples, experiment replicated 3 times. i, j, l, m, Expression of SLC7A11 or CBS in cell lines (CCLE database, n = 917) or tissues (R2 database). Box plots: center line indicates the median value, lower and upper hinges represent the 25th and 75th percentiles, respectively, and whiskers denote 1.5× interquartile range. Each dot corresponds to one sample; Wilcoxon rank-sum test; p-values as indicated. Source data
Extended Data Fig. 3
Extended Data Fig. 3. Quantification of transsulfuration activity.
a, Western Blot and quantification of CTH or AHCY protein expression upon siRNA-mediated knockdown in IMR5/75 high MYCN or low MYCN cells. Experiment replicated 3 times. b, Two methyltransferases that may indirectly increase Hcy levels are synthetic lethal with high MYCN (MYCN siRNA screen; false discovery rate of 0.2); center line indicates the median value of 2-3 siRNAs, lower and upper hinges represent the 25th and 75th percentiles, respectively, and whiskers denote 1.5× interquartile range. c, Relative viability (survival of compound-treated cells divided by survival of vehicle-treated cells) of adrenergic and mesenchymal neuroblastoma cell lines after Cys2 deprivation in the presence or absence of Cysta or Hcy. n = 4 samples, experiment replicated 3 times. d, Impact of protein synthesis inhibition by cycloheximide (CHX) on cysteine (n = 5 samples) and glutathione level (n = 6 samples and CHX, 100 ng/ml, 24 h and experiment replicated 3 times). e, Cell cycle analysis of MYCN-amplified IMR5/75 cells (24 h) after Cys2 depletion (representative measurement of 3 replicates). f, Analysis of protein synthesis in MYCN-amplified IMR5/75 cells (24 h) after low levels or complete depletion of Cys2, methionine (Met) or glutamine (Gln) in the culture medium (n = 3 samples, experiment replicated 3 times). g, MYCN protein expression (by western blot) upon MYCN-MAX inhibition (10058-F4), protein synthesis inhibition by cycloheximide (CHX, 100 ng/ml) and low levels or complete depletion of Cys2, methionine (Met) or glutamine (Gln) in the culture medium after 8 h. Experiment replicated 3 times. h, i, j, RNA-seq and RT-qPCR of IMR5/75 cells 24 h following Cys, Gln depletion and Glu excess or erastin treatment and regulation of ferroptosis-related genes (n = 6 samples in h, n = 3 samples in i; experiment replicated 3 times). Statistical analysis was performed using Student’s two-tailed t-test. Source data
Extended Data Fig. 4
Extended Data Fig. 4. Expression profiles of neuroblastoma cell lines.
a, Time-resolved gene expression profiles during cell cycle progression and cell cycle analysis distinguish pervasive MYCN functions from indirect effects related to cell proliferation rate in high MYCN and low MYCN IMR5/75 cells: MYCN gene expression profile reveals two cell cycle-related peaks (P1 before G1-S transition and P2 before S-G2/M). b, Fold change (log2) of gene expression in mesenchymal Tet21N (SH-EP-ectMYCN) cells harboring an inducible MYCN transgene upon MYCN induction. Tet21N and parental SH-EP cells have low CBS expression and inactive transsulfuration. MYCN induction has a significant effect on AHCY, GCLC, GSR, SLC7A11 and TXNRD1 but not on CBS expression; experiment replicated 3 times. c, Expression of transsulfuration, amino acid uptake/metabolism and glutathione biosynthesis/metabolism/degradation genes in 32 neuroblastoma cell lines (RNA-seq): MYCN-amplified (amp) vs. MYCN/MYC-translocated/activated (t/a) cell lines, MYC(N)-non-expressors (n) (Wilcoxon rank-sum test; NS = not significant). Center line indicates the median value, lower and upper hinges represent the 25th and 75th percentiles, respectively, and whiskers denote 1.5× interquartile range. Each dot corresponds to one sample; p-values as indicated. Source data
Extended Data Fig. 5
Extended Data Fig. 5. ChIP-seq data for histone modifications.
RNA-seq normalized reads and input normalized read counts of ChIP-seq experiments for histone modifications at the CBS gene locus in adrenergic MYCN-amplified IMR5/75, MYCN-translocated NBL-S, and MYC-translocated NB69 cells with high CBS expression and active transsulfuration, mesenchymal MYCN-normal diploid SH-EP, GI-M-EN, and SK-N-AS cells with elevated MYC expression due to translocations or unknown mechanism (GI-M-EN) and very low/absent CBS expression and inactive transsulfuration. Source data
Extended Data Fig. 6
Extended Data Fig. 6. Methylation profiles and CBS expression in tumor samples.
Genomic position of CBS-annotated CpGs whose methylation is significantly associated with CBS expression and patient risk (p < 0.01, Wilcoxon rank-sum statistics and p < 0.05, Fisher exact test). DNA methylation assessed by Infinium Human Methylation 450 BeadChips, and CBS expression assessed by 44k customized Agilent oligonucleotide microarrays in 105 primary neuroblastomas (GEO accession GSE73518). For all CBS CpGs whose methylation significantly correlated with CBS expression and patient risk, hypomethylation was associated with CBS upregulation and high-risk disease. R2 Genomics Analysis and Visualization Platform (http://r2.amc.nl) was used for data visualization. Source data
Extended Data Fig. 7
Extended Data Fig. 7. Gating strategy for flow cytometry data.
For all samples, an initial manual gate in SSC-A by FSC-A was set to identify live cells and exclude debris. From the live cells, a rectangular gate was set on FSC-H by FSC-A to exclude doublets, meaning cells off the diagonal. If DNA staining was carried out, an additional gate was set on DNA (Violet channel)-W by DNA-A to exclude additional cell debris or DNA doublets.

Comment in

Similar articles

Cited by

References

    1. Lin CY, et al. Transcriptional amplification in tumor cells with elevated c-Myc. Cell. 2012;151:56–67. doi: 10.1016/j.cell.2012.08.026. - DOI - PMC - PubMed
    1. Stine ZE, Walton ZE, Altman BJ, Hsieh AL, Dang CV. MYC, metabolism, and cancer. Cancer Discov. 2015;5:1024–1039. doi: 10.1158/2159-8290.CD-15-0507. - DOI - PMC - PubMed
    1. Murphy DJ, et al. Distinct thresholds govern Myc’s biological output in vivo. Cancer Cell. 2008;14:447–457. doi: 10.1016/j.ccr.2008.10.018. - DOI - PMC - PubMed
    1. Maris JM. Recent advances in neuroblastoma. N. Engl. J. Med. 2010;362:2202–2211. doi: 10.1056/NEJMra0804577. - DOI - PMC - PubMed
    1. Westermann F, et al. Distinct transcriptional MYCN/c-MYC activities are associated with spontaneous regression or malignant progression in neuroblastomas. Genome Biol. 2008;9:R150. doi: 10.1186/gb-2008-9-10-r150. - DOI - PMC - PubMed

Publication types