. 2022 Apr 29;22(1):222.
doi: 10.1186/s12870-022-03588-8.

Transcriptome and metabolome analyses reveal new insights into chlorophyll, photosynthesis, metal ion and phenylpropanoids related pathways during sugarcane ratoon chlorosis

Affiliations

Transcriptome and metabolome analyses reveal new insights into chlorophyll, photosynthesis, metal ion and phenylpropanoids related pathways during sugarcane ratoon chlorosis

Ting Luo et al. BMC Plant Biol. .

Abstract

Background: Ratoon sugarcane is susceptible to chlorosis, characterized by chlorophyll loss, poor growth, and a multitude of nutritional deficiency mainly occurring at young stage. Chlorosis would significantly reduce the cane production. The molecular mechanism underlying this phenomenon remains unknown. We analyzed the transcriptome and metabolome of chlorotic and non-chlorotic sugarcane leaves of the same age from the same field to gain molecular insights into this phenomenon.

Results: The agronomic traits, such as plant height and the number of leaf, stalk node, and tillers declined in chlorotic sugarcane. Chlorotic leaves had substantially lower chlorophyll content than green leaves. A total of 11,776 differentially expressed genes (DEGs) were discovered in transcriptome analysis. In the KEGG enriched chlorophyll metabolism pathway, sixteen DEGs were found, eleven of which were down-regulated. Two photosynthesis pathways were also enriched with 32 genes downregulated and four genes up-regulated. Among the 81 enriched GO biological processes, there were four categories related to metal ion homeostasis and three related to metal ion transport. Approximately 400 metabolites were identified in metabolome analysis. The thirteen differentially expressed metabolites (DEMs) were all found down-regulated. The phenylpropanoid biosynthesis pathway was enriched in DEGs and DEMs, indicating a potentially vital role for phenylpropanoids in chlorosis.

Conclusions: Chlorophyll production, metal ion metabolism, photosynthesis, and some metabolites in the phenylpropanoid biosynthesis pathway were considerably altered in chlorotic ratoon sugarcane leaves. Our finding revealed the relation between chlorosis and these pathways, which will help expand our mechanistic understanding of ratoon sugarcane chlorosis.

Keywords: Chlorophyll metabolism; Metal ion metabolism; Phenylpropanoids biosynthesis; Photosynthesis; Ratoon sugarcane chlorosis.


Conflict of interest statement

The authors declared that this study was conducted in the absence of any commercial or financial relationships that could be construed as a potential conflict of interest.

Figures
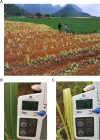
Fig. 1
Fig. 1
The sugarcane field with ratoon chlorotic and green plants (A). The green leaves (B, control) with SPAD reading higher than 40 and the chlorotic leaves (C) with SPAD reading lower than 10 were selected for experiments
Fig. 2
Fig. 2
Plant height (A), and the number of leaves (B), stalk nodes (C), and tillers number (D) of plants with and without chlorosis. The x-axis represents the date of sampling
Fig. 3
Fig. 3
Summary of the transcriptome of sugarcane in ratoon chlorosis leaves and planted plantlet green leaves. Transcriptome de novo assembly completeness analysis using BUSCO alignment (A). Complete orthologues include a single copy (blue) and duplicated copies (green). Incomplete orthologues are fragmented (yellow). The missing (red) copies are not found in the BUSCO database. The Venn diagram of aligned and annotated assembly using multi databases (B). The distribution of species annotation unigenes (C). The volcano plot of expression unigenes (D). The up-and down-regulated genes are represented as red and yellow dots, while the light blue dots indicate the unigenes without significant changes. The unigenes with a fold change higher than 2 and a p-value lower than 0.05 are determined as DEGs
Fig. 4
Fig. 4
GO and KEGG pathway enrichment analysis of DEGs. The 10 most enriched GO terms in cellular component (A), molecular function (B), and biological process (C). The number of X axial represents the ratio of DEGs in each term. The circle size denotes gene number. The 10 most enriched KEGG pathways (D). The number near each column represents the gene number and percent of that pathway, respectively. High and low p-values are denoted in red and blue, respectively
Fig. 5
Fig. 5
The diagram of the chlorophyll metabolism pathway. A The chlorophyll metabolism pathway is presented in a way of successive reaction steps. The circle denotes a chemical compound. The gene name upon the arrow denotes RNA or protein. The normalized gene expression is shown in a box with colors. The direction of the arrow means activation. Colour gradients from green to red represents the Log2FC of the genes. B The chlorophyll concentrations in sugarcane leaves of control and chlorosis samples. Each value represents a sample. The red line indicates the mean value of each group. An unpaired t-test was used to compare the differences between the two groups. p-value = 0.024. ** denotes highly significant. hemA, glutamyl-tRNA reductase; hemL, glutamate-1-semialdehyde 2,1-aminomutase; hemB, porphobilinogen synthase; hemE, uroporphyrinogen decarboxylase; hemF, coproporphyrinogen III oxidase; hemY, protoporphyrinogen/coproporphyrinogen III oxidase; chlH, magnesium chelatase subunit H; bchM, magnesium-protoporphyrin O-methyltransferase; chlE, magnesium-protoporphyrin IX monomethyl ester (oxidative) cyclase; por, protochlorophyllide reductase; DVR, divinyl chlorophyllide a 8-vinyl-reductase; chlG, chlorophyll/bacteriochlorophyll a synthase; CLH, chlorophyllase; HCAR, 7-hydroxymethyl chlorophyll a reductase; NOL, chlorophyll (ide) b reductase; CAO, chlorophyllide a oxygenase
Fig. 6
Fig. 6
DEGs related to the photosynthesis pathways. A The KEGG pathway map of photosynthesis. B The KEGG pathway map of photosynthesis-antenna protein. The images were obtained from the KEGG database. The DEGs expression pattern was used to annotate and generate a corresponding map. The green box with gene symbols denotes down-regulated expression in the chlorosis group, while the red box denotes up-regulated expression. The genes without significant change were displayed with a grey box. C Expression profile of genes related to photosynthesis pathways. The vertical column represents a sample. The horizontal row represents a gene. The expression ratios are based on log2 RPKM value and normalized at row level. Each gene is presented with gene ID and gene name. PsbA-Psb27, photosystem II structure proteins; PsaA-PsaX, photosystem I structure proteins; PetB-PetG, cytochrome b6/f complex proteins; PetF, ferredoxin; beta, fF-type H+/Na + −transporting ATPase subunit beta; a, F-type H + -transporting ATPase subunit a; Lhca1-Lhca5, light-harvesting complex I chlorophyll a/b binding protein; Lhcb1-Lhcb7, light-harvesting complex II chlorophyll a/b binding protein 1
Fig. 7
Fig. 7
KEGG enrichment analysis and expression profiles of DEGs related to metal ion homeostasis or transport. A The seven enriched pathways related to metal ion homeostasis or transport (p-value < 0.05). The number near each column represents the gene number and percent of that pathway, respectively. High and low p-values are denoted in red and blue, respectively. B Heat map of the expression profile of genes related to metal ion homeostasis or transport
Fig. 8
Fig. 8
The diagram of the phenylpropanoid synthesis pathway. The names in light-type letters are metabolites compounds. The DEGs are exhibited in a bold-type letter upon the arrow. The fold change of DEGs and metabolites is shown in heatmap style. Square denotes DEGs, while the circle denotes the DEMs. Colour gradients from green to red represents the Log2FC of the genes or metabolites. PTAL, phenylalanine/tyrosine ammonia-lyase; C4H, trans-cinnamate 4-monooxygenase; C3H, 5-O-(4-coumaroyl)-D-quinate 3′-monooxygenase; COMT, caffeic acid 3-O-methyltransferase; 4CL, 4-coumarate--CoA ligase; HCT, shikimate O-hydroxycinnamoyltransferase; CCoAOMT, caffeoyl-CoA O-methyltransferase; CCR, cinnamoyl-CoA reductase; CAD, cinnamyl-alcohol dehydrogenase; POD, peroxidase; F5H, ferulate-5-hydroxylase; EC:1.14.13.14, trans-cinnamate 2-monooxygenase; EC:2.4.1.114, 2-coumarate O-beta-glucosyltransferase; BGLU, beta-glucosidase
Fig. 9
Fig. 9
The validation of transcriptome using qRT-PCR. A The 20 genes expression pattern of transcriptome and qRT-PCR. The columns in black and grey denote the expression value of transcriptome and qRT-PCR, respectively. The value represents the log2 fold change in the chlorosis group compared with the control group. B Correlation of transcriptome (x-axis) and qRT-PCR (y-axis) data

Similar articles

Cited by

References

    1. Zhang M, Govindaraju M. Sugarcane production in China. In: de Oliveira, A. o. , editor. Sugarcane - Technology and Research [Internet]. London: IntechOpen; 2018. 10.5772/intechopen.73113.
    1. Chen G-F, Liu Z, Huang Y-Y, Xiong L-M, Tan Y-M, Xing Y, Tang Q-Z. Factors responsible for sugarcane ratoon chlorosis in acid soil and its management in Guangxi province of China. Sugar Tech. 2016;18(5):500–504. doi: 10.1007/s12355-016-0425-2. - DOI
    1. Huang YL, Yang S, Long GX, Zhao ZK, Li XF, Gu MH. Manganese toxicity in sugarcane plantlets grown on acidic soils of southern China. PLoS One. 2016;11(3):e0148956. doi: 10.1371/journal.pone.0148956. - DOI - PMC - PubMed
    1. Tanaka A, Tanaka R. Chlorophyll metabolism. Curr Opin Plant Biol. 2006;9(3):248–255. doi: 10.1016/j.pbi.2006.03.011. - DOI - PubMed
    1. Li J, Cao X, Jia X, Liu L, Cao H, Qin W, et al. Iron deficiency leads to Chlorosis through impacting chlorophyll synthesis and nitrogen metabolism in Areca catechu L. Front Plant Sci. 2021;12:710093. - PMC - PubMed

LinkOut - more resources