

Modeling trend changes in percent of under five-year-old children with malnutrition amongst 39 Asian countries from 1987 to 2016 via growth mixture model
- PMID: 35484594
- PMCID: PMC9052463
- DOI: 10.1186/s40795-022-00530-x
Modeling trend changes in percent of under five-year-old children with malnutrition amongst 39 Asian countries from 1987 to 2016 via growth mixture model
Abstract
Purpose: Malnutrition is an important public health issue and the main cause of child morbidity and mortality, especially in developing countries. The present study aimed to model trend changes in percentage of the malnourished children under 5 among 39 Asian countries during 1987 to 2016.
Methods: Information about percentage of the malnourished under 5 years children based on under-weight (weight for age) malnutrition for 39 Asian countries were extracted from Gapminder web site during 1987 to 2016. To cluster Asian countries based on trend changes, Growth Mixture Model (GMM) was implemented. All the statistical analyses were performed in Mplus 7.4 software and P < 0.10 in likelihood ratio test (LRT) was considered as statistically significant.
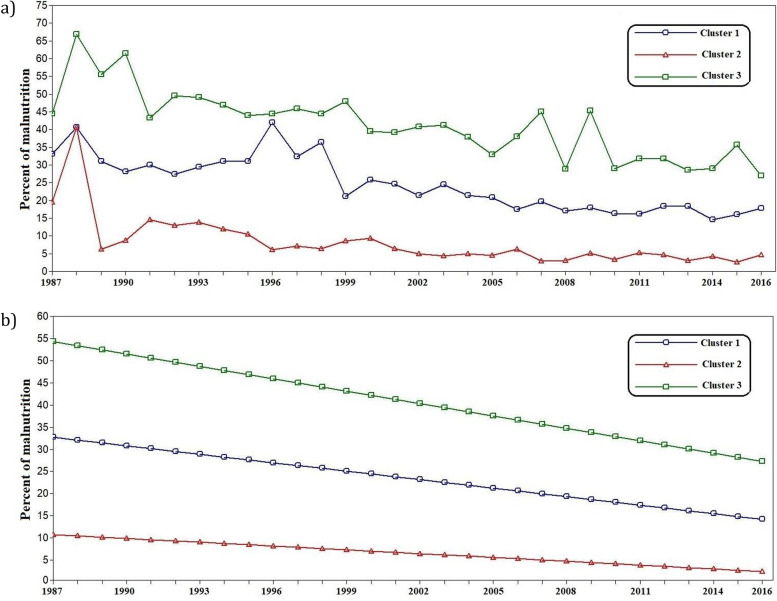
Results: Based on P-value of LRT, the model with 3 clusters was selected. Although, cluster 3 with 9 countries had higher intercept in 1987 and the worst situation in malnutrition, they gained a sharp decrease (- 0.93) in percentage of malnourished children under five annually. The slope of - 0.64 for cluster 1 countries indicate a moderate decrease annually in percent of children with malnutrition. The other 20 countries with slope of - 0.29 in their linear trend belonged to cluster 2 which shows slow decrease in the percentage of children with malnutrition.
Conclusion: The investments in public health and education programs, as well as political commitment and government proper response in line with needs and demands are crucial to promote food security, nourishing diets and improving child nutrition. Certainly, most of them are still a long way from eradicating malnutrition.
Keywords: Asia; Children; Growth mixture model; Malnutrition; Trend.
© 2022. The Author(s).
Conflict of interest statement
The authors declare that they have no conflict of interest.
Figures
References
-
- Bhutta ZA, Bawany FA, Feroze A, Rizvi A. Editors. The impact of the food and economic crisis on child health and nutrition. UNICEF conference. New York: UNICEF; 2008.
-
- World Health Organization. Malnutrition. 2018. Retrived from https://www.who.int/news-room/fact-sheets/detail/malnutrition.
-
- The World Bank. Prevalence of underweight, weight for age (% of children under 5) - South Asia. 2022.
LinkOut - more resources
Full Text Sources