. 2022 Apr 28;23(1):106.
doi: 10.1186/s13059-022-02673-3.

Systematic evaluation of colorectal cancer organoid system by single-cell RNA-Seq analysis

Affiliations

Systematic evaluation of colorectal cancer organoid system by single-cell RNA-Seq analysis

Rui Wang et al. Genome Biol. .

Abstract

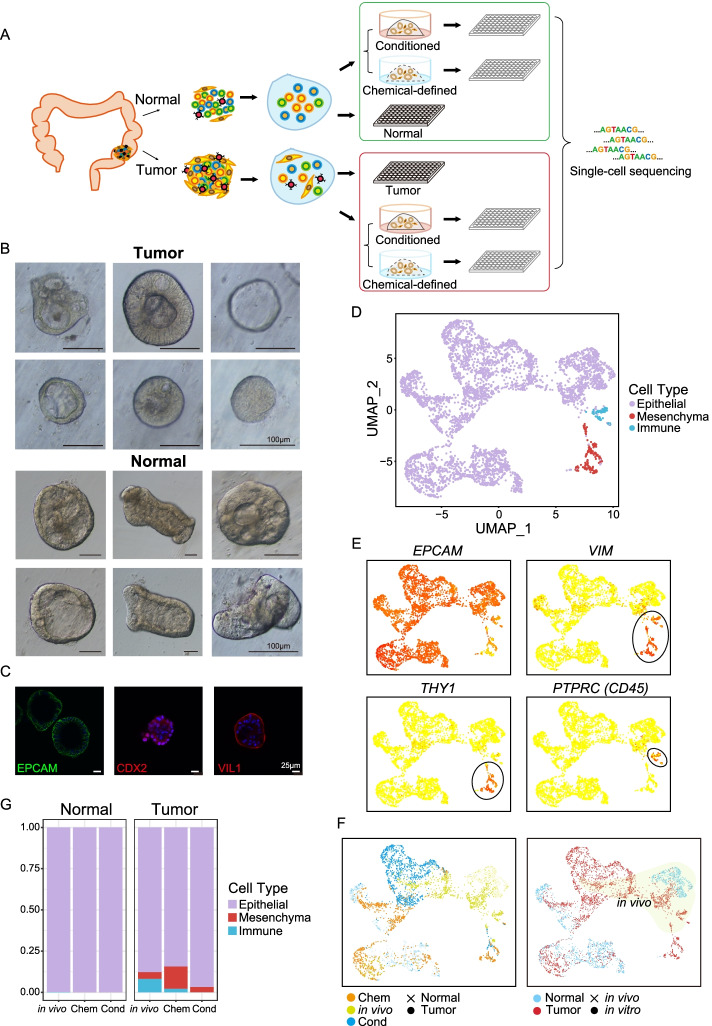
Background: Patient-derived organoid culture is a powerful system for studying the molecular mechanisms of cancers, especially colorectal cancer (CRC), one of the most prevalent cancers worldwide. There are two main types of 3D culture methods for colonic cells, but the similarities and differences between gene expression patterns in different culture media remain largely unexplored.

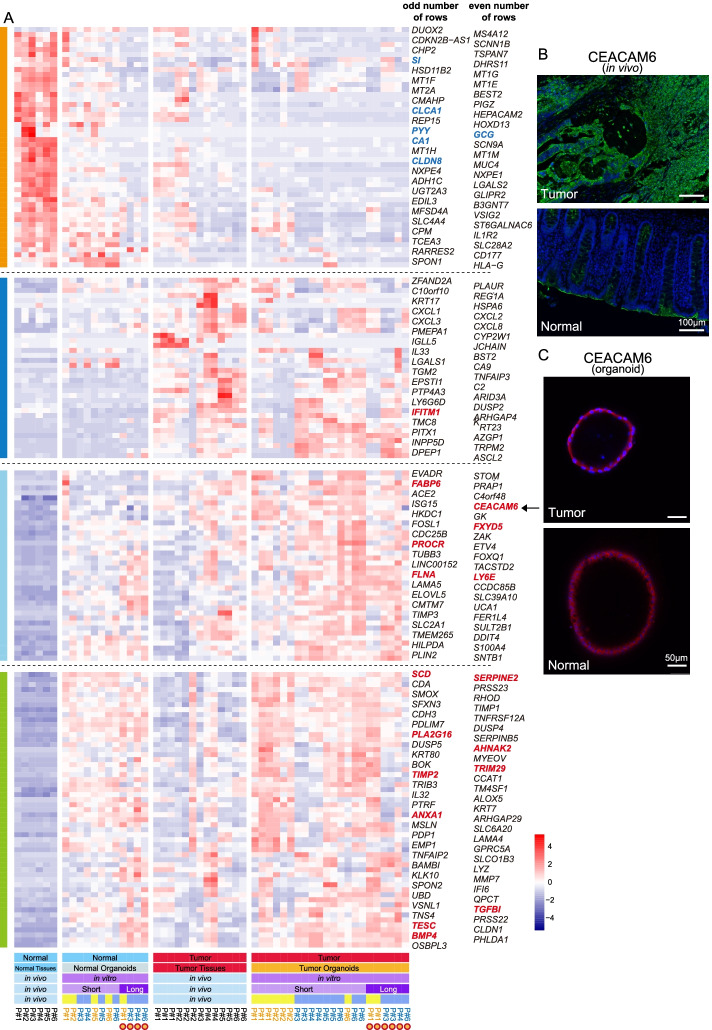
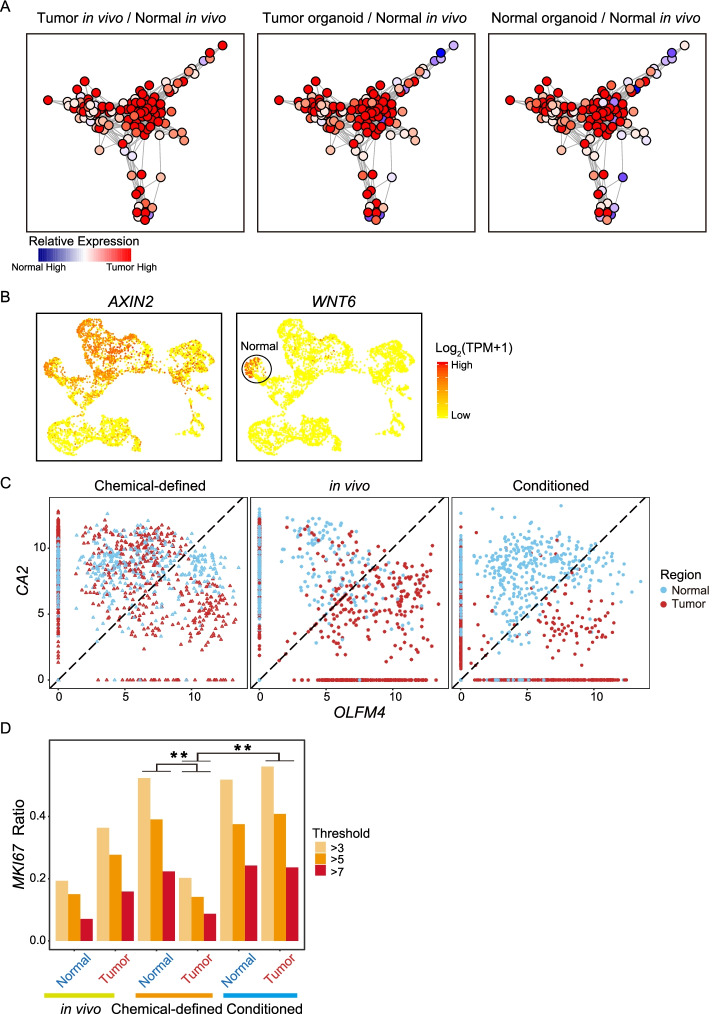
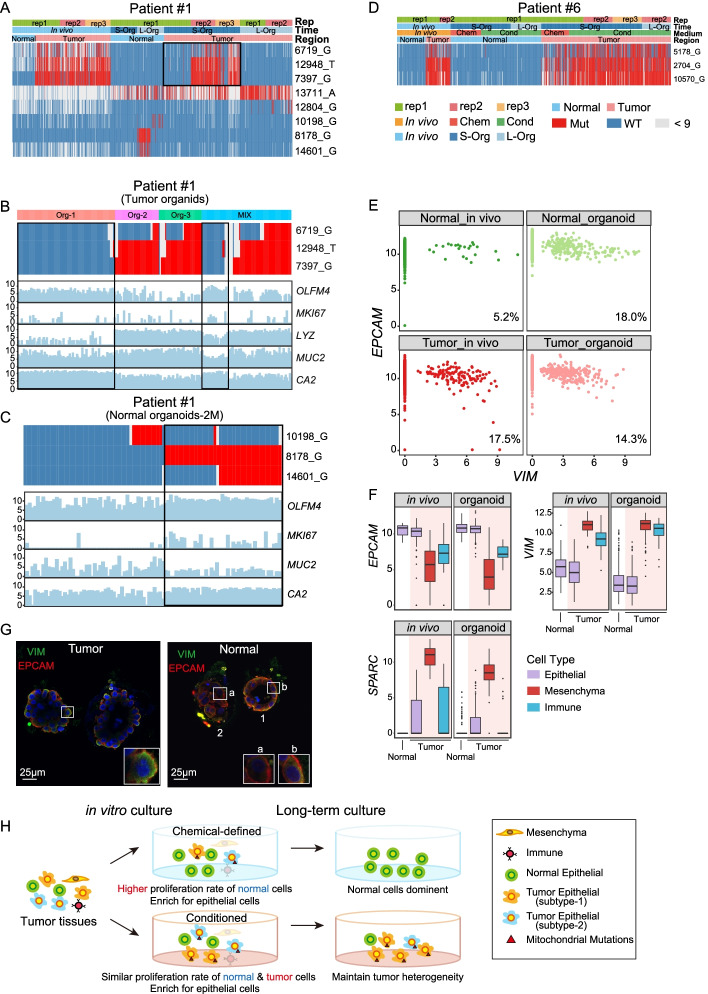
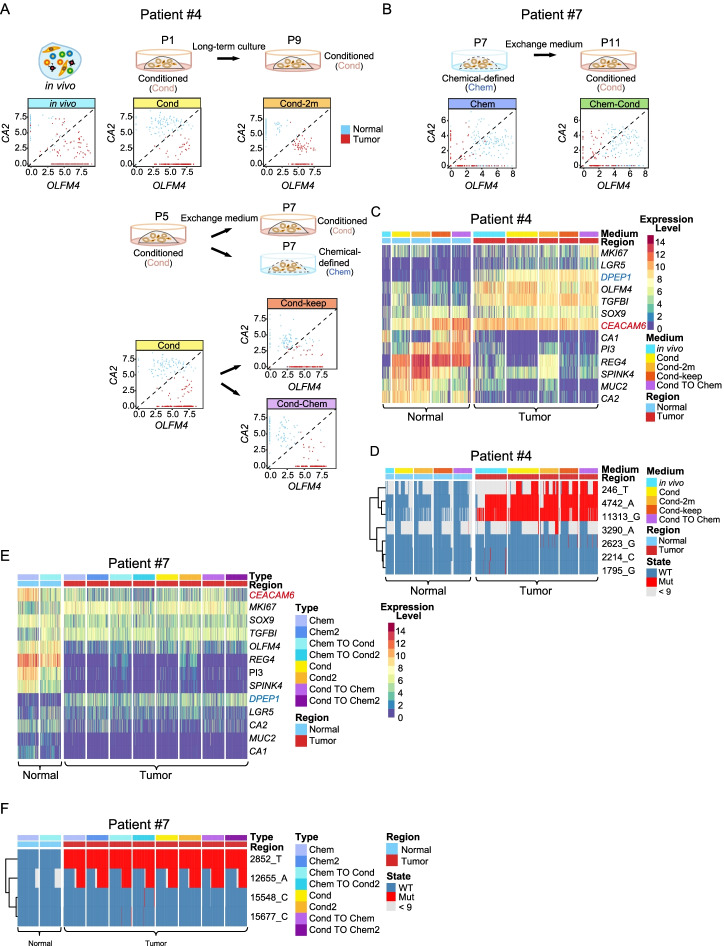
Results: Here, we establish patient-derived organoids from colorectal cancer patients and perform single-cell RNA-Seq for pairwise samples from seven patients for both organoids and their corresponding tumor and normal tissues in vivo. We find that organoids derived from tumor tissues faithfully recapitulate the main gene expression signatures of cancer cells in vivo. On the other hand, organoids derived from normal tissues exhibited some tumor-like features at the whole transcriptome level but retained normal genomic features, such as CNVs, point mutations, and normal global DNA methylation levels, for both cultural media. More importantly, we show that conditioned medium outperforms chemical-defined medium in long-term culture of tumor epithelial cells. Finally, we mutually exchange the culture medium for the organoids and find that after interchanging the medium, the organoid cells basically maintain the transcriptome characteristics of the original medium.

Conclusions: Our work gives a thorough evaluation of both the cultural conditions and the biological features of organoids of CRC patients.


Conflict of interest statement

The authors declare that they have no competing interests.

Figures

Fig. 1
Fig. 1
Global patterns of single-cell RNA-Seq profiles and cell type identification. A Schematic workflow of organoid culture and single-cell RNA-Seq data generation. B Zoomed-in bright-field images of tumor and paired adjacent normal-tissue-derived organoids. The tumor-derived organoids showed diverse morphologies. C Whole-mount immunofluorescent staining of intestine-specific markers on patient-derived organoids. EPCAM, epithelial cell marker; CDX2 and VIL1, intestinal epithelial cell markers. Basic information for these genes can be found in Additional file 4: Table S3. D tSNE visualization of single cells from tissues in vivo and organoid cultures, where individual points correspond to single cells. Cells are colored by annotated cell types. E Expression patterns of well-known cell-type markers were projected onto the tSNE map. The colors from yellow to red represent expression levels from low to high. Black circles highlight the position of immune cells and mesenchymal cells. EPCAM, epithelial cell marker; VIM and THY1, mesenchymal cell markers; PTPRC (CD45), immune cell marker. F tSNE clustering of cells and colors represent culture media or patients. G Cell type ratios for the in vivo tumor and adjacent normal tissues as well as the in vitro-derived organoids in different culture media. Colors represent different cell types
Fig. 2
Fig. 2
Normal tissue-derived organoids exhibited some tumor-like features at the transcriptome level. A Expression patterns of differentially expressed genes (DEGs) of in vivo tumor and adjacent normal tissues. Colors from blue to red represent low to high expression. Short, short-term culture; Long, long-term culture. Patient number in black, blue, and orange represent cells collected from in vivo tissues, in vitro chemical-defined medium, and conditioned medium. The detail description for some of these genes can be found in Additional file 4: Table S3. Many of tumor highly specifically expressed genes were reported to play important roles in colorectal cancer metastasis and progression (such as TGFBI, SCD, TESC, CEACAM6), while some of normal tissue highly expressed genes were well-known intestinal cell-type-specific marker genes, such as SI, CA1, and PYY. B Immunostaining of CEACAM6 in the adjacent normal and tumor tissues in vivo. Scale bar, 100 μm. C Immunostaining of CEACAM6 in the in vitro normal-tissue- and tumor-derived organoids. Scale bar, 50 μm
Fig. 3
Fig. 3
Cancer-derived organoids can maintain in vivo gene regulatory networks and comparisons of two different culture media. A In vivo tumor-specific gene regulatory network. Nodes represent tumor-specific genes and their regulatory genes. The colors represent the fold change in the mean gene expression levels between the two sources of epithelial cells. (Left: tumor cells in vivo compared with normal epithelial cells in vivo; Middle: tumor-derived organoid compared with normal epithelial cells in vivo; Right: normal-derived organoid compared with normal epithelial cells in vivo). B Expression patterns of Wnt signaling pathway target genes AXIN2 and WNT6 were projected onto the tSNE map. The colors from yellow to red represent expression levels from low to high. C Dot plot represents the expression levels of intestinal pluripotency marker OLFM4 and enterocyte marker CA2 for each cell. Colors represent sample regions. Chem, chemical-defined medium; Cond, conditioned medium. D Bar plot showing the ratio of cells that expressed different levels of proliferation marker MKI67. Colors represent different expression range of MKI67. ** indicates p value < 0.01
Fig. 4
Fig. 4
Cancer cell identification and lineage tracing with mitochondrial mutations. A Heatmap showing the mitochondrial mutations in cells of patient #1 that cultured in chemical-defined medium. Red represents mutant site, blue represents wild type, and gray represents site with sequence reads lower than 9. L-Org, long-term cultured organoids; S-Org, short-term cultured organoids. Chem, chemical-defined medium. Cond, conditioned medium. B Heatmap showing the mitochondrial mutations in tumor organoid cells of patient #1 that cultured in chemical-defined medium. Cells of three single organoid spheres and a mixture of several organoids were showed. Bar plot showing the corresponding expression levels of intestinal cell type markers. OLFM4, pluripotent cell marker; MKI67, cell proliferation marker; LYZ, Paneth cell marker; MUC2, goblet cell marker; CA2, enterocyte marker. C Heatmap showing the mitochondrial mutations in long-term-cultured normal organoid cells of patient #1 that cultured in chemical-defined medium. Bar plot showing the corresponding expression levels of intestinal cell type markers. D Heatmap showing the mitochondrial mutations in cells of patient #6 that cultured in both chemical-defined medium and conditioned medium. Red represents mutant site, blue represents wild type, and gray represents site with reads lower than 9. Chem, chemical-defined medium; Cond, conditioned medium. E Scatterplot showing the expression pattern of the epithelial cell marker EPCAM and classical mesenchymal cell marker VIM in each individual epithelial cell. The ratio of cells that co-expressed EPCAM and VIM is shown at the bottom right. F Box plot showing the expression levels of EPCAM, SPARC, and VIM in VIM-positive epithelial cells. The color of bar represents different cell types and the red background highlight cells in tumor. The black lines of box plot represent median values, the box limits indicate upper and lower quartiles, and the whiskers correspond to 1.5× the interquartile range. G Immunofluorescent staining of VIM and EPCAM on tumor- and normal-derived organoids. Three cells are shown at higher magnification at the lower right. Cell #a expressed only EPCAM, while Cell #b co-expressed VIM and EPCAM. H The schematic diagram summarizes the mitochondrial mutations and cell type changes of tumor cells in short-term and long-term cultures in two cultural media
Fig. 5
Fig. 5
Culture medium exchange does not influence CA2 and OLFM4 expression patterns. A Schematic workflow of culture medium exchange for patient #4. Scatterplot showing the expression pattern of the enterocyte marker CA2 and pluripotency cell marker OLFM4 in each individual cell. Organoid cells of patient #4 were established in conditioned medium, after culture for 5 passages (P5), transfer to chemical-defined medium, or still stay in conditioned medium for 9 days and P7 cells were collected and performed scRNA-seq. “P” stands for passage. B Schematic workflow of culture medium exchange for patient #7. Scatterplot showing the expression pattern of the enterocyte marker CA2 and pluripotency cell marker OLFM4 in each individual cell. Organoid cells of patient #7 were established in chemical-defined medium, and P4 cells were transferred to conditioned medium cultured for 25 days and P11 cells were collected and performed scRNA-seq. “P” stands for passage. C Heatmap showing the expression patterns of selected genes in patient #4. In vivo tumor-specific genes: DPEP1, CEACAM6, and TGFBI. Intestinal subtype specific genes: LGR5, SOX9, MKI67, OLFM4, CA1, REG4, SPINK4, MUC2, and CA2. Colors from blue to red represent low to high expression levels. D Heatmap showing mitochondrial mutations of patient #4. Red represents mutant site, blue represents wild type, and gray represents site with reads lower than 9. Chem, chemical-defined medium; Cond, conditioned medium. E Heatmap showing the expression patterns of selected genes in patient #7. Colors from blue to red represent low to high expression levels. F Heatmap showing mitochondrial mutation of patient #7. Red represents mutant site, blue represents wild type, and gray represents site with reads lower than 9. Chem, chemical-defined medium; Cond, conditioned medium

References

    1. Drost J, Clevers H. Organoids in cancer research. Nat Rev Cancer. 2018;18:407–418. doi: 10.1038/s41568-018-0007-6. - DOI - PubMed
    1. Xu H, Lyu X, Yi M, Zhao W, Song Y, Wu K. Organoid technology and applications in cancer research. J Hematol Oncol. 2018;11:116. doi: 10.1186/s13045-018-0662-9. - DOI - PMC - PubMed
    1. van de Wetering M, Francies HE, Francis JM, Bounova G, Iorio F, Pronk A, van Houdt W, van Gorp J, Taylor-Weiner A, Kester L, et al. Prospective derivation of a living organoid biobank of colorectal cancer patients. Cell. 2015;161:933–945. doi: 10.1016/j.cell.2015.03.053. - DOI - PMC - PubMed
    1. Fujii M, Shimokawa M, Date S, Takano A, Matano M, Nanki K, Ohta Y, Toshimitsu K, Nakazato Y, Kawasaki K, et al. A colorectal tumor organoid library demonstrates progressive loss of niche factor requirements during tumorigenesis. Cell Stem Cell. 2016;18:827–838. doi: 10.1016/j.stem.2016.04.003. - DOI - PubMed
    1. Sachs N, de Ligt J, Kopper O, Gogola E, Bounova G, Weeber F, Balgobind AV, Wind K, Gracanin A, Begthel H, et al. A living biobank of breast cancer organoids captures disease heterogeneity. Cell. 2018;172:373–386 e310. doi: 10.1016/j.cell.2017.11.010. - DOI - PubMed

Publication types