. 2022 Apr 28;10(1):66.
doi: 10.1186/s40478-022-01365-0.

Deep learning from multiple experts improves identification of amyloid neuropathologies

Affiliations

Deep learning from multiple experts improves identification of amyloid neuropathologies

Daniel R Wong et al. Acta Neuropathol Commun. .

Abstract

Pathologists can label pathologies differently, making it challenging to yield consistent assessments in the absence of one ground truth. To address this problem, we present a deep learning (DL) approach that draws on a cohort of experts, weighs each contribution, and is robust to noisy labels. We collected 100,495 annotations on 20,099 candidate amyloid beta neuropathologies (cerebral amyloid angiopathy (CAA), and cored and diffuse plaques) from three institutions, independently annotated by five experts. DL methods trained on a consensus-of-two strategy yielded 12.6-26% improvements by area under the precision recall curve (AUPRC) when compared to those that learned individualized annotations. This strategy surpassed individual-expert models, even when unfairly assessed on benchmarks favoring them. Moreover, ensembling over individual models was robust to hidden random annotators. In blind prospective tests of 52,555 subsequent expert-annotated images, the models labeled pathologies like their human counterparts (consensus model AUPRC = 0.74 cored; 0.69 CAA). This study demonstrates a means to combine multiple ground truths into a common-ground DL model that yields consistent diagnoses informed by multiple and potentially variable expert opinions.

Keywords: Algorithms; Amyloid beta; Consensus; Deep learning; Expert annotators; Histopathology.


Conflict of interest statement

The authors declare that they have no competing interests.

Figures
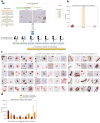
Fig. 1
Fig. 1
We curated annotations of Aβ neuropathologies from multiple experts, and found differing degrees of consensus. a Five experts (NP) and two undergraduate novices (UG) used a custom web portal for annotation. Each annotator labeled the same set of images in the same order. From the expert annotations, we constructed consensus-of-n labels (n = 1 to n = 5) for the same 20,099 images. b Average class distributions are consistent across the seven annotators. The y-axis plots average frequency, while the x-axis plots the Aβ class. c Representative images illustrating consensus-of-n strategies applied to each Aβ class, with rows progressing from top to bottom in order of increasing consensus. For a consensus-of-n image, at least n experts labeled the image as positive for the designated class. Each image was randomly and independently chosen from the set of images. d Positive annotation distributions differ by Aβ class. The x-axis plots the exact (not cumulative) number of annotators who gave a positive label. Hence, when e = 1 and e = 5 this is equivalent to a consensus-of-one and consensus-of-five respectively. For e = 2, 3, or 4, this is not equivalent to an at-least-n consensus strategy. The y-axis plots the frequency. Each class has a different count of total positive labels (indicated in the legend). This total count represents the total number of images with at least one expert identifying the class. Each image may have multiple classes present
Fig. 2
Fig. 2
Inter-rater agreement varies by class and annotator. a Venn diagrams by class, with overlaps of each permutation of NP1 through NP5. Each overlap shows the count of how many images are all positively annotated by the experts included in that overlap. Areas are not to scale. b Kappa coefficients [36] indicating agreement between each pair of experts. A high kappa coefficient indicates high inter-rater agreement between two annotators, with kappa = 1.0 indicating perfect agreement, and kappa = 0.0 indicating no agreement other than what would be expected by random chance
Fig. 3
Fig. 3
We trained models to learn human annotation behavior and consensus strategies. Consensus models matched or outperformed individual-expert models in average AUROC and AUPRC, per stacked bar graphs. Error bars show one standard deviation in each direction. The y-axis indicates the score on the hold-out test set for each Aβ class (x-axis). No novice models were included in this evaluation. For the AUPRC metric, the consensus model achieved 0.73 ± 0.03 for cored, 0.98 ± 0.02 for diffuse, and 0.54 ± 0.06 for CAA. The individual-expert models achieved 0.67 ± 0.06 for cored, 0.98 ± 0.02 for diffuse, and 0.48 ± 0.06 for CAA. Random baseline performance for AUPRC is the average prevalence of positive examples. Average random baselines for individuals-experts were equivalent to those of consensus strategies (variance of individual-experts shown): 0.06 ± 0.02 for cored, 0.88 ± 0.06, and 0.02 ± 0.004 for CAA. For the AUROC metric, the consensus models achieved 0.96 ± 0.02 for cored, 0.92 ± 0.02 for diffuse, and 0.93 ± 0.02 for CAA. The individual-expert models achieved 0.94 ± 0.02 for cored, 0.90 ± 0.03 for diffuse, and 0.92 ± 0.03 for CAA. All models were evaluated on their own benchmark (i.e. a consensus model was evaluated on its respective consensus benchmark, and an individual-expert model was evaluated on its expert’s benchmark)
Fig. 4
Fig. 4
Consensus models performed better than individual-expert models across all benchmarks. a Four evaluation benchmark schemes to compare consensus models with individual-expert models. The row indicates the model and the column indicates the benchmark. For each evaluation scheme, the average AUPRC of the blue region (individual-expert models) is compared with the average AUPRC of the gold region (consensus models) over the hold-out test set. The consensus-of-two is dark-gold for emphasis. The “self benchmarks” scheme was the most internally-consistent scheme that evaluated each individual-expert model according to the labels of its annotator (i.e. its own benchmark). For consensus models, the self benchmark corresponded to labels derived from the matching consensus-of-n strategy. The “consensus benchmarks” scheme independently evaluated each model on every consensus-of-n annotation set from n = 1 to n = 5. The “individual benchmarks” scheme independently evaluated each model on each of the five individual-expert benchmarks. The “all benchmarks” scheme evaluated each model on its average performance across all benchmarks. b Performance gains of consensus models over individual-expert models. Values are reported as the absolute AUPRC difference. We calculated p-values of the comparisons using a two-sample Z-test (Methods). P-values for the self-benchmark are not included because the sample size (n = 20 comparisons) is not large enough to assign significance. 95% confidence intervals shown in parentheses. The row indicates the type of benchmark considered when evaluating the model performance differentials, while the column shows the Aβ class being evaluated. Highest performance differential for each Aβ class in bold. c Heatmap as in b, for only the consensus-of-two model versus the individual-expert models. For this consensus-of-two model evaluation, only dark-gold regions in a corresponding to the consensus-of-two model are compared to the blue region
Fig. 5
Fig. 5
Class activation maps (CAM) of DL models indicate progression of human expertise. a Novice CAMs are more diffuse than expert CAMs. The original image (leftmost column), the CAM of the novice model trained on UG1’s annotations (middle column), and the CAM of the consensus-of-two model (rightmost column). CAMs are plotted with a false-color map such that bright regions correspond to high intensity regions with high salience. b Although expert and novice CAMs differ, they converge on the same pixels. We progressively assess the structural similarity index (SSIM) [44] between novice CAMs and consensus-of-two CAMs across the entire test set of images. The CAMs show the most similar salience by SSIM (y-axis) at the highest pixel thresholds as we increment the threshold (x-axis) used to binarize the images before comparison. Binarized examples are shown of one CAM from a (boxed in orange). c Comparing the novice CAMs and the consensus-of-two CAMs, we classify each pixel location into two categories: ON in the novice CAM and OFF in the corresponding consensus CAM (yellow), or OFF in the novice CAM and ON in the consensus CAM (blue). ON and OFF are determined by binarizing the images at pixel threshold t (x-axis). Y-axis shows the proportions at which these two cases occur. Zoomed inset highlights disagreement between CAMs. d Consensus CAM pixels are mostly contained within the novice CAM. The x-axis plots the varying pixel thresholds, while the y-axis plots the percent overlap of either how much of the consensus CAM pixels are a subset of the novice CAM (orange) or how much those of the novice CAM are a subset of the consensus (cyan)
Fig. 6
Fig. 6
Ensembles improve performance and are robust to false information. a Five trained individual-expert CNNs, combined by a trainable sparse affine layer, make up an ensemble model. The training process simply determines how to best weigh and combine each CNN’s existing class predictions. b Ensembling on average increases performance for each Aβ class, and for both consensus and individual benchmarks. Performance gains are calculated by averaging each ensemble’s AUPRC on the hold-out test set minus the corresponding individual-expert CNN’s AUPRC on the same set, across all ten benchmarks (Methods). c We tested ensembling with a random labeler CNN, trained using a randomly shuffled permutation of labels with the same class distribution ratios as the five expert annotations. d Ensemble performance is largely unaffected by inclusion of a random labeler CNN. Density histogram of AUPRC performance differences for each Aβ class between the normal ensemble and the ensemble with a single random labeler CNN. Each ensemble is evaluated on all ten benchmarks (five individual-expert benchmarks, five consensus benchmarks), and the absolute value of the performance differential (x-axis) is calculated and binned for each class. e Ensemble architecture with multiple random labeler CNNs, each trained on a different permutation of randomly shuffled labels. f Ensemble performance is largely unaffected by inclusion of five random labeler CNNs. Same density histogram as in d, but comparison is between normal ensemble and ensemble with five random labeler CNNs injected
Fig. 7
Fig. 7
Models prospectively predict human annotation, with consensus models performing the most consistently. a Schematic of the phase-two annotation protocol. These images fall under one of four categories: self-repeat, consensus-repeat, self-enrichment, and consensus-enrichment. See Methods for a detailed description of these categories. Each annotator is given the same order of image categories. Gradients of different colors indicate images from the same category. These gradients are depicted to reinforce the fact that each annotator received a different set of images for the self-repeat and self-enrichment categories. b Intra-rater agreement is measured as the accuracy at which each rater consistently annotates repeats of the same image (both self-repeat and consensus-repeat). We include image labels from phase-one in this intra-rater calculation. The x-axis indicates the annotator, and the y-axis indicates intra-rater accuracy. Accuracies are averaged over each set of repeated images. Novices achieved an average intra-rater agreement accuracy of 0.92 for cored, 0.90 for diffuse, and 0.97 for CAA. Experts achieved an average intra-rater agreement accuracy of 0.93 for cored, 0.92 for diffuse, and 0.98 for CAA. c Precision recall plots and receiver operating characteristic (ROC) plots for the consensus model versus the individual-expert models. Two different benchmarks are used—truth according to the individual annotators, and truth according to a consensus-of-two scheme. The shaded regions indicate one standard deviation in each direction centered at the mean. The consensus model evaluated under a consensus benchmark (red line) has no variation by definition. d Summarizes panel (c). Bar graphs depict the average performance of the consensus model minus the average performance of the individual-expert models (y-axis). Individual benchmark for figure left, consensus benchmark for figure right. Error bars show one standard deviation centered at the mean

Similar articles

Cited by

References

    1. Bruner JM, Inouye L, Fuller GN, Langford LA. Diagnostic discrepancies and their clinical impact in a neuropathology referral practice. Cancer. 1997;79:796–803. doi: 10.1002/(sici)1097-0142(19970215)79:4<796::aid-cncr17>3.0.co;2-v. - DOI - PubMed
    1. Gill JM, Reese CL, 4th, Diamond JJ. Disagreement among health care professionals about the urgent care needs of emergency department patients. Ann Emerg Med. 1996;28:474–479. doi: 10.1016/s0196-0644(96)70108-7. - DOI - PubMed
    1. Murphy M, Loosemore A, Ferrer I, Wesseling P, Wilkins PR, Bell BA. Neuropathological diagnostic accuracy. Br J Neurosurg. 2002;16:461–464. doi: 10.1080/0268869021000030267. - DOI - PubMed
    1. Campanella G, Hanna MG, Geneslaw L, Miraflor A, Werneck Krauss Silva V, Busam KJ, Brogi E, Reuter VE, Klimstra DS, Fuchs TJ. Clinical-grade computational pathology using weakly supervised deep learning on whole slide images. Nat Med. 2019;25:1301–1309. doi: 10.1038/s41591-019-0508-1. - DOI - PMC - PubMed
    1. Fillenbaum GG, van Belle G, Morris JC, Mohs RC, Mirra SS, Davis PC, Tariot PN, Silverman JM, Clark CM, Welsh-Bohmer KA, Heyman A. Consortium to Establish a Registry for Alzheimer’s Disease (CERAD): the first twenty years. Alzheimers Dement. 2008;4:96–109. doi: 10.1016/j.jalz.2007.08.005. - DOI - PMC - PubMed

Publication types

Substances