

A starch- and sucrose-reduced dietary intervention in irritable bowel syndrome patients produced a shift in gut microbiota composition along with changes in phylum, genus, and amplicon sequence variant abundances, without affecting the micro-RNA levels
- PMID: 35484927
- PMCID: PMC9103372
- DOI: 10.1002/ueg2.12227
A starch- and sucrose-reduced dietary intervention in irritable bowel syndrome patients produced a shift in gut microbiota composition along with changes in phylum, genus, and amplicon sequence variant abundances, without affecting the micro-RNA levels
Abstract
Background/aim: A randomized clinical trial with a starch- and sucrose-reduced diet (SSRD) in irritable bowel syndrome (IBS) patients has shown clear improvement of participants' symptoms. The present study aimed to explore the effects of the SSRD on the gut microbiota and circulating micro-RNA in relation to nutrient intake and gastrointestinal symptoms.
Methods: IBS patients were randomized to a 4-week SSRD intervention (n = 80) or control group (n = 25); habitual diet). At baseline and 4 weeks, blood and fecal samples, 4 day-dietary records, and symptom questionnaires were collected, that is, Rome IV questionnaires, IBS-symptom severity score (IBS-SSS) and visual analog scale for IBS (VAS-IBS). Micro-RNA was analyzed in blood and microbiota in faeces by 16S rRNA from regions V1-V2.
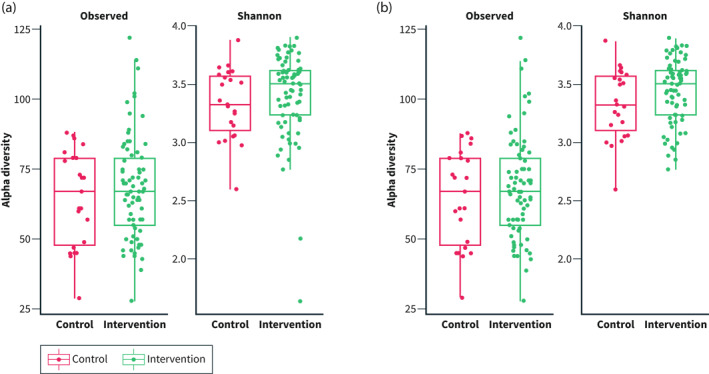
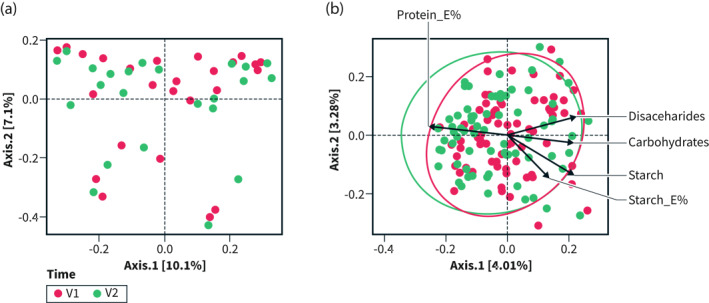
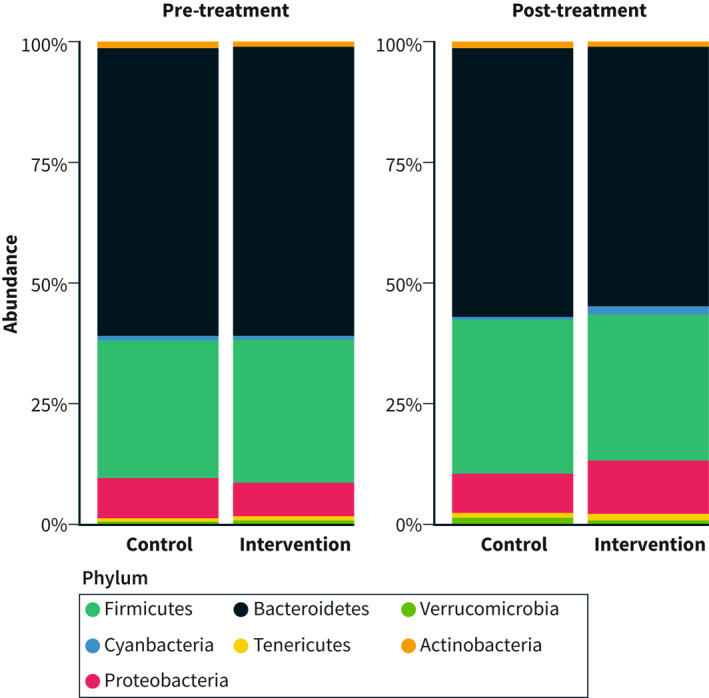
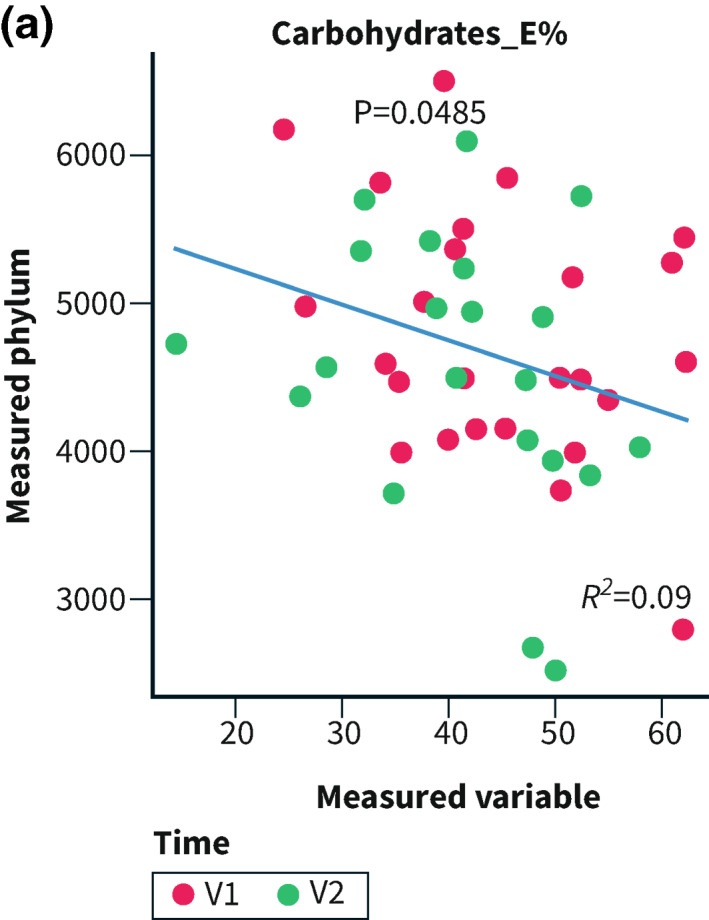
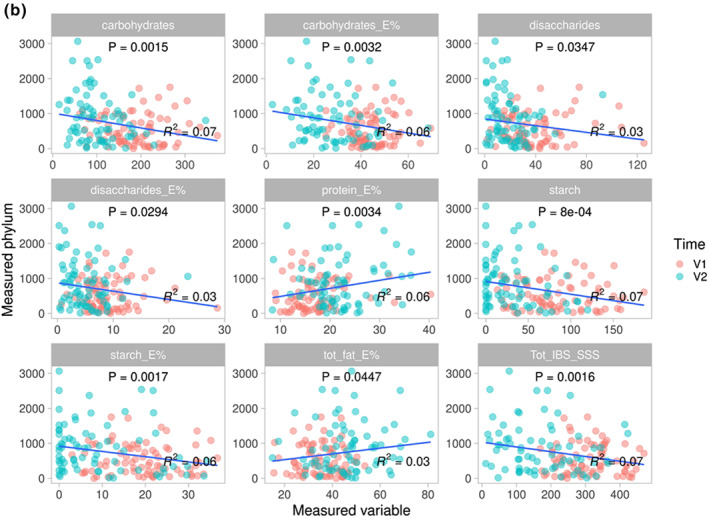
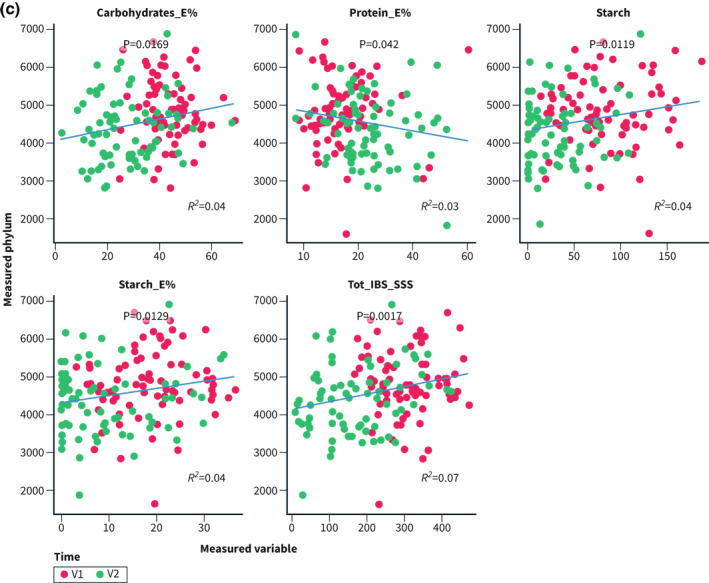
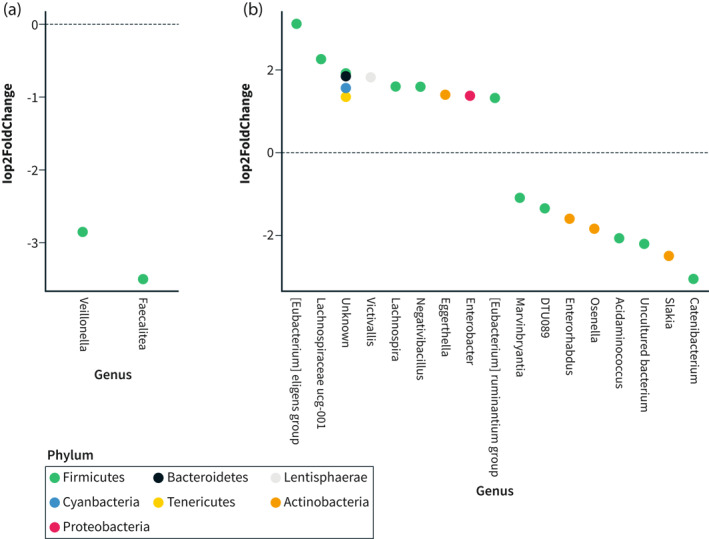
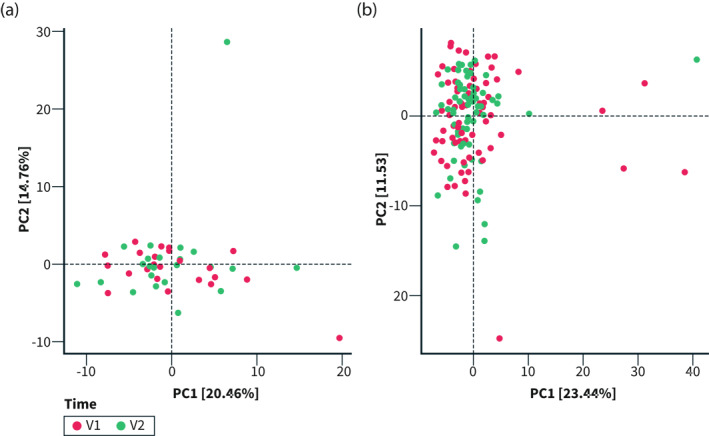
Results: The alpha diversity was unaffected, whereas beta diversity was decreased (p < 0.001) along with increased abundance of Proteobacteria (p = 0.0036) and decreased abundance of Bacteroidetes phyla (p < 0.001) in the intervention group at 4 weeks. Few changes were noted in the controls. The shift in beta diversity and phyla abundance correlated with decreased intakes of carbohydrates, disaccharides, and starch and increased fat and protein intakes. Proteobacteria abundance also correlated positively (R2 = 0.07, p = 0.0016), and Bacteroidetes negatively (R2 = 0.07, p = 0.0017), with reduced total IBS-SSS. Specific genera, for example, Eubacterium eligens, Lachnospiraceae UCG-001, Victivallis, and Lachnospira increased significantly in the intervention group (p < 0.001 for all), whereas Marvinbryantia, DTU089 (Ruminoccocaceae family), Enterorhabdus, and Olsenella decreased, together with changes in amplicon sequence variant (ASV) levels. Modest changes of genus and ASV abundance were observed in the control group. No changes were observed in micro-RNA expression in either group.
Conclusion: The SSRD induced a shift in beta diversity along with several bacteria at different levels, associated with changes in nutrient intakes and reduced gastrointestinal symptoms. No corresponding changes were observed in the control group. Neither the nutrient intake nor the microbiota changes affected micro-RNA expression. The study was registered at ClinicalTrials.gov data base (NCT03306381).
Keywords: gastrointestinal symptoms; gut microbiota; irritable bowel syndrome; micro-RNA; starch- and sucrose-reduced diet.
© 2022 The Authors. United European Gastroenterology Journal published by Wiley Periodicals LLC on behalf of United European Gastroenterology.
Conflict of interest statement
There are no competing interests.
Figures
Similar articles
-
Assessment of a 4-Week Starch- and Sucrose-Reduced Diet and Its Effects on Gastrointestinal Symptoms and Inflammatory Parameters among Patients with Irritable Bowel Syndrome.Nutrients. 2021 Jan 28;13(2):416. doi: 10.3390/nu13020416. Nutrients. 2021. PMID: 33525489 Free PMC article. Clinical Trial.
-
A Starch- and Sucrose-Reduced Diet Has Similar Efficiency as Low FODMAP in IBS-A Randomized Non-Inferiority Study.Nutrients. 2024 Sep 9;16(17):3039. doi: 10.3390/nu16173039. Nutrients. 2024. PMID: 39275354 Free PMC article. Clinical Trial.
-
A Dietary Intervention with Reduction of Starch and Sucrose Leads to Reduced Gastrointestinal and Extra-Intestinal Symptoms in IBS Patients.Nutrients. 2019 Jul 20;11(7):1662. doi: 10.3390/nu11071662. Nutrients. 2019. PMID: 31330810 Free PMC article. Clinical Trial.
-
Alterations of Gut Microbiota in Patients With Irritable Bowel Syndrome Based on 16S rRNA-Targeted Sequencing: A Systematic Review.Clin Transl Gastroenterol. 2019 Feb;10(2):e00012. doi: 10.14309/ctg.0000000000000012. Clin Transl Gastroenterol. 2019. PMID: 30829919 Free PMC article.
-
Exploring the Role of Vitamin D and the Gut Microbiome: A Cross-Sectional Study of Individuals with Irritable Bowel Syndrome and Healthy Controls.Biol Res Nurs. 2023 Jul;25(3):436-443. doi: 10.1177/10998004221150395. Epub 2023 Jan 9. Biol Res Nurs. 2023. PMID: 36624571 Free PMC article.
Cited by
-
Multiple omics reveal link between the microbiota-gut-brain axis and intracranial aneurysm rupture.iScience. 2024 Oct 16;27(11):111184. doi: 10.1016/j.isci.2024.111184. eCollection 2024 Nov 15. iScience. 2024. PMID: 39524364 Free PMC article.
-
UEG week and UEG journal: A strong scientific liaison.United European Gastroenterol J. 2022 Oct;10(8):901-905. doi: 10.1002/ueg2.12312. Epub 2022 Sep 20. United European Gastroenterol J. 2022. PMID: 36126040 Free PMC article. No abstract available.
-
Optimization of Fermented Maize Stover for the Fattening Phase of Geese: Effect on Production Performance and Gut Microflora.Animals (Basel). 2024 Jan 29;14(3):433. doi: 10.3390/ani14030433. Animals (Basel). 2024. PMID: 38338076 Free PMC article.
-
Bio-Fermented Malic Acid Facilitates the Production of High-Quality Chicken via Enhancing Muscle Antioxidant Capacity of Broilers.Antioxidants (Basel). 2022 Nov 22;11(12):2309. doi: 10.3390/antiox11122309. Antioxidants (Basel). 2022. PMID: 36552518 Free PMC article.
-
Knowledge, attitude, and practice of healthcare professionals towards irritable bowel syndrome: a multicenter, cross-sectional study.Sci Rep. 2024 Nov 25;14(1):29128. doi: 10.1038/s41598-024-80680-z. Sci Rep. 2024. PMID: 39582074 Free PMC article.
References
-
- Sperber AD, Dumitrascu D, Fukudo S, Gerson C, Ghoshal UC, Gwee KA, et al. The global prevalence of IBS in adults remains elusive due to the heterogeneity of studies: a Rome Foundation working team literature review. Gut. 2017;66(6):1075–1082. - PubMed
-
- Sperber AD, Bangdiwala SI, Drossman DA, Ghoshal UC, Simren M, Tack J, et al. Worldwide prevalence and burden of functional gastrointestinal disorders, results of Rome foundation global study. Gastroenterology. 2021;160(1):99–114. - PubMed
-
- Mitchell H, Porter J, Gibson PR, Barrett J, Garg M. Review article: implementation of a diet low in FODMAPs for patients with irritable bowel syndrome‐directions for future research. Aliment Pharmacol Ther. 2019;49(2):124–39. - PubMed
Publication types
MeSH terms
Substances
Associated data
LinkOut - more resources
Full Text Sources
Medical
