. 2022 Apr;12(4):e836.
doi: 10.1002/ctm2.836.

A novel EHD1/CD44/Hippo/SP1 positive feedback loop potentiates stemness and metastasis in lung adenocarcinoma

Affiliations

A novel EHD1/CD44/Hippo/SP1 positive feedback loop potentiates stemness and metastasis in lung adenocarcinoma

Yuechao Liu et al. Clin Transl Med. 2022 Apr.

Abstract

Background: There is growing evidence that endocytosis plays a pivotal role in cancer metastasis. In this study, we first identified endocytic and metastasis-associated genes (EMGs) and then investigated the biological functions and mechanisms of EMGs.

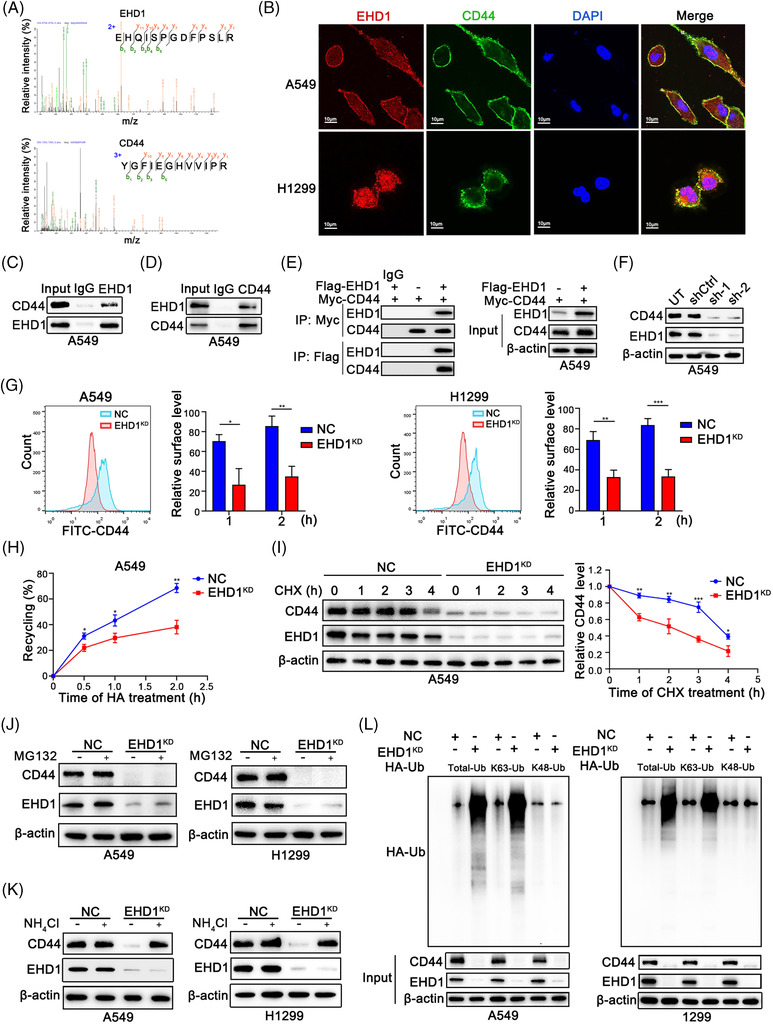
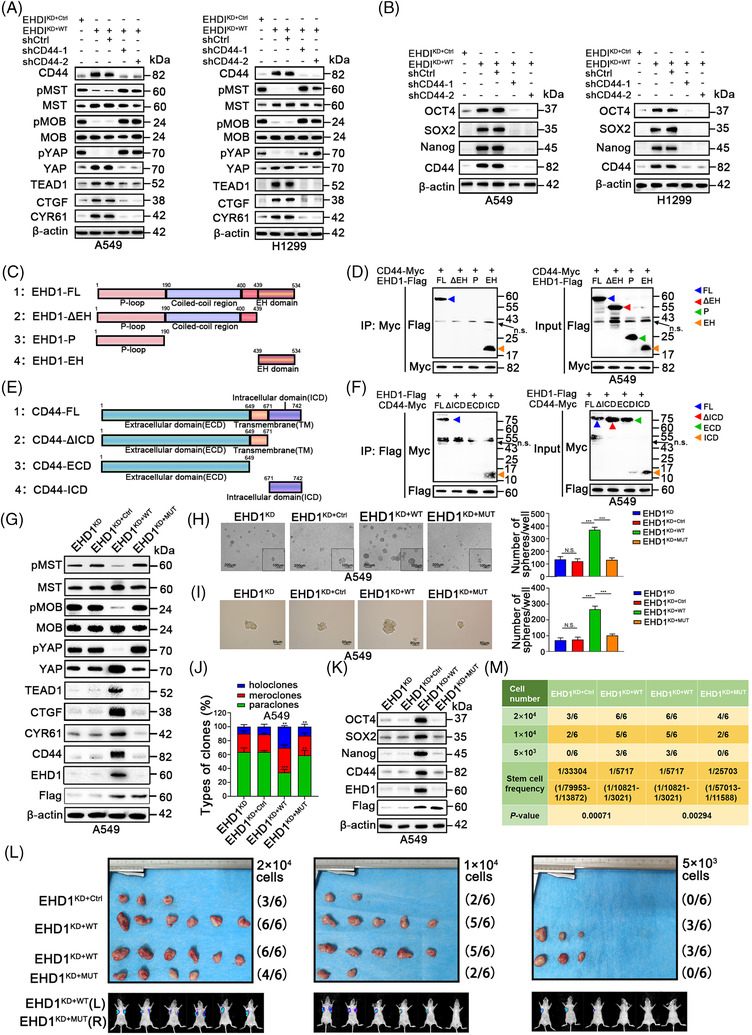
Methods: Cancer stem cells (CSCs)-like characteristics were evaluated by tumour limiting dilution assays, three-dimensional (3D) spheroid cancer models. Microarray analysis was used to identify the pathways significantly regulated by mammalian Eps15 homology domain protein 1 (EHD1) knockdown. Mass spectrometry (MS) was performed to identify EHD1-interacting proteins. The function of EHD1 as a regulator of cluster of differentiation 44 (CD44) endocytic recycling and lysosomal degradation was determined by CD44 biotinylation and recycling assays.

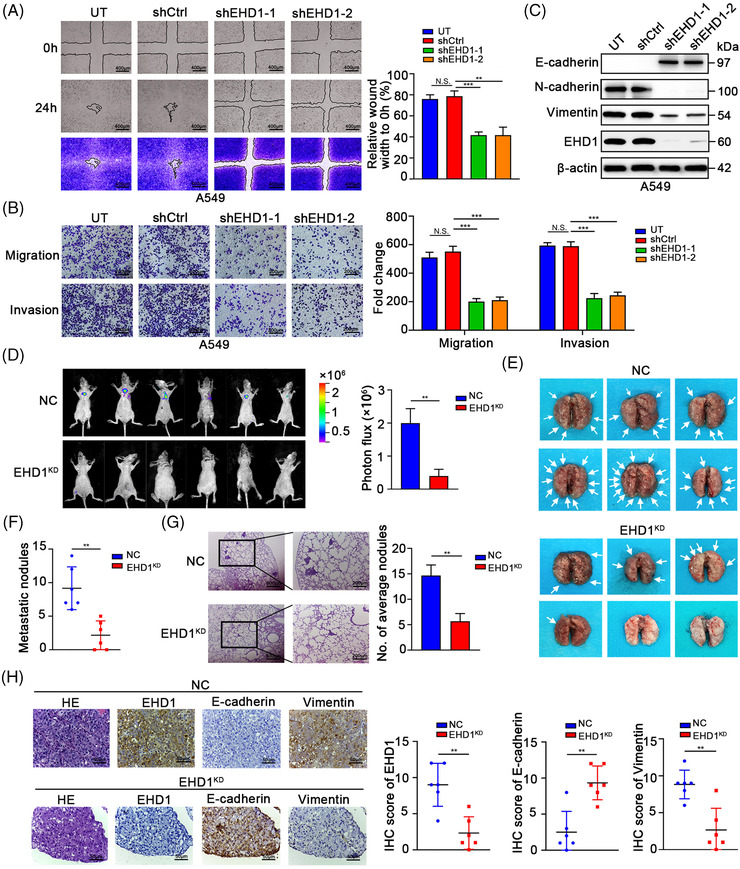
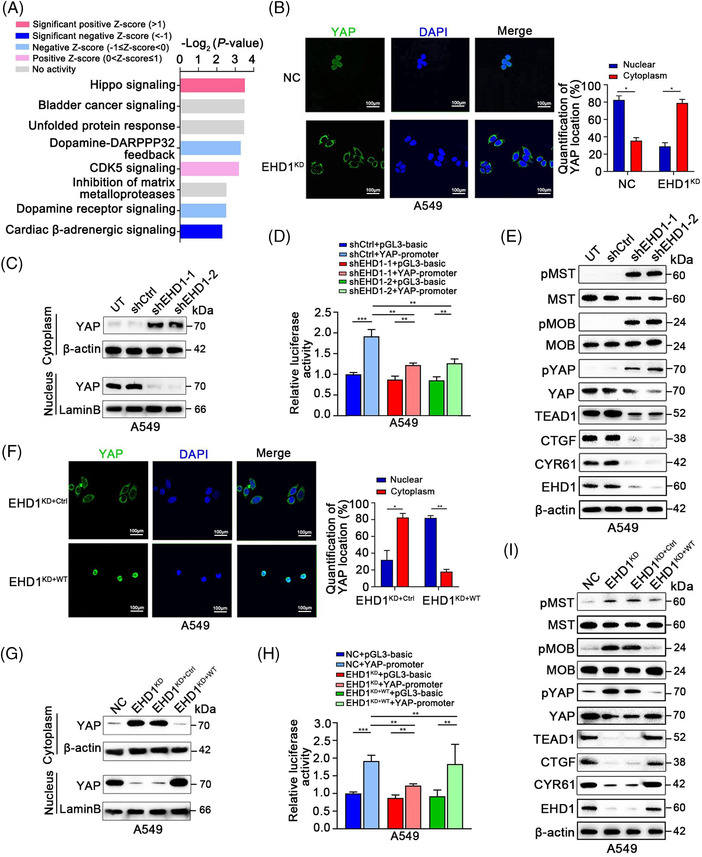
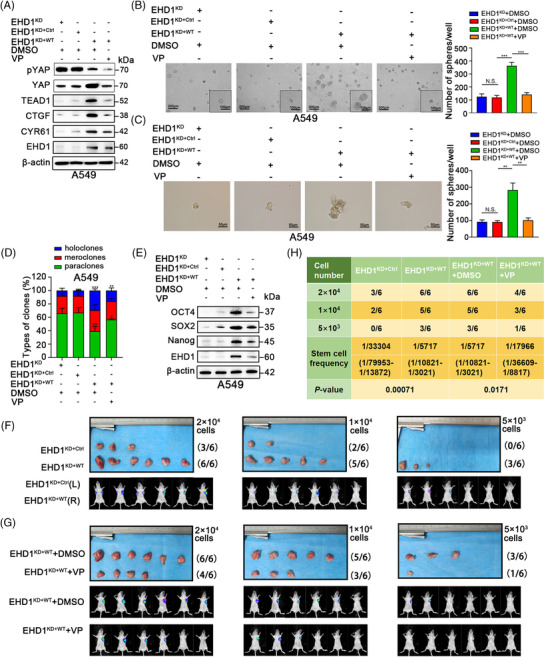
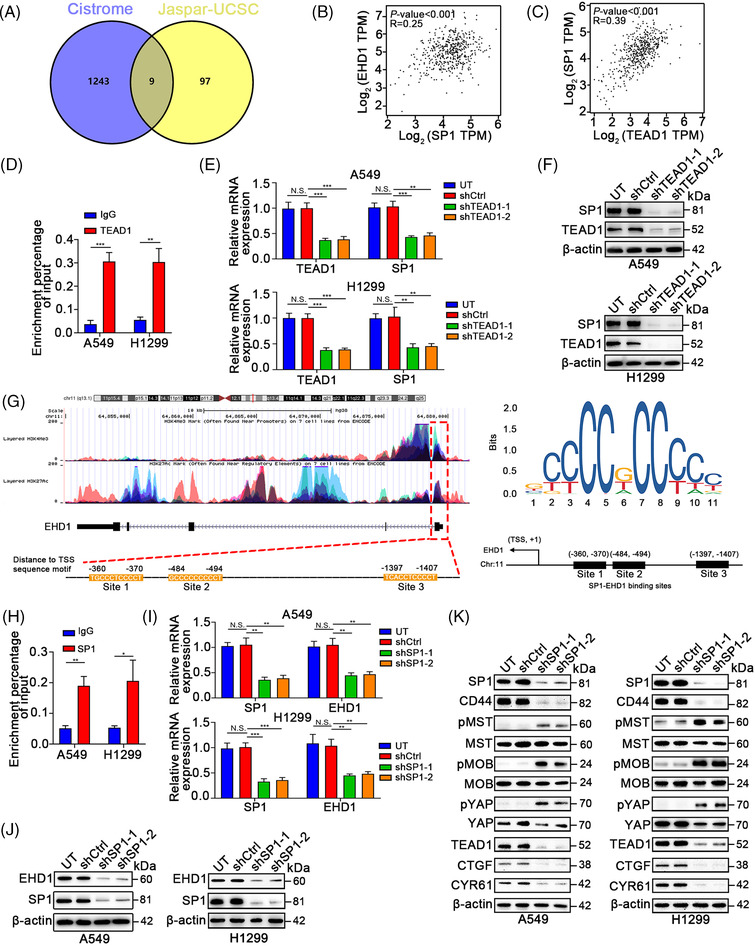
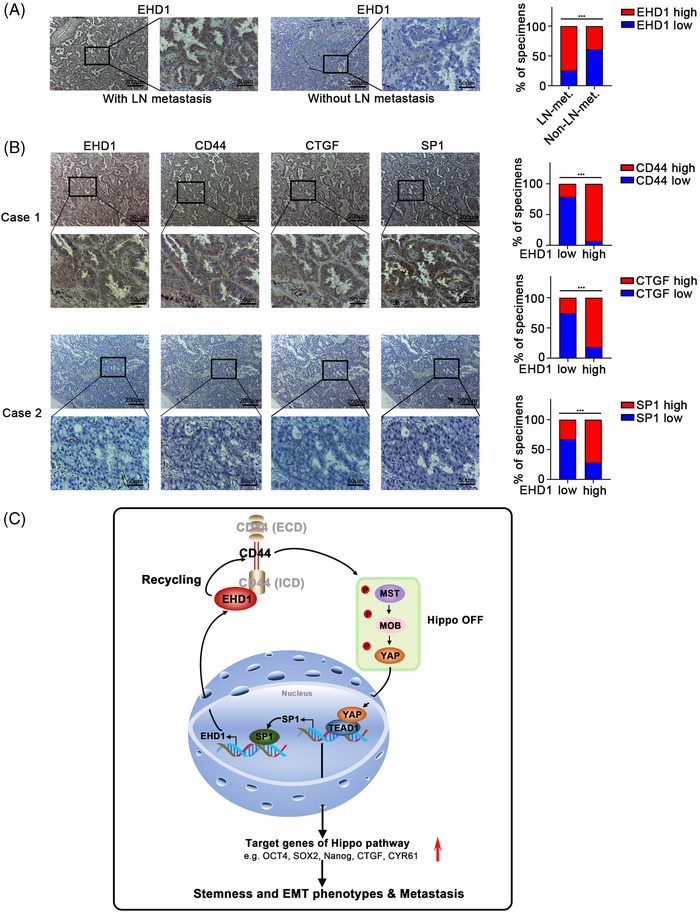
Results: EHD1 was identified as a significant EMG. Knockdown of EHD1 suppressed CSCs-like characteristics, epithelial-mesenchymal transition (EMT), migration and invasion of lung adenocarcinoma (LUAD) cells by increasing Hippo kinase cascade activation. Conversely, EHD1 overexpression inhibited the Hippo pathway to promote cancer stemness and metastasis. Notably, utilising MS analysis, the CD44 protein was identified as a potential binding partner of EHD1. Furthermore, EHD1 enhanced CD44 recycling and stability. Indeed, silencing of CD44 or disruption of the EHD1/CD44 interaction enhanced Hippo pathway activity and reduced CSCs-like traits, EMT and metastasis. Interestingly, specificity protein 1 (SP1), a known downstream target gene of the Hippo-TEA-domain family members 1 (TEAD1) pathway, was found to directly bind to the EHD1 promoter region and induce its expression. Among clinical specimens, the EHD1 expression level in LUAD tissues of metastatic patients was higher than that of non-metastatic patients.

Conclusions: Our findings emphasise that EHD1 might be a potent anti-metastatic target and present a novel regulatory mechanism by which the EHD1/CD44/Hippo/SP1 positive feedback circuit plays pivotal roles in coupling modules of CSCs-like properties and EMT in LUAD. Targeting this loop may serve as a remedy for patients with advanced metastatic LUAD.

Keywords: EHD1; LUAD; hippo signalling pathway; metastasis; stemness.


Figures

FIGURE 1
FIGURE 1
Identification of EMGs in LUAD. (A) A volcano plot indicating upregulated (red dots) and downregulated (green dots) genes in the LUAD tissues of patients with bone metastasis compared with those without bone metastasis. Black dotted lines represent a cut‐off range of 2.0‐fold and p < .01. (B) A volcano plot showing 4 upregulated (red dots) genes associated with endocytosis in the LUAD tissues of the patients with bone metastasis compared with those without bone metastasis. Black dotted lines represent a cut‐off range of 2.0‐fold and p < .01. VPS37A, EHD1, GRK5 and VPS4A were identified as the candidate EMGs. (C) Kaplan–Meier curves for the overall survival of patients with LUAD according to the expression levels of the candidate EMGs. HR, hazard ratio; CI, confidence interval. (D and E) The effects of EHD1 knockdown in A549 cell lines were examined by qRT‐PCR and Western blot analysis. (F–H) The effect of EHD1 depletion on the stemness of A549 cells was determined in vitro. (F) 3D spheroid assays using semisolid medium, (G) 3D spheroid assays using serum‐free medium and (H) holoclone assays showed the CSCs‐like traits of A549 cells. (I) The expression of stemness‐related markers in A549 cells. (J) Flow cytometric analysis of CD133‐ and CD44‐positive cells. (K) In the in vitro limiting dilution assays, the numbers of wells in 96‐well plates that contained tumour spheres were determined (upper panel). The stemness of A549 cells with or without EHD1 knockdown was estimated as the stem cell frequency (bottom panel). The data are shown as the mean ± standard deviation (SD) values. p > .05 was considered not significant (N.S.), *p < .05, **p < .01 and ***p < .001
FIGURE 2
FIGURE 2
Knockdown of EHD1 inhibits the metastasis of LUAD cells. (A) Representative image of the wound healing assay showing the effect of EHD1 knockdown on the migration ability and motility of A549 cells. The quantitative and statistical analyses based on the area of the wound indicated the cell migration ability and cell motility. (B) The Transwell assay showing the effects of EHD1 knockdown on the migration and invasion of A549 cells. (C) The expression of EMT‐related markers in A549 cells after EHD1 knockdown. (D) The images show the bioluminescence signal intensities in each BALB/c nude mouse on day 70 after tail vein injection of NC or EHD1KD cells (left panel). The bar charts show the results of quantitative and statistical analyses of the bioluminescence signal intensities in the NC and EHD1KD groups (right panel). (E) Pulmonary metastases in nude mice after tail vein injection of NC or EHD1KD. The white arrows indicate lung metastatic foci. (F) Number of metastatic nodules in the lungs of nude mice in the NC and EHD1KD groups. (G) Representative H&E staining images of lung tissues from nude mice injected with NC or EHD1KD (left panel). The numbers of spontaneous lung metastatic nodules in mice were quantified (right panel). (H) Representative images of H&E staining and IHC staining for EHD1 and EMT‐related proteins in metastatic lung tissues formed by NC or EHD1KD (left panel). The bar charts show the results of quantitative and statistical analyses of IHC assays (right panel). The data are shown as the mean ± SD values. p > .05 was considered N.S., **p < .01 and ***p < .001
FIGURE 3
FIGURE 3
EHD1 inhibits Hippo signalling activation. (A) ‘Canonical pathway analysis’ in IPA software was used to summarise the enrichment of differentially expressed genes between NC and EHD1KD. All signalling pathways were ranked by Log2 (p value). (B) Representative IF images showing the localisation of YAP in NC and EHD1KD (left panel). Green indicates YAP IF staining; blue indicates DAPI staining. The bar graphs show the statistical analysis of YAP localisation in A549 cells (right panel). (C) The expression levels of YAP in the cytoplasm and nucleus were determined by subcellular fractionation assays in NC and EHD1KD. β‐actin was used as the control for cytoplasmic expression, while Lamin B was used as the control for nuclear expression. (D) Luciferase reporter assays showing YAP transcriptional activity in NC and EHD1KD transfected with the empty vector or YAP plasmid. (E) Protein expression levels of core Hippo signalling pathway components in A549 cells. (F) Representative IF images validating the localisation of YAP in A549 cells with or without EHD1 overexpression (left). Bar graphs showing the statistical analysis of YAP localisation in A549 cells (right). (G) The expression levels of YAP in the cytoplasm and nucleus of A549 cells with or without EHD1 restoration were determined by subcellular fractionation assays. β‐actin was used as the control for cytoplasmic expression, while Lamin B was used as the control for nuclear expression. (H) A luciferase reporter assay was performed to determine YAP transcriptional activity in A549 cells with or without EHD1 restoration that were transfected with the empty vector or YAP plasmid. (I) The expression of core components and downstream targets of the Hippo signalling pathway was detected by Western blotting. The data are shown as the mean ± SD values. *p < .05, **p < .01 and ***p < .001
FIGURE 4
FIGURE 4
Hippo signalling is essential for EHD1‐mediated enhancement of stemness in vitro and in vivo. (A) Western blot analysis validated the effect of treatment with VP (1 μM) or DMSO for 24 h on the Hippo signalling pathway in the EHD1KD+WT group. The expression of core components and downstream targets of the Hippo signalling pathway was detected. (B‐C) The 3D spheroid cancer models detected the effect of VP treatment on stemness in the EHD1KD+WT group. The bar graphs show the quantification of the number of spheres per well formed by A549‐derived cells. (D) The stemness of A549 cells treated with DMSO or VP was evaluated by clonal heterogeneity analysis. (E) Expression of stemness‐related proteins in A549‐derived cells treated with DMSO or VP. (F‐H) Hippo signalling is critical for the EHD1‐mediated enhancement of A549 cell stemness in vivo. (F) Photographs showing the efficiency of tumour generation or tumoursphere formation in nude mice (upper panels). The panels below the images show the bioluminescence signal intensities in nude mice injected subcutaneously with EHD1KD+Ctrl (left) or EHD1KD+WT (right). (G) Images showing the efficiency of tumour generation or tumoursphere formation in nude mice treated with DMSO or VP (upper panels). Bioluminescence signal intensities in nude mice injected subcutaneously with EHD1KD+WT and treated with DMSO or VP are shown (lower panels). (H) The stemness of A549 cells was estimated as the stem cell frequency, with upper and lower 95% confidence intervals. The tumour engraftment efficiency in vivo was successfully reduced by VP treatment. The data are shown as the mean ± SD values. p > .05 was considered N.S., *p < .05, **p < .01 and ***p < .001
FIGURE 5
FIGURE 5
EHD1 interacts with CD44 and enhances its recycling, thus preventing its lysosomal degradation. (A) Amino acid sequences of peptides specifically associated with the EHD1 protein (top) or CD44 protein (bottom) were identified using MS. (B) IF staining was used to detect the colocalisation of EHD1 and CD44 in LUAD cells. Endogenous (C and D) and exogenous (E) IP experiments validated the interaction of EHD1 and CD44. (F) Western blot analysis was performed to examine the effect of EHD1 knockdown on the regulation of CD44 protein expression. (G) The MFI of relative surface CD44 was determined by FACS. Representative flow cytometry data and statistical analysis of cell surface CD44 in A549 (left) and H1299 cells (right) are shown. The relative surface level is related to the amount of the receptor that undergoes ligand fixation, stimulation, internalisation and recycling to the cell surface. (H) The biotinylation and recycling assay of CD44 by ELISA showed CD44 recycling in NC and EHD1KD A549 cells. (I) A CHX chase assay was performed to analyse the half‐life of the CD44 protein in NC and EHD1KD A549 cells. Cells were incubated in the presence of CHX (20 μg/ml) for 0, 1, 2, 3 or 4 h. (J) Western blot analysis of CD44 expression in NC and EHD1KD treated with the proteasome inhibitor MG132 for 8 h. (K) Western blot analysis of CD44 expression in NC and EHD1KD cells treated with NH4Cl, an inhibitor of the lysosomal pathway, for 8 h. (L) CD44 ubiquitination assays in LUAD cells transfected with the Total‐Ub, K63‐Ub or K48‐Ub plasmid after treatment with NH4Cl for 8 h. The data are shown as the mean ± SD values. *p < .05, **p < .01 and ***p < .001
FIGURE 6
FIGURE 6
Disruption of the EHD1/CD44 interaction activates the Hippo signalling and attenuates the stemness and metastasis of A549 cells. (A) Expression of core components and downstream targets of the Hippo signalling pathway in LUAD cells. (B) Expression of stemness‐related markers after CD44 knockdown in LUAD cells. (C) Schematic diagram showing the structures of the full‐length EHD1 and deletion constructs used. (D) Flag‐tagged full‐length EHD1 (EHD1‐FL) or EHD1 deletion mutants and Myc‐tagged CD44 were co‐expressed in A549 cells. Extracts were subjected to IP with an anti‐Myc antibody, and bound EHD1 was analysed by Western blotting using an anti‐Flag antibody. n.s.: non‐specific band. (E) Schematic diagram showing the structures of the full‐length CD44 and deletion constructs applied. (F) Myc‐tagged full‐length CD44 (CD44‐FL) or CD44 deletion mutants and EHD1‐Flag were co‐expressed in A549 cells. Extracts were subjected to IP with an anti‐Flag antibody, and bound Myc was analysed by Western blotting using an anti‐Myc antibody. n.s.: non‐specific band. (G) Western blot analysis of the effect of disrupting the EHD1/CD44 interaction on the expression of the core components and downstream molecules of the Hippo signalling pathway. (H and I) The effect of disrupting the EHD1/CD44 interaction on the stemness of A549 cells, as indicated by 3D spheroid cancer models. (J) Holoclone assays showing the effect of disrupting the EHD1/CD44 interaction on stemness. (K) Expression of stemness‐related proteins in A549‐derived cells. (L) Photographs showing the efficiency of tumour generation or tumoursphere formation in nude mice (upper panels). The panels below the images show the bioluminescence signal intensities in nude mice subcutaneously injected with EHD1KD+Ctrl (left) or EHD1KD+WT (right) and nude mice subcutaneously injected with EHD1KD+WT (left) or EHD1KD+MUT (right). (M) The stemness of A549‐derived cells in vivo was estimated as the stem cell frequency, with the upper and lower 95% confidence intervals. The data are shown as the mean ± SD values. p > .05 was considered N.S., *p < .05, **p < .01 and ***p < .001
FIGURE 7
FIGURE 7
EHD1 promotes metastasis through the CD44/Hippo axis in vivo. (A) Bioluminescence images were acquired at the indicated time points. (B) Bar charts showing the results of quantitative and statistical analyses of bioluminescence in lung metastatic foci in all groups. The number of metastatic foci is shown as the mean ± SD; n = 6 mice per group. (C) Images of the lungs of nude mice in the groups. The white arrows indicate lung metastatic foci. (D) Statistical analysis of the weights of nude mice in all groups. (E) Statistical analysis of the numbers of metastatic nodules in the indicated lung tissues of nude mice. (F) Representative images of H&E staining and IHC staining for EHD1, E‐cadherin, Vimentin, CD44 and CYR61 in lung tissues from nude mice in all groups (upper panel); The bar charts show the results of quantitative and statistical analyses of the IHC assays (lower panel). The data are shown as the mean ± SD values. p > .05 was considered N.S., *p < .05 and **p < .01
FIGURE 8
FIGURE 8
SP1 promotes the transcription of EHD1. (A) Venn diagram showing the overlapping targets transcriptionally regulated by TEAD1 and the TFs of EHD1 identified in JASPAR (http://jaspar.genereg.net), the UCSC Genome Browser (https://genome.ucsc.edu/) and Cistrome Data Browser (http://cistrome.org/db/#/). (B) The correlation between SP1 and EHD1 mRNA expression was analysed on the GEPIA website (http://gepia.cancer‐pku.cn/). (C) The correlation between TEAD1 and SP1 mRNA expression was analysed on the GEPIA website. (D) ChIP‐PCR validated the binding of TEAD1 in the SP1 promoter. The regulation of TEAD1 knockdown on SP1 expression which was assessed by qRT‐PCR (E) and Western blotting (F). (G) The UCSC Genome Browser website showed that aberrant histone modifications were highly enriched at the promoter of EHD1, which accounted for its efficient activation. The SP1 binding motif and three potential SP1‐specific NBSs were predicted to exist in the promoter region of the EHD1 gene by the JASPAR database. (H) qRT‐PCR analysis of the ChIP products validated the binding ability of SP1 to the EHD1 promoter. (I) The effect of SP1 knockdown on the transcription of EHD1 was assessed by qRT‐PCR. (J) The effect of SP1 knockdown on the EHD1 protein level was estimated by Western blotting. (K) The effects of SP1 knockdown on CD44 expression and Hippo signalling pathway activity were assessed by Western blotting. The data are shown as the mean ± SD values. p > .05 was considered N.S., *p < .05, **p < .01 and ***p < .001
FIGURE 9
FIGURE 9
Associations among EHD1, CD44, CTGF and SP1 expression in LUAD specimens. (A) Representative immunostaining profiles of EHD1 expression in LUAD tissues of the patients with lymph node metastasis (n = 58) and in LUAD tissues of the patients without lymph node metastasis (n = 55, left panel). The bar graphs show the statistical analysis of EHD1 expression in these two groups (right panel). The data are shown as the mean ± SD values. ***p < .001. (B) Representative images of immunohistochemical staining for EHD1, CD44, CTGF and SP1 in serial sections of LUAD samples from patients. Case 1 is representative of a LUAD patient with high EHD1 expression, whereas Case 2 is representative of a LUAD patient with low EHD1 expression. The bar graphs show that EHD1 expression determined by IHC was associated with CD44, CTGF or SP1 expression in 113 clinical LUAD specimens. The data are shown as the mean ± SD values. ***p < .001. (C) Schematic representation of the EHD1/CD44/Hippo/SP1 positive feedback loop in metastatic LUAD. EHD1 can interact with the CD44‐ICD, promoting CD44 recycling and upregulating CD44 protein expression. Subsequently, CD44 upregulation inhibits Hippo signalling activity, leading to nuclear entry of dephosphorylated YAP as well as a subsequent increase in the expression of downstream gene targets (i.e. OCT4, SOX2, Nanog, CTGF and CYR61, which are related to stemness and/or EMT). Thus, EHD1 antagonises the Hippo pathway to enhance the CSCs‐like properties, EMT and metastasis of LUAD cells. Moreover, SP1, as a downstream target of Hippo signalling, in turn transcriptionally activates EHD1 expression, finally forming a positive feedback loop that drives LUAD metastasis

Similar articles

Cited by

References

    1. Sung H, Ferlay J, Siegel RL, et al. Global Cancer Statistics 2020: GLOBOCAN estimates of incidence and mortality worldwide for 36 cancers in 185 countries. CA Cancer J Clin. 2021;71(3):209‐249. - PubMed
    1. Siegel RL, Miller KD, Fuchs HE, Jemal A. Cancer Statistics, 2021. CA Cancer J Clin. 2021;71(1):7‐33. - PubMed
    1. Siegel RL, Miller KD, Jemal A. Cancer statistics, 2016. CA Cancer J Clin. 2016;66(1):7‐30. - PubMed
    1. Lortet‐Tieulent J, Soerjomataram I, Ferlay J, Rutherford M, Weiderpass E, Bray F. International trends in lung cancer incidence by histological subtype: adenocarcinoma stabilizing in men but still increasing in women. Lung Cancer. 2014;84(1):13‐22. - PubMed
    1. Travis WD, Brambilla E, Nicholson AG, et al. The 2015 World Health Organization classification of lung tumors: impact of genetic, clinical and radiologic advances since the 2004 classification. J Thorac Oncol. 2015;10(9):1243‐1260. - PubMed

Publication types