. 2022 May 3;39(5):msac080.
doi: 10.1093/molbev/msac080.

Dynamics and Impacts of Transposable Element Proliferation in the Drosophila nasuta Species Group Radiation

Affiliations

Dynamics and Impacts of Transposable Element Proliferation in the Drosophila nasuta Species Group Radiation

Kevin H-C Wei et al. Mol Biol Evol. .

Abstract

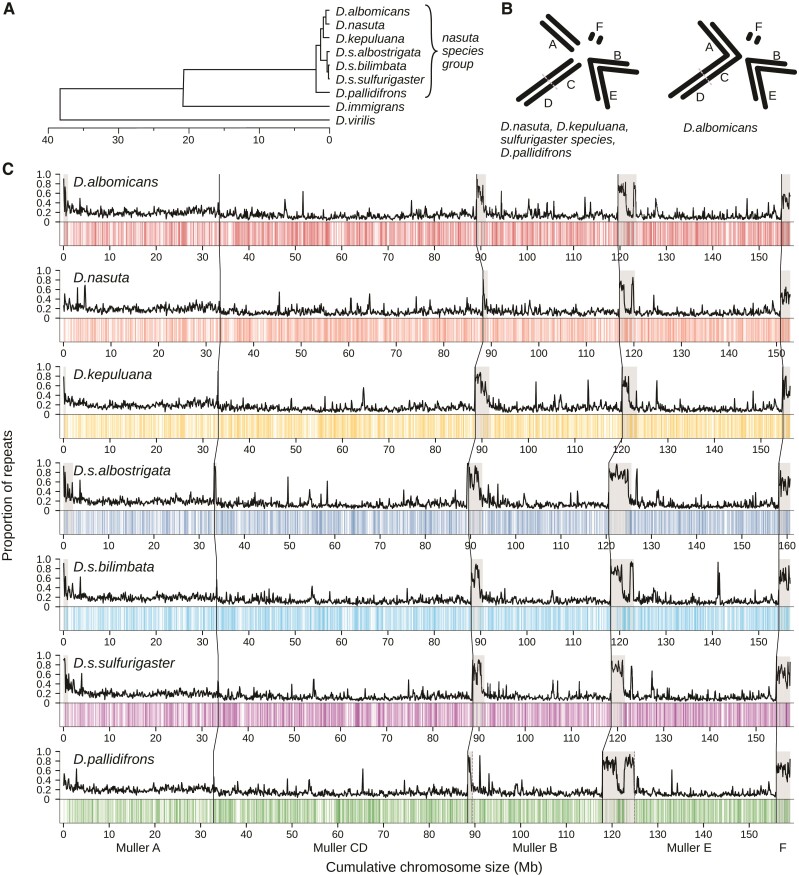
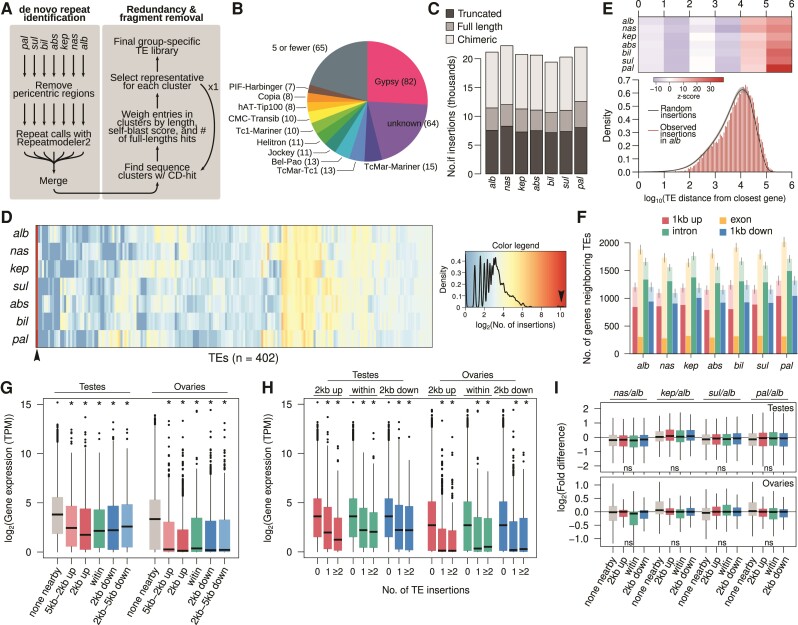
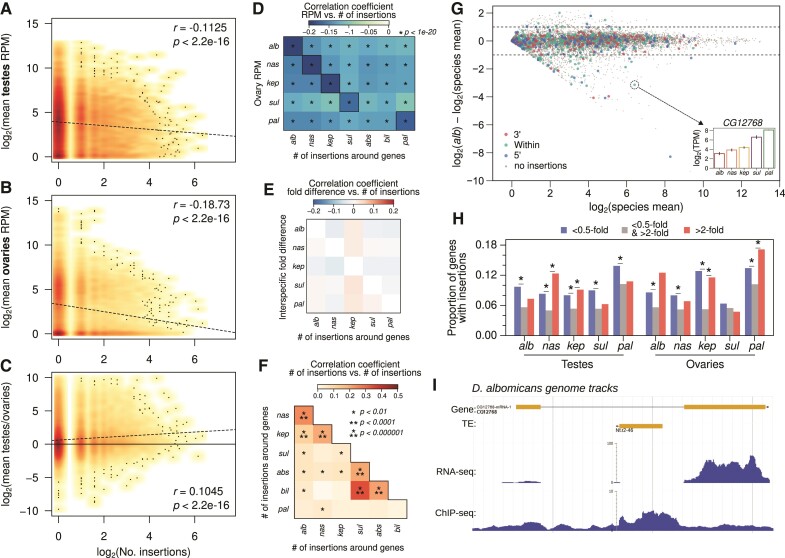
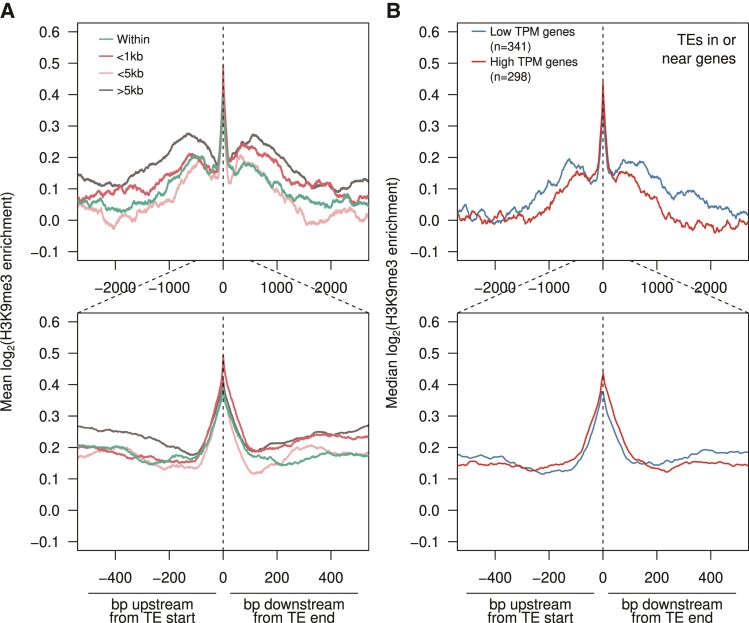
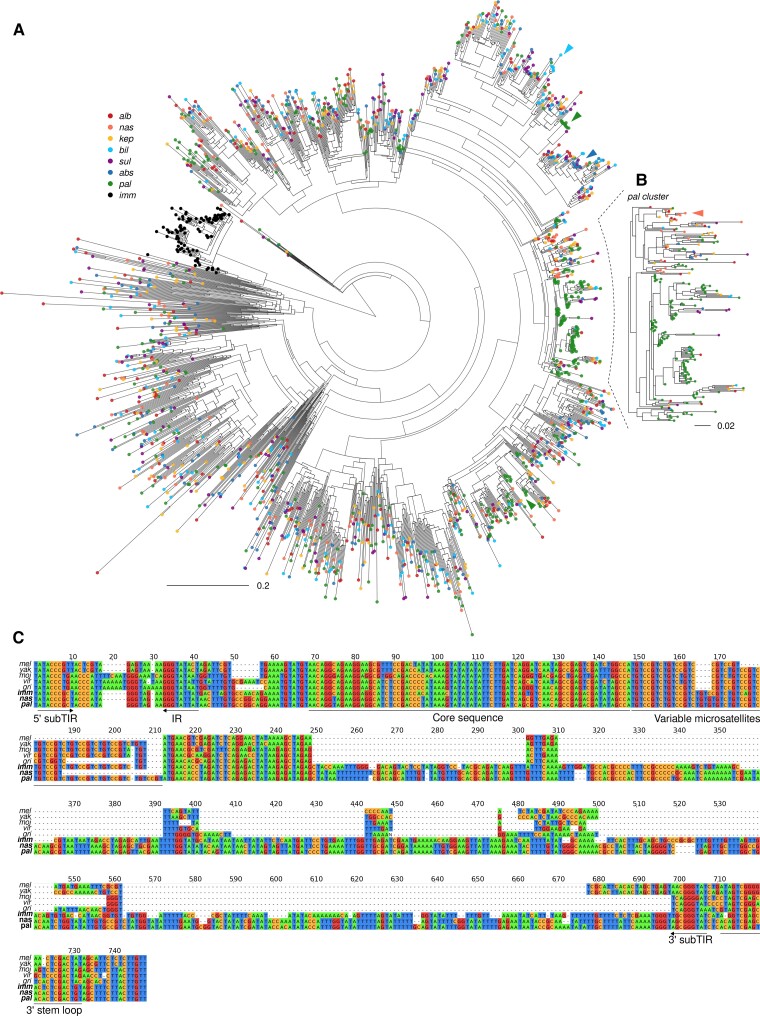
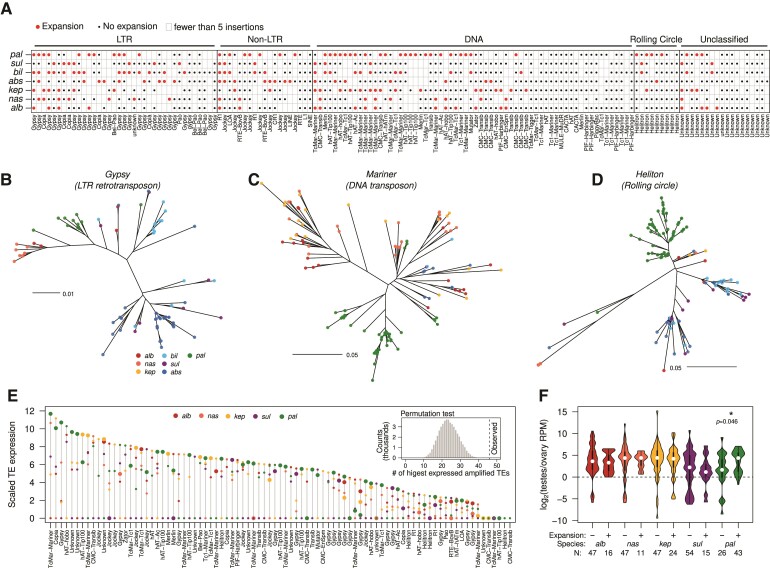
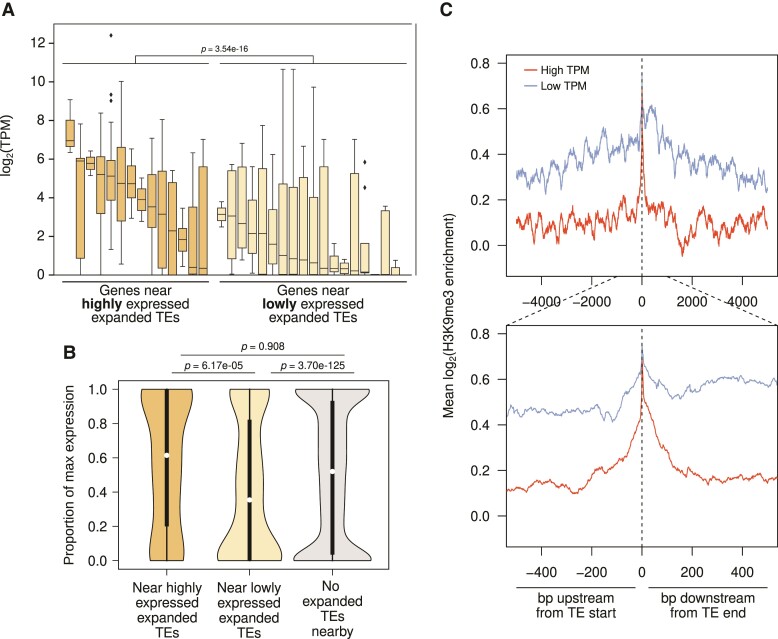
Transposable element (TE) mobilization is a constant threat to genome integrity. Eukaryotic organisms have evolved robust defensive mechanisms to suppress their activity, yet TEs can escape suppression and proliferate, creating strong selective pressure for host defense to adapt. This genomic conflict fuels a never-ending arms race that drives the rapid evolution of TEs and recurrent positive selection of genes involved in host defense; the latter has been shown to contribute to postzygotic hybrid incompatibility. However, how TE proliferation impacts genome and regulatory divergence remains poorly understood. Here, we report the highly complete and contiguous (N50 = 33.8-38.0 Mb) genome assemblies of seven closely related Drosophila species that belong to the nasuta species group-a poorly studied group of flies that radiated in the last 2 My. We constructed a high-quality de novo TE library and gathered germline RNA-seq data, which allowed us to comprehensively annotate and compare TE insertion patterns between the species, and infer the evolutionary forces controlling their spread. We find a strong negative association between TE insertion frequency and expression of genes nearby; this likely reflects survivor bias from reduced fitness impact of TEs inserting near lowly expressed, nonessential genes, with limited TE-induced epigenetic silencing. Phylogenetic analyses of insertions of 147 TE families reveal that 53% of them show recent amplification in at least one species. The most highly amplified TE is a nonautonomous DNA element (Drosophila INterspersed Element; DINE) which has gone through multiple bouts of expansions with thousands of full-length copies littered throughout each genome. Across all TEs, we find that TEs expansions are significantly associated with high expression in the expanded species consistent with suppression escape. Thus, whereas horizontal transfer followed by the invasion of a naïve genome has been highlighted to explain the long-term survival of TEs, our analysis suggests that evasion of host suppression of resident TEs is a major strategy to persist over evolutionary times. Altogether, our results shed light on the heterogenous and context-dependent nature in which TEs affect gene regulation and the dynamics of rampant TE proliferation amidst a recently radiated species group.

Keywords: Drosophila; epigenetic suppression; transposable elements.


Figures

Fig. 1.
Fig. 1.
Genomes of the Drosophila nasuta species group. (A) Phylogeny of the nasuta species radiation within the Drosophila subgenus. Tree adapted from Mai et al. (2020) and Izumitani et al. (2016). (B) Karyotypes of the species group; chromosomes are oriented such that centromeres are pointed toward the center of circle. (C) Long-read-based genome assemblies of seven species. For each species, the top track depicts the repeat content estimated for 100 kb windows. Positions of annotate genes are represented on the bottom track as vertical lines. The centromeric ends are on the left side of each chromosome. Regions deemed as pericentromeric are highlighted in gray. Chromosomes are demarcated by black vertical lines. Unless otherwise stated, species are represented by colors used here: red (D. albomicans), orange (D. nasuta), yellow (D. kepuluana), navy (D. s. albostrigata), light blue (D. s. bilimbata), purple (D. s. sulfurigaster), and green (D. pallidifrons).
Fig. 2.
Fig. 2.
De novo identification and distribution of TE insertions across the genomes. (A) Pipeline to construct and refinea de novo TE reference library from genome assemblies. We used RepeatModeler2 to first identify repeats from the euchromatic regions of each species. The resulting repeat libraries are merged followed by sequence clustering with CD-HIT2. Multiple indexes were used to select the full-length representative TEs. (B) Breakdown of TE classes identified; for breakdown of the gray section see supplementary fig. S9, Supplementary Material online. (C) Number of full length and truncated insertions found in each genome. The chimeric class represents the merger of annotations that overlap or are contiguous. (D) Copy number of full-length insertions of 318 TE families across the seven genomes. (E) Distribution of the distance between genes and TEs in Drosophila albomicans (red histogram) compared with that from random TE insertions (black contour with 95% confidence interval denoted by gray). See supplementary fig. S10, Supplementary Material online for other species. The z-score between the random expectation and observed counts at different intervals are shown above for different size categories with lower and high z-score representing depletion and enrichment. Insertions within genes are not counted. See supplementary fig. S9, Supplementary Material online for distribution of intragenic insertions from exons. (F) Number of genes with TEs inserted in different regions of genes with and without insertions. Expectations from random distribution of insertions are shown in lighter bars with error bars demarcating 95% confidence intervals. (G) Transcript abundance of annotated genes in TPM, partitioned into different classes depending on where TE insertions are found. (H) Transcript abundance of genes with different numbers of TE insertions. (I) Fold-difference in transcript abundance of orthologous genes depending on different numbers of insertions in D. albomicans. For (GI), “*” represents significant Wilcoxon rank sum tests (P < 0.00001) comparing categories with insertions to the 0-insertion categories. See supplementary fig. S10, Supplementary Material online, for comparisons using insertions in other species.
Fig. 3.
Fig. 3.
Negative association between TE insertions and genic expression. (A and B) Density scatterplots of number of unique (both full length and truncated) TE insertions around genes (±2 kb) across all the nasuta species genomes plotted against genic transcript abundances (averaged across the species) in the ovaries (A) and testes (B). Increased intensity of warm colors indicates higher density of points. Scattered black dots indicate positions of single points. Regression lines are depicted by dotted lines; the Pearson’s correlation coefficients and corresponding P-values are labeled in the top right. (C) Same as A and B, but with the fold difference of genic expression between testes and ovaries. (D) Pairwise correlation of TE insertion counts around genes in a particular species to the ovarian transcript abundance of the gene orthologs in another species. (E) Pairwise correlation of TE insertion counts around orthologous genes across species; genes with no insertions in either species are not used. (G) MA-plot of average gene expression (TPM) across species in the testes (x-axis) plotted against fold difference between the Drosophila albomicans expression and the average across species (y-axis). Colored points represent genes with TE insertions in different parts of the gene. Horizontal dotted line demarcates 0.5- and 2-fold differences. Inset shows the testes expression of the CG12768 gene across all five species. For MA-plots in ovaries and other species, see supplementary fig. S14, Supplementary Material online. (H) Proportions of genes with TE insertions grouped by expression levels; genes in each species are partitioned depending on their testis and ovary expression levels relative the species average (i.e., genes below or above the dotted lines in panel G), for each species and in ovaries and testes. (I) Genome browser shot of CG12768 showing tracks for gene structure, TE insertions, transcript abundance, and H3K9me3 enrichment. For genome browser shot of this gene in other species see supplementary fig. S15, Supplementary Material online.
Fig.4.
Fig.4.
Epigenetic silencing through H3K9me3 spreading around TE insertions. (A) Median H3K9me3 enrichment ± 5 kb upstream and downstream of TEs inserted at different distances to genes (enrichment across TE insertions not plotted). TE insertions within pericentric regions are removed from analyses. Zoomed in plot (±500 bp) is shown below. (B) As with A but with TEs inserted within genes or <2 kb around genes of different expression levels.
Fig. 5.
Fig. 5.
Recurrent DINE expansions. (A) Radial tree of subsampled DINE insertions with the addition of Drosophila immigrans DINE elements as outgroup. Insertions from the same species have the same colored tips. Colored arrowheads point to small scale species-specific expansions on the tree. (B) Large cluster of D. pallidifrons DINE insertions indicate recent burst of species-specific activity. (C) Multiple sequence alignments of consensus DINE sequences of representative species. DINE-specific sequence features are annotated beneath the tracks.
Fig. 6.
Fig. 6.
Frequent lineage-specific amplifications and suppressions of TE families. (A) Species-specific expansion status of different TE families and types based on phylogenies of insertions. Red dots indicate amplification in a nasuta species, black dots indicate no amplification, and empty boxes indicate fewer than five insertions. (BD) Unrooted trees of TE insertions of different types of TEs. Their positions on the table in (A) are marked by arrowheads. (E) Expression of expanded and unexpanded TE families in the testes of different species. For each TE family, the transcript abundance is scaled by the lowest expressed species, and the range of expression across the different species is plotted vertically as demarcated by the gray line. Along this line, the expression in the different species is positioned by colored circles. Large circles denote species-specific expansion. The observed positions of the expanded TEs along the expression ranges are tested against the null expectation using randomized permutation testing (top right inset). The null distribution is presented and the observed count is marked by the vertical dotted line. (F) Fold-difference in TE transcript abundance between testes and ovarian expression across species. TEs are subdivided into those that have species-specific expansions and those without.
Fig. 7.
Fig. 7.
Epigenetic silencing of expanded TEs down-regulates nearby genes. (A) Expanded TEs are categorized as either highly or lowly expressed depending on expression differences between species. Dark yellow boxes represent genes nearby highly expressed expanded TEs, whereas light yellow boxes represent genes nearby lowly expressed expanded TEs. Each box represents the distribution of transcript abundances (TPM) of genes with nearby insertions of a given expanded TE family. Genes (n = 785) near lowly expressed expanded TEs have significantly lower expression (Wilcoxon’s rank sum test, P < 3.54e−16). (B) Scaled expression of genes near highly (dark yellow, n = 82) and lowly expressed expanded TEs (light yellow, n = 552), as well as those with no expanded TEs nearby (gray, n = 8705). Genic expression is scaled by the TPM of the highest expressed orthologs across all species. Significance of pairwise comparisons of the three sets is labeled above the figure. (C) H3K9me3 enrichment around full-length TE insertions in Drosophila albomicans depending on whether the TE is highly expressed as compared with other species (red) versus lowly expressed (blue). Insertions within the pericentric regions are removed.

Similar articles

Cited by

References

    1. Drosophila 12 Genomes Consortium . 2007. Evolution of genes and genomes on the Drosophila phylogeny. Nature 450:203–218. - PubMed
    1. Adams M, McBroome J, Maurer N, Pepper-Tunick E, Saremi NF, Green RE, Vollmers C, Corbett-Detig RB. 2020. One fly-one genome: chromosome-scale genome assembly of a single outbred Drosophila melanogaster. Nucleic Acids Res. 48:e75. - PMC - PubMed
    1. Altschul SF, Gish W, Miller W, Myers EW, Lipman DJ. 1990. Basic local alignment search tool. J Mol Biol. 215:403–410. - PubMed
    1. Anxolabéhère D, Kidwell MG, Periquet G. 1988. Molecular characteristics of diverse populations are consistent with the hypothesis of a recent invasion of Drosophila melanogaster by mobile P elements. Mol Biol Evol. 5:252–269. - PubMed
    1. Athma P, Peterson T. 1991. Ac induces homologous recombination at the maize P locus. Genetics 128:163–173. - PMC - PubMed

Publication types

Substances

LinkOut - more resources