Real-life evaluation of molecular multiplex IgE test methods in the diagnosis of pollen associated food allergy
- PMID: 35485989
- PMCID: PMC9790655
- DOI: 10.1111/all.15329
Real-life evaluation of molecular multiplex IgE test methods in the diagnosis of pollen associated food allergy
Abstract
Background: Diagnosis of food allergies is challenging, as combining information from specific IgE (sIgE)-sensitization pattern and skin prick tests (SPTs) with clinical history is necessary for a personalized management of allergic patients. The aim of this study was to compare two molecular tests, the ImmunoCAP ISAC (ISAC) and the Allergy Explorer, version 2 (ALEX2 ) in the context of pollen food syndrome (PFS) diagnosis in a real-life scenario, to assess the benefit of multiplex testing in PFS patients.
Methods: Diagnosis of food allergy was performed in 53 patients. Allergen-sIgE concentrations were measured with ISAC and ALEX2 . Results for sIgE were statistically compared with each other, with SPT results and with clinical presentation of the patients.
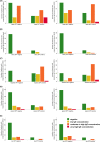
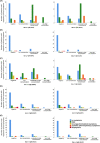
Results: Using ISAC as reference test for sIgE measurements, the average sensitivity of ALEX2 for PR-10 allergens was 83.2% and the average specificity 88.0%. If only low sIgE concentrations were included, the sensitivity was 60.8% and the specificity 91.1%. Apple and hazelnut sensitizations were confirmed in most patients by concordance of sIgE and SPT results. Significant correlations were shown between clinical symptoms and Mal d 1- and Gly m 4-sIgE levels measured by both tests and for Cor a 1-sIgE levels measured by ALEX2 . In eight patients, profilin related symptoms were supported by Hev b 8-sensitization.
Conclusion: Multiplex testing is beneficial to understand patient-specific individual sensitization profiles and to providing personalized management recommendations. In the future, custom-designed test kits might enable reducing costs of multiplex testing for specific patient groups without compromising the diagnostic value.
Keywords: food allergy; molecular diagnosis; multiplex testing; pollen food syndrome.
© 2022 The Authors. Allergy published by European Academy of Allergy and Clinical Immunology and John Wiley & Sons Ltd.
Conflict of interest statement
KB has received honoraria for talks and controlling webinar contents from ThermoFisher. The other authors have no other relevant affiliations or financial involvement with any organization or entity with a financial interest in or financial conflict with the subject matter or materials discussed in the manuscript apart from those disclosed.
Figures


References
-
- Hamilton RG, Hemmer W, Nopp A, Kleine‐Tebbe J. Advances in IgE testing for diagnosis of allergic disease. J Allergy Clin Immunol Pract. 2020;8(8):2495‐2504. - PubMed
-
- Persaud Y, Memon RJ, Savliwala MN. Allergy Immunotherapy, in StatPearls. StatPearls Publishing Copyright © 2021, StatPearls Publishing LLC; 2021. - PubMed
-
- Foong RX, Santos AF. Biomarkers of diagnosis and resolution of food allergy. Pediatr Allergy Immunol. 2021;32(2):223‐233. - PubMed
Publication types
MeSH terms
Substances
LinkOut - more resources
Full Text Sources
Medical
Research Materials

