. 2022 Jul 1;182(7):701-709.
doi: 10.1001/jamainternmed.2022.1827.

Comparison of Home Antigen Testing With RT-PCR and Viral Culture During the Course of SARS-CoV-2 Infection

Collaborators, Affiliations

Comparison of Home Antigen Testing With RT-PCR and Viral Culture During the Course of SARS-CoV-2 Infection

Victoria T Chu et al. JAMA Intern Med. .

Erratum in

  • Errors in Figure 2B.
    [No authors listed] [No authors listed] JAMA Intern Med. 2023 Jul 1;183(7):748. doi: 10.1001/jamainternmed.2023.1683. JAMA Intern Med. 2023. PMID: 37155163 Free PMC article. No abstract available.

Abstract

Importance: As self-collected home antigen tests become widely available, a better understanding of their performance during the course of SARS-CoV-2 infection is needed.

Objective: To evaluate the diagnostic performance of home antigen tests compared with reverse transcription-polymerase chain reaction (RT-PCR) and viral culture by days from illness onset, as well as user acceptability.

Design, setting, and participants: This prospective cohort study was conducted from January to May 2021 in San Diego County, California, and metropolitan Denver, Colorado. The convenience sample included adults and children with RT-PCR-confirmed infection who used self-collected home antigen tests for 15 days and underwent at least 1 nasopharyngeal swab for RT-PCR, viral culture, and sequencing.

Exposures: SARS-CoV-2 infection.

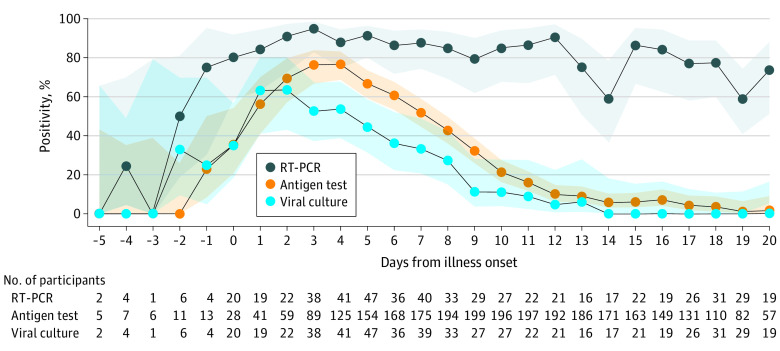
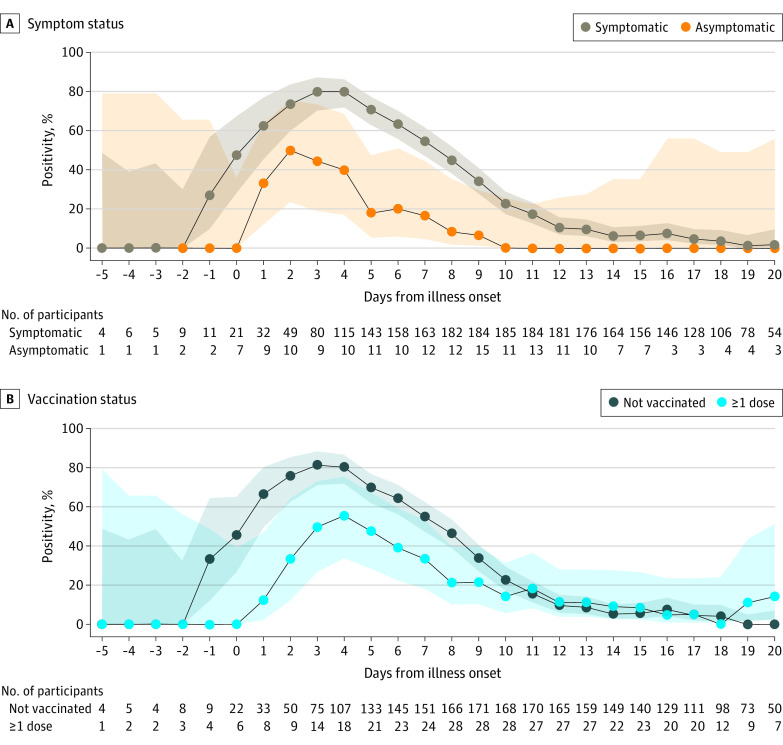
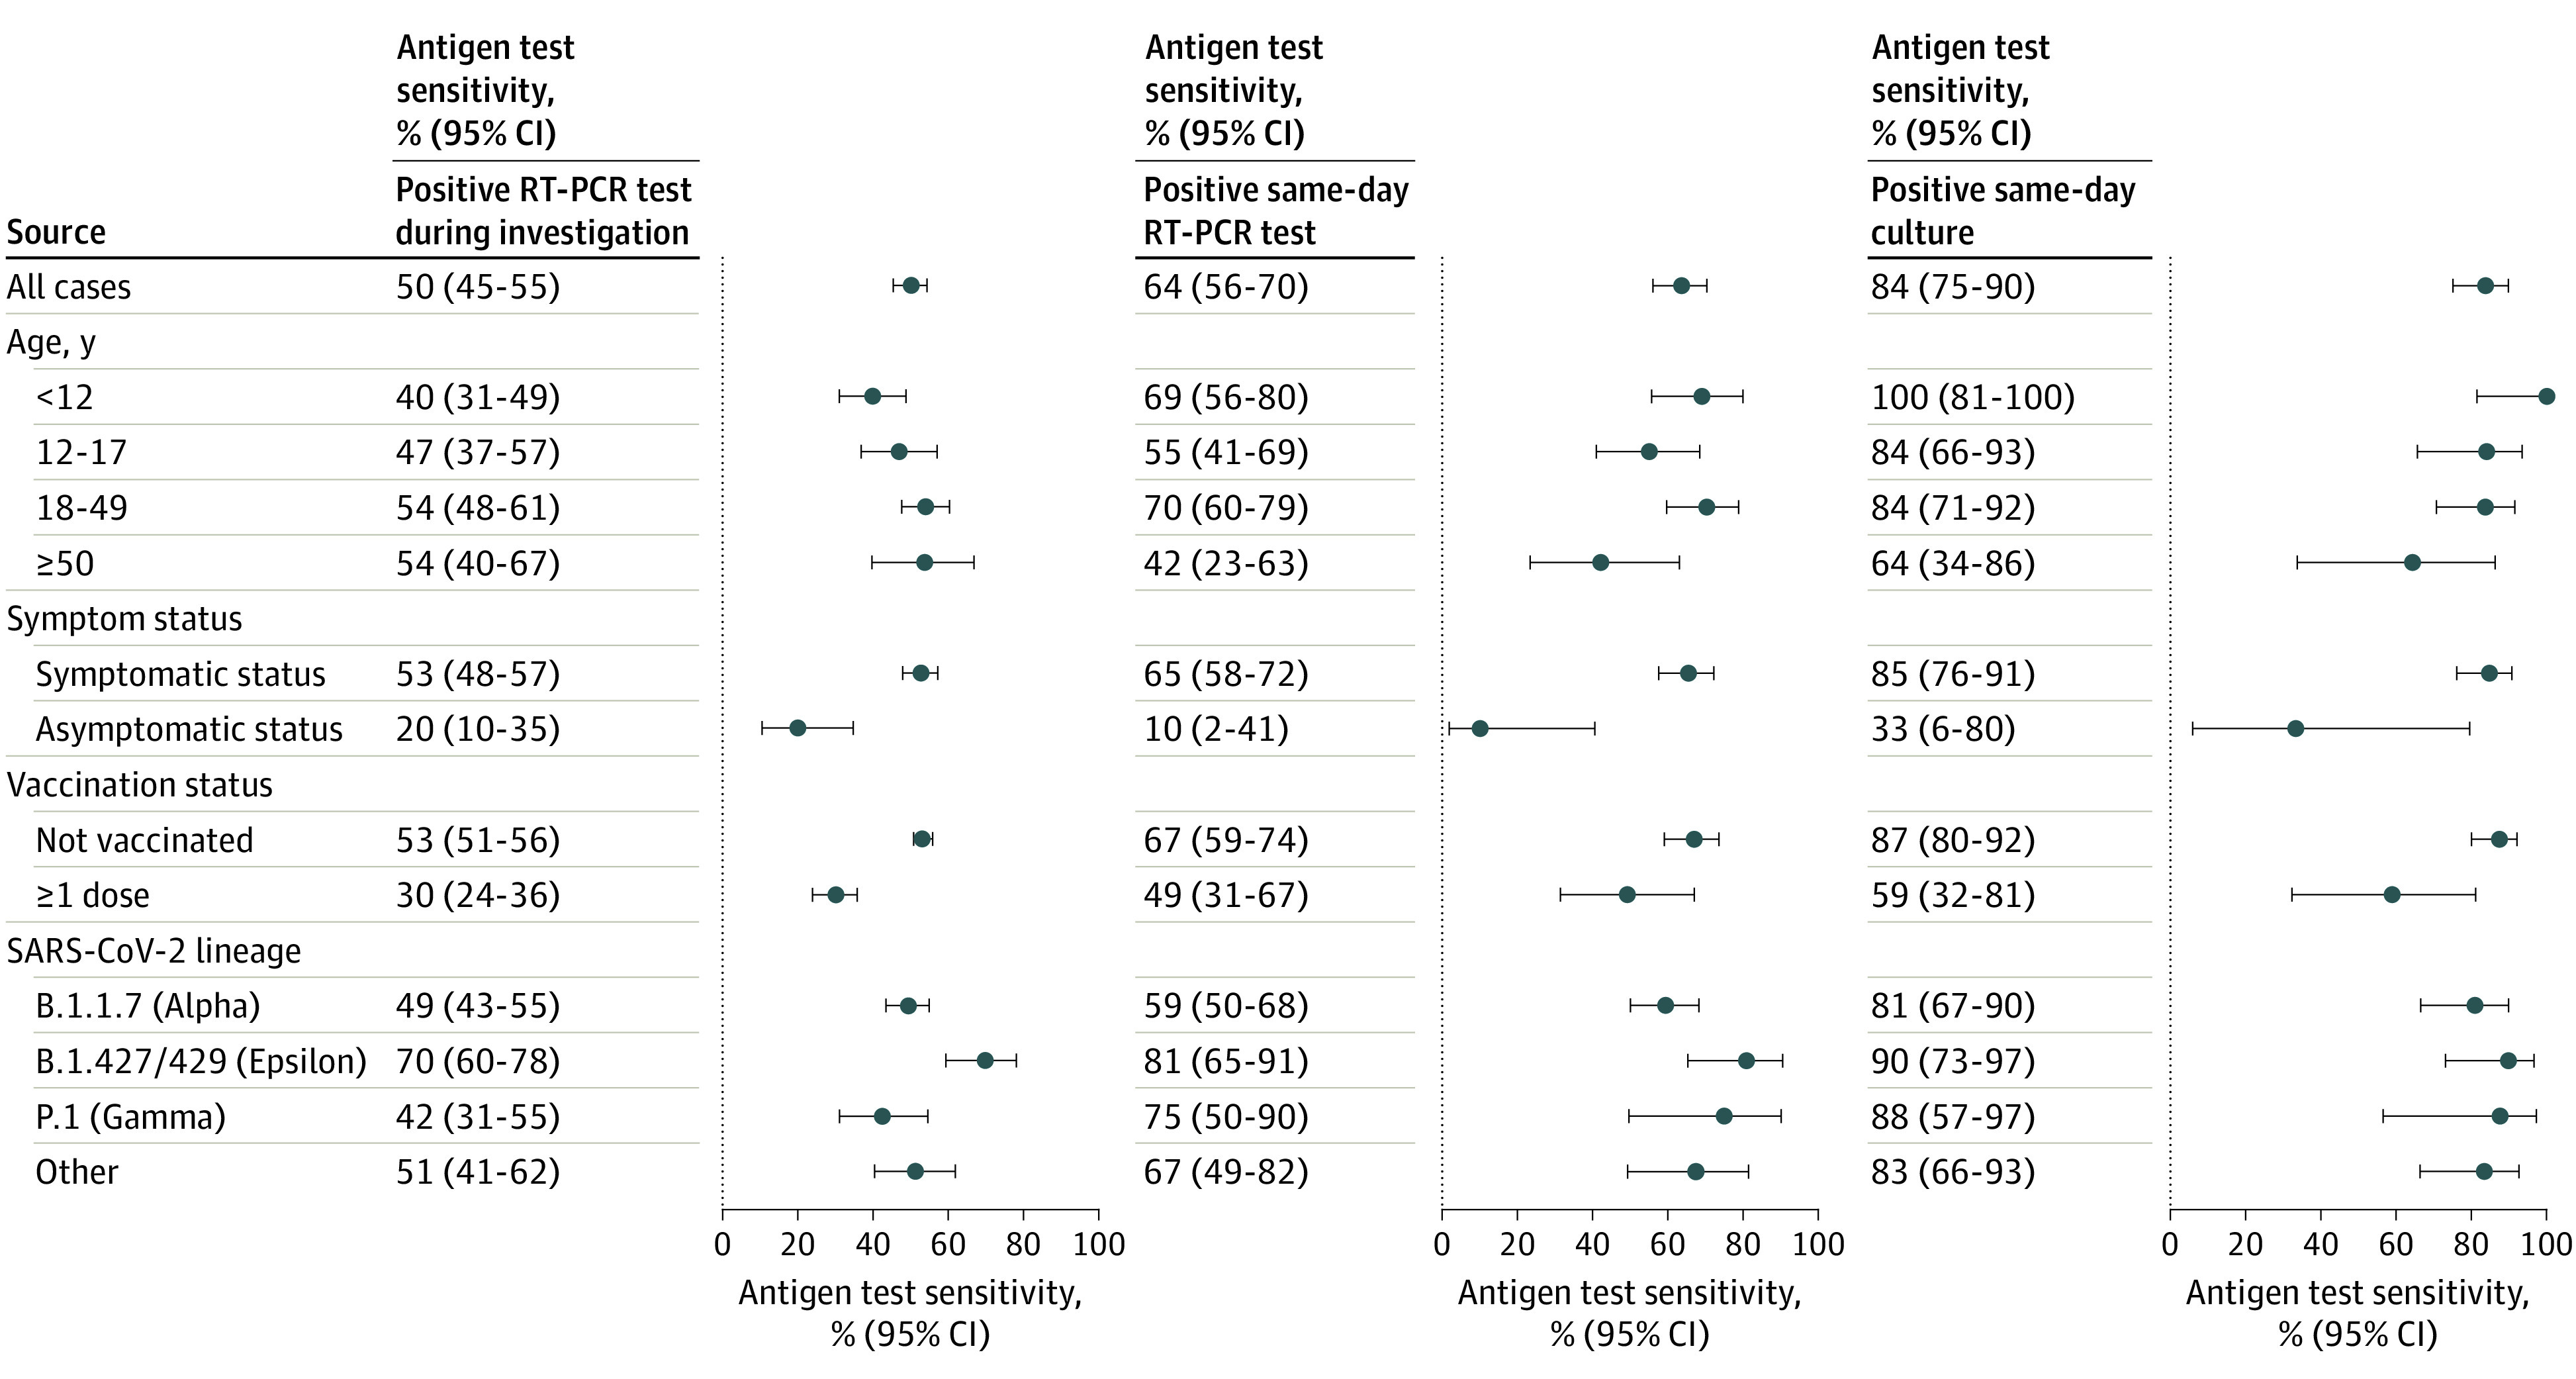
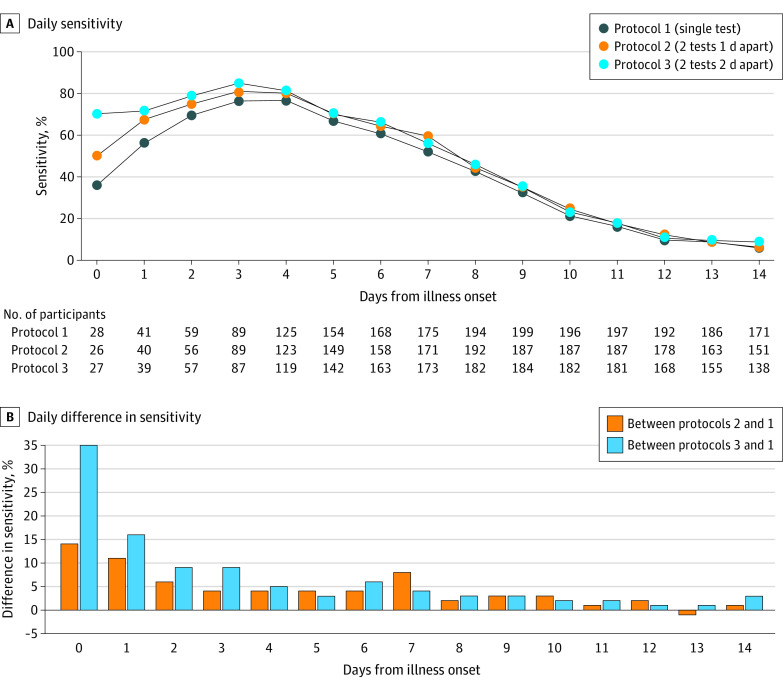
Main outcomes and measures: The primary outcome was the daily sensitivity of home antigen tests to detect RT-PCR-confirmed cases. Secondary outcomes included the daily percentage of antigen test, RT-PCR, and viral culture results that were positive, and antigen test sensitivity compared with same-day RT-PCR and cultures. Antigen test use errors and acceptability were assessed for a subset of participants.

Results: This study enrolled 225 persons with RT-PCR-confirmed infection (median [range] age, 29 [1-83] years; 117 female participants [52%]; 10 [4%] Asian, 6 [3%] Black or African American, 50 [22%] Hispanic or Latino, 3 [1%] Native Hawaiian or Other Pacific Islander, 145 [64%] White, and 11 [5%] multiracial individuals) who completed 3044 antigen tests and 642 nasopharyngeal swabs. Antigen test sensitivity was 50% (95% CI, 45%-55%) during the infectious period, 64% (95% CI, 56%-70%) compared with same-day RT-PCR, and 84% (95% CI, 75%-90%) compared with same-day cultures. Antigen test sensitivity peaked 4 days after illness onset at 77% (95% CI, 69%-83%). Antigen test sensitivity improved with a second antigen test 1 to 2 days later, particularly early in the infection. Six days after illness onset, antigen test result positivity was 61% (95% CI, 53%-68%). Almost all (216 [96%]) surveyed individuals reported that they would be more likely to get tested for SARS-CoV-2 infection if home antigen tests were available over the counter.

Conclusions and relevance: The results of this cohort study of home antigen tests suggest that sensitivity for SARS-CoV-2 was moderate compared with RT-PCR and high compared with viral culture. The results also suggest that symptomatic individuals with an initial negative home antigen test result for SARS-CoV-2 infection should test again 1 to 2 days later because test sensitivity peaked several days after illness onset and improved with repeated testing.


Conflict of interest statement

Conflict of Interest Disclosures: Dr Stringer reported grants from the US Centers for Disease Control and Prevention (CDC) Epidemiology and Laboratory Capacity for Prevention and Control of Emerging Infectious Diseases during the conduct of the study. No other disclosures were reported.

Figures

Figure 1.
Figure 1.. Daily Percentage of Positive SARS-CoV-2 Tests in Participants With Reverse Transcription–Polymerase Chain Reaction (RT-PCR)–Confirmed Infection
Daily percentage of positive SARS-CoV-2 tests (lines) and 95% CIs (shaded areas) of RT-PCR tests, home antigen tests, and viral culture among 225 participants with RT-PCR–confirmed SARS-CoV-2 infection. If the participant was symptomatic, illness onset was defined as the symptom onset date; if asymptomatic, illness onset was the collection date of the first positive RT-PCR test result. Confidence intervals were calculated by the Wilson score interval method.
Figure 2.
Figure 2.. Daily Percentage of Positive Home Antigen Tests by Symptom Status and Vaccination Status
Daily percentage of positive SARS-CoV-2 tests (lines) and 95% CIs (shaded areas) of home antigen tests among 225 participants with reverse transcription–polymerase chain reaction (RT-PCR)–confirmed SARS-CoV-2 infection by symptom status (A) and vaccination status (B). Participants were considered symptomatic if they reported symptoms that fulfilled the clinical criteria for COVID-19 adopted by the Council of State and Territorial Epidemiologists on August 5, 2020 (https://ndc.services.cdc.gov/case-definitions/coronavirus-disease-2019-2020-08-05/). Symptoms were captured via the enrollment questionnaire and daily symptom questionnaires during the 15-day enrollment period. Confidence intervals were calculated using the Wilson score interval method.
Figure 3.
Figure 3.. Sensitivity of Home Antigen Tests Compared With 3 Reference Standards
Sensitivity (dots) and 95% CIs (error bars) of home antigen tests compared with 3 reference standards: a positive reverse transcription–polymerase chain reaction (RT-PCR) test at any time during the investigation, a positive RT-PCR test collected the same day as the antigen test, and a positive viral culture collected the same day as the antigen test. Results are displayed for all cases and subgroups as defined by age, symptom status, vaccination status, and SARS-CoV-2 lineage. Participants were considered symptomatic if they reported symptoms that fulfilled clinical criteria for COVID-19 adopted by the Council of State and Territorial Epidemiologists on August 5, 2020 (https://ndc.services.cdc.gov/case-definitions/coronavirus-disease-2019-2020-08-05/). Symptoms were captured via the enrollment questionnaire and daily symptom questionnaires during the 15-day enrollment period. Vaccination status was defined at the time of enrollment. Confidence intervals were calculated using Wilson score intervals with cluster-robust standard errors accounting for correlation of tests performed by the same participant. For participants younger than 12 years, the 95% CI for antigen test sensitivity compared with a positive same-day viral culture was calculated without cluster adjustment as all tests were contributed by unique participants.
Figure 4.
Figure 4.. Daily Sensitivity of 3 Home Antigen Testing Protocols
A, Daily sensitivity of 3 home antigen testing protocols; the reference standard was a positive reverse transcription–polymerase chain reaction (RT-PCR) test at any time during the investigation. B, Daily difference in testing protocol sensitivities. For protocols 2 and 3, sensitivity is displayed by day of the first test collected.

Similar articles

Cited by

References

    1. Dinnes J, Deeks JJ, Berhane S, et al. ; Cochrane COVID-19 Diagnostic Test Accuracy Group . Rapid, point-of-care antigen and molecular-based tests for diagnosis of SARS-CoV-2 infection. Cochrane Database Syst Rev. 2021;3(3):CD013705. doi:10.1002/14651858.CD013705.pub2 - DOI - PMC - PubMed
    1. Hanson KE, Altayar O, Caliendo AM, et al. . The Infectious Diseases Society of America guidelines on the diagnosis of COVID-19: antigen testing. Clin Infect Dis. Published online June 23, 2021. doi:10.1093/cid/ciab557 - DOI - PubMed
    1. Smith RL, Gibson LL, Martinez PP, et al. . Longitudinal assessment of diagnostic test performance over the course of acute SARS-CoV-2 infection. J Infect Dis. 2021;224(6):976-982. doi:10.1093/infdis/jiab337 - DOI - PMC - PubMed
    1. Donnelly MAP, Chuey MR, Soto R, et al. ; COVID-19 Household Transmission Team . Household transmission of SARS-CoV-2 Alpha variant—United States, 2021. Clin Infect Dis. Published online February 11, 2022. doi:10.1093/cid/ciac125 - DOI - PMC - PubMed
    1. National Archives . Code of Federal Regulations. Accessed January 15, 2021. https://www.ecfr.gov/

Publication types