. 2022 Apr 29;17(4):e0267547.
doi: 10.1371/journal.pone.0267547. eCollection 2022.

Temperature or competition: Which has more influence on Mediterranean ant communities?

Affiliations

Temperature or competition: Which has more influence on Mediterranean ant communities?

Daniel Sánchez-García et al. PLoS One. .

Abstract

Temperature and competition are two of the main factors determining ant community assemblages. Temperature may allow species to forage more or less efficiently throughout the day (in accordance with the maximum activity temperature of each species). Competition can be observed and quantified from species replacements occurring during resource exploitation. We studied the interspecific competitive interactions of ant communities from the Doñana Biological Reserve (southern Spain). Ants were sampled from pitfall traps and baits in three habitats with contrasted vegetation physiognomy (savin forest, pine forest, and dry scrubland). We measured the temperature during the competitive interactions between species and created a thermal competition index (TCI) to assess the relative contribution of temperature and numerical dominance to the competitive outcomes. Temperature had unequal effects on ant activity in each type of habitat, and modulated competitive interactions. The TCI showed that a species' success during pair interactions (replacements at baits) was driven by the proportion of workers between the two competing species and by the species-specific effect of temperature (how advantageous the temperature change is for each species during bait replacement). During competitive interactions, the effect of temperature (higher values of TCI) and numeric supremacy (higher worker proportion) gave higher success probabilities. Interspecific competitive relationships in these Mediterranean ant communities are habitat dependent and greatly influenced by temperature.


Conflict of interest statement

The authors have declared that no competing interests exist.

Figures

Fig 1
Fig 1
Study area and sampling design: (a) aerial view of the study area (Doñana Biological Reserve, SW Spain) showing sampling plot site for each habitat type; (b) schema of the two sampling transects (A and B), each transect consists of three sampling points; (c) each sampling point has 7 pitfall traps (white circles) and 8 baits (grey squares); d) savin juniper forest; e) pine forest; f) dry scrubland. Aerial view from digital aerial orthophotograph of the Spanish National Orthophoto Program (PNOA) (September 2019) under a CC BY 4.0 License (https://www.ign.es/wms-inspire/pnoa-ma? and free download through the CNIG’s download centre).
Fig 2
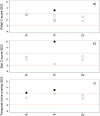
Fig 2. C-score standardized effect size (SES) values at each study habitat.
(SF: Savin forest, PF: Pine forest, DS: Dry scrubland) from the C-score of (a) pitfall catches and (b) bait observations, and (c) temporal niche overlap. The dotted lines represent 1.96 standard deviation, the approximate level of statistical significance (p < 0.05). Thus, the larger standardized C-scores (filled circle), the less co-occurrence compared with a randomly assembled community, while values within the dotted lines (open circle) correspond to a random pattern of organization.
Fig 3
Fig 3
Bait occupation by hour in each habitat: (a) Dry scrubland, (b) Savin forest, and (c) Pine forest. Mean temperature for each habitat is shown with a black line and represented on the right axis. Dashed lines divide the hours in 3 periods: 8h to 13h and 18h to 23h –the coolest ones, and 13h to 18h –the warmest ones. Species abbreviations: ASEN (Aphaenogaster senilis), CAUB (Crematogaster auberti), CFLO (Cataglyphis floricola), CSCU (Crematogaster scutellaris), CTAR (Cataglyphis tartessica), LGRA (Lasius grandis), Miscellaneous (less abundant species), PPAL (Pheidole pallidula), PPYG (Plagiolepis pygmaea), SSP1 (Solenopsis sp.), TFOR (Tetramorium forte), TNIG (Tapinoma cf. nigerrimum), TSP1 (Temnothorax sp. 1) and TSP2 (Temnothorax sp. 2).
Fig 4
Fig 4. Probability of network module membership based on the species’ optimal foraging temperature.
Fig 5
Fig 5
Linear or quadratic fit of the effect of temperature on bait occupation for the four most abundant species in each habitat: (a) Dry scrubland, (b) Savin forest and (c) Pine forest. Species abbreviations: ASEN (Aphaenogaster senilis), CFLO (Cataglyphis floricola), CTAR (Cataglyphis tartessica), CAUB (Crematogaster auberti), CSCU (Crematogaster scutellaris), LGRA (Lasius grandis), PPAL (Pheidole pallidula) and TNIG (Tapinoma cf. nigerrimum). Significant fits are shown by a solid line, not significant fits with a dotted line (S2 Appendix).
Fig 6
Fig 6. Pairwise comparisons showing the probability of success for the most common species-species interaction at three levels of worker proportion (5:1, 1:1, 1:5) and three levels of the thermal competition index (15, 0, -15).
The values express the probability of success for the x axis species. Color gradient represents the probability of success in the competitive interaction: orange indicates lower probability, while blue indicates higher probability. Numbers in each box indicate the probability. Squares separate the species’ interactions into subordinate-subordinate (bottom-left), dominant-subordinate (top-left and bottom-right) and dominant-dominant (top-right). Species abbreviations: Subordinates: ASEN (Aphaenogaster senilis), CATA (Cataglyphis floricola and Cataglyphis tartessica) and PPYG (Plagiolepis pygmaea); Dominants: CAUB (Crematogaster auberti), CSCU (Crematogaster scutellaris), LGRA (Lasius grandis) and TNIG (Tapinoma cf. nigerrimum).

References

    1. Wilson EO. Success and Dominance in Ecosystems: the Case of Social Insects. In: Kinne O, editor. Excellence in Ecology Vol 2. Oldendorf/Luhe, Germany: Ecology Institute; 1990. p. 104.
    1. Jones CG, Lawton JH, Shachak M. Organisms as ecosystem engineers. Oikos. 1994;69: 373–386.
    1. De Almeida T, Mesléard F, Santonja M, Gros R, Dutoit T, Blight O. Above- and below-ground effects of an ecosystem engineer ant in Mediterranean dry grasslands. Proc R Soc B Biol Sci. 2020;287: 20201840. doi: 10.1098/rspb.2020.1840 - DOI - PMC - PubMed
    1. Andersen AN. Regulation of “momentary” diversity by dominant species in exceptionally rich ant communities of the Australian seasonal tropics. Am Nat. 1992;140: 401–420. doi: 10.1086/285419 - DOI - PubMed
    1. Davidson DW. Resource discovery versus resource domination in ants: a functional mechanism for breaking the trade-off. Ecol Entomol. 1998;23: 484–490. doi: 10.1046/j.1365-2311.1998.00145.x - DOI

Publication types