. 2022 Apr 29;17(4):e0267113.
doi: 10.1371/journal.pone.0267113. eCollection 2022.

Identifying monitoring information needs that support the management of fish in large rivers

Affiliations

Identifying monitoring information needs that support the management of fish in large rivers

Timothy D Counihan et al. PLoS One. .

Abstract

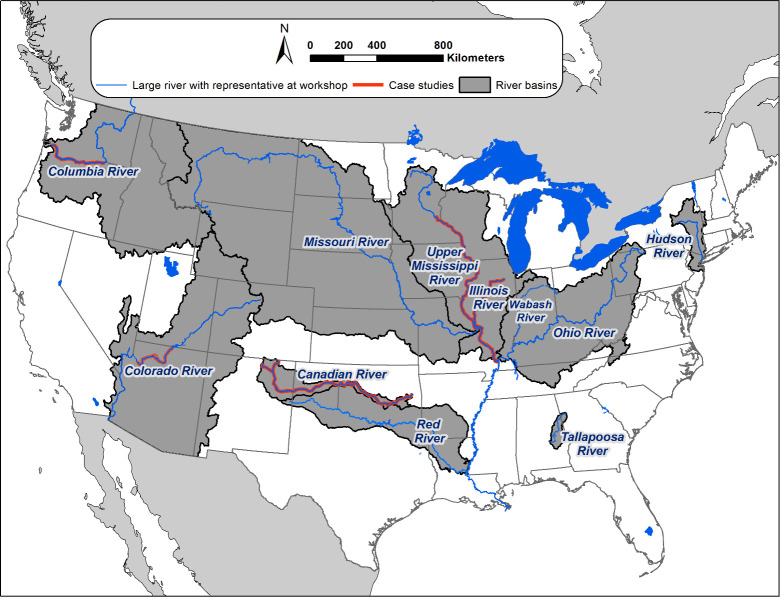
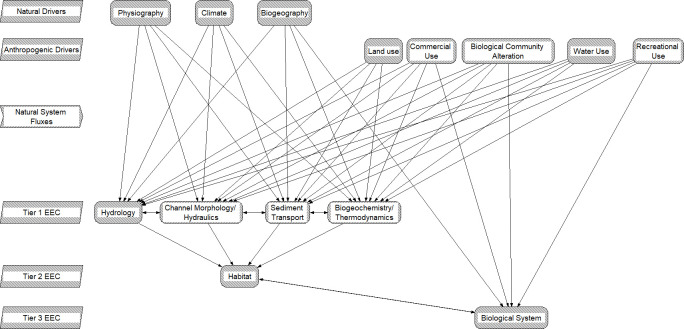
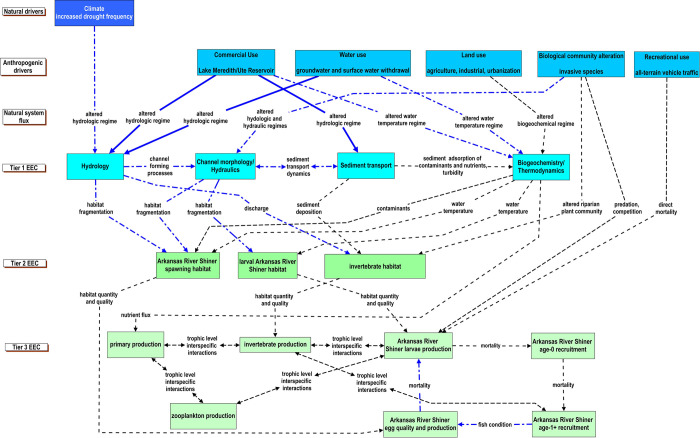
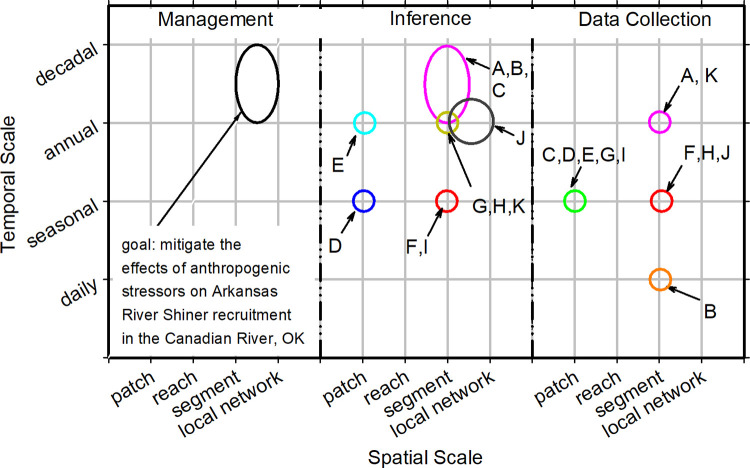
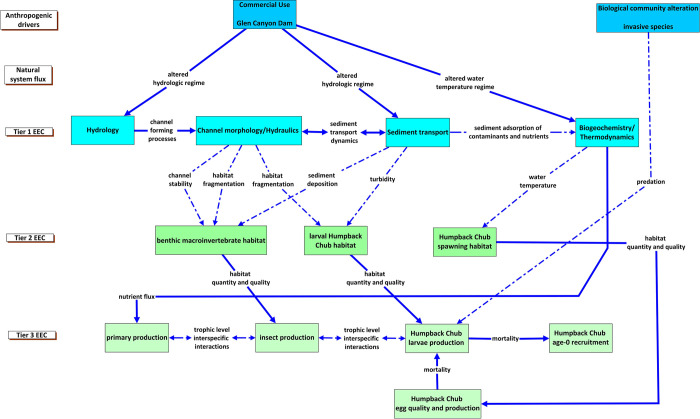
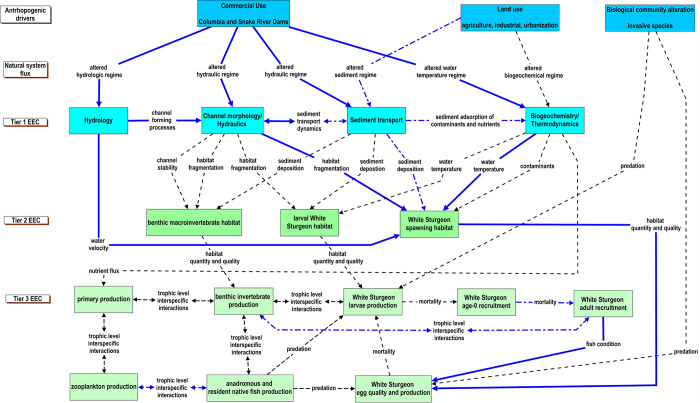
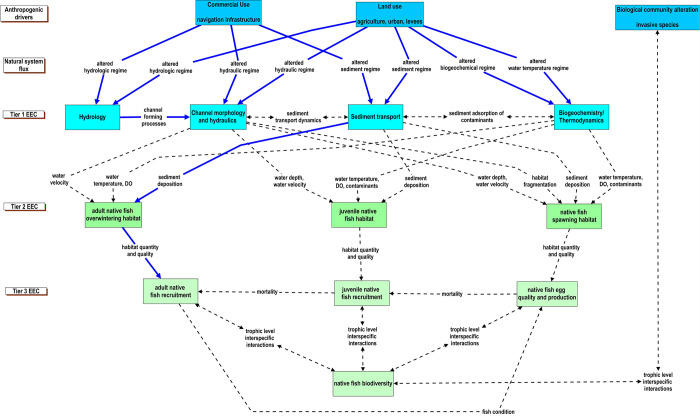
Management actions intended to benefit fish in large rivers can directly or indirectly affect multiple ecosystem components. Without consideration of the effects of management on non-target ecosystem components, unintended consequences may limit management efficacy. Monitoring can help clarify the effects of management actions, including on non-target ecosystem components, but only if data are collected to characterize key ecosystem processes that could affect the outcome. Scientists from across the U.S. convened to develop a conceptual model that would help identify monitoring information needed to better understand how natural and anthropogenic factors affect large river fishes. We applied the conceptual model to case studies in four large U.S. rivers. The application of the conceptual model indicates the model is flexible and relevant to large rivers in different geographic settings and with different management challenges. By visualizing how natural and anthropogenic drivers directly or indirectly affect cascading ecosystem tiers, our model identified critical information gaps and uncertainties that, if resolved, could inform how to best meet management objectives. Despite large differences in the physical and ecological contexts of the river systems, the case studies also demonstrated substantial commonalities in the data needed to better understand how stressors affect fish in these systems. For example, in most systems information on river discharge and water temperature were needed and available. Conversely, information regarding trophic relationships and the habitat requirements of larval fishes were generally lacking. This result suggests that there is a need to better understand a set of common factors across large-river systems. We provide a stepwise procedure to facilitate the application of our conceptual model to other river systems and management goals.


Conflict of interest statement

The authors have declared that no competing interests exist.

Figures

Fig 1
Fig 1. Map of rivers and watersheds represented by scientists that convened to develop a conceptual model that depicts how natural and anthropogenic drivers interact with habitats, biological systems, and fish in large rivers.
River segments where we conducted case studies that applied the conceptual model to identify monitoring information needs associated with management goals are highlighted in red. Data used: 1:2,000,000-Scale Hydrologic Unit Boundaries–source: U.S. Geological Survey; U.S. States (Generalized), U.S. Rivers (Generalized) 2005, U.S. Lakes (Generalized) 2005, and World Countries 2005 –source: ESRI.
Fig 2
Fig 2. The results of a query to scientists from the Canadian, Colorado, Columbia, Hudson, Illinois, Ohio, Missouri, Red, Tallapoosa, Upper Mississippi, and Wabash Rivers, U.S to identify anthropogenic activities that affect large-river fishes in the river systems they represent.
Anthropogenic activities were classified into five driver categories.
Fig 3
Fig 3. Tiered hierarchical conceptualization of how anthropogenic and natural drivers relate to physical and biological components of large-river ecosystems.
Essential ecosystem characteristics (EECs) are groupings of ecosystem components. Tier 1 EECs represent physical and chemical effects; fundamental measures of process that are directly affected by anthropogenic and natural drivers. Tier 2 EECs represent a broad habitat category that is intended to encompass the physical, chemical, and biological components of the riverine habitats that influence reproduction, growth, and survival of biotic communities. The Tier 3 EEC represent components of the biological systems that respond to changes in the hierarchical components of the conceptual model.
Fig 4
Fig 4. Conceptual model describing the relationship of natural and anthropogenic drivers to essential ecosystem characteristics (EECs) affecting the recruitment of the Arkansas River Shiner in the South Canadian River in New Mexico, Texas, and Oklahoma.
Essential ecosystem characteristics are groupings of ecosystem components. Tier 1 EECs represent physical and chemical effects; fundamental measures of process that are directly affected by anthropogenic and natural drivers. Tier 2 EECs represent a broad habitat category that is intended to encompass the physical, chemical, and biological components of the riverine habitats that influence reproduction, growth, and survival of biotic communities. The Tier 3 EECs represent components of the biological systems that respond to changes in the hierarchical components of the conceptual model. The strength of our understanding of how natural and anthropogenic drivers interact with habitats, biological systems, and fish in large rivers is represented by the different types of lines in the figure. Solid blue lines depict a strong understanding of the relationship, the dotted-dashed blue line represents a moderate understanding of the relationship, and the black dashed line represents a weak understanding of the relationship. The different types of lines also represent the strength of our understanding of within EEC-tier relationships.
Fig 5
Fig 5. The spatial and temporal scales of the management goal, the scientific inferences needed to inform the management goal, and that data collection needs to occur to support the inferences for monitoring information needs identified as requiring additional data in the case study addressing the recruitment of the Arkansas River Shiner in the Canadian River, Oklahoma (see S1 Table for additional detail).
A:Tier 1 EEC = channel morphology/hydraulics; Stressor = altered hydraulic regime; B:Tier 1 EEC = biogeochemistry/thermodynamics; Stressor = altered water temperature regime; C:Tier 1 EEC = biogeochemistry/thermodynamics; Stressor = altered biogeochemical regime; D:Tier 2 EEC = Arkansas River Shiner spawning habitat; Stressors = contaminants, water temperature, habitat fragmentation; E:Tier 2 EEC = larval Arkansas River Shiner habitat, Stressors = water temperature, habitat fragmentation and Tier 2 EEC = invertebrate habitat, Stressors = altered riparian plant community, discharge, sediment deposition; F:Tier 3 EEC = primary production, Stressor = nutrient flux; G:Tier 3 EEC = invertebrate production; Stressor = invertebrate habitat quantity and quality and Tier 3 EEC = Arkansas River Shiner larvae production, Stressor = predation by invasive species; H:Tier 1 EEC = biogeochemistry/thermodynamics; Inter-tier interaction = Sediment adsorption of contaminants and nutrients and Tier 3 EEC = Arkansas River Shiner larvae production, Stressors = Arkansas River Shiner larvae habitat quantity and quality and Tier 3 EEC = Arkansas River Shiner age-0 recruitment; Inter-tier interaction = Arkansas River Shiner larvae mortality and Tier 3 EEC = Arkansas River Shiner age-1+ recruitment, Inter-tier interaction = Arkansas River Shiner age-0 mortality and Tier 3 EEC = all, Inter-tier interaction = trophic level interactions; I:Arkansas River Shiner larvae production; Stressor = direct mortality from recreational use (i.e., all-terrain vehicle and in-river traffic); J:Tier 3 EEC = Arkansas River Shiner egg quality and production; Stressor = Arkansas River Shiner spawning habitat quantity and quality; K:Tier 3 EEC = Arkansas River Shiner larvae production; Inter-tier interaction = Arkansas River Shiner egg mortality.
Fig 6
Fig 6. Conceptual model describing the relationship of anthropogenic drivers to essential ecosystem characteristics (EECs) affecting the recruitment of Humpback Chub in the Colorado River between Glen Canyon Dam and Lake Mead, Arizona.
Essential ecosystem characteristics (EECs) are groupings of ecosystem components. Tier 1 EECs represent physical and chemical effects; fundamental measures of process that are directly affected by anthropogenic and natural drivers. Tier 2 EECs represent a broad habitat category that is intended to encompass the physical, chemical, and biological components of the riverine habitats that influence reproduction, growth, and survival of biotic communities. The Tier 3 EECs represent components of the biological systems that respond to changes in the hierarchical components of the conceptual model. The strength of our understanding of how natural and anthropogenic drivers interact with habitats, biological systems, and fish in large rivers is represented by the different types of lines in the figure. Solid blue lines depict a strong understanding of the relationship, the dotted-dashed blue line represents a moderate understanding of the relationship, and the black dashed line represents a weak understanding of the relationship. The different types of lines also represent the strength of our understanding of within EEC-tier relationships.
Fig 7
Fig 7. Conceptual model describing the relationship of anthropogenic drivers to essential ecosystem characteristics (EECs) affecting the recruitment of White Sturgeon in the Columbia River, U.S. Essential ecosystem characteristics (EECs) are groupings of ecosystem components.
Tier 1 EECs represent physical and chemical effects; fundamental measures of process that are directly affected by anthropogenic and natural drivers. Tier 2 EECs represent a broad habitat category that is intended to encompass the physical, chemical, and biological components of the riverine habitats that influence reproduction, growth, and survival of biotic communities. The Tier 3 EECs represent components of the biological systems that respond to changes in the hierarchical components of the conceptual model. The strength of our understanding of how natural and anthropogenic drivers interact with habitats, biological systems, and fish in large rivers is represented by the different types of lines in the figure. Solid blue lines depict a strong understanding of the relationship, the dotted-dashed blue line represents a moderate understanding of the relationship, and the black dashed line represents a weak understanding of the relationship. The different types of lines also represent the strength of our understanding of within EEC-tier relationships.
Fig 8
Fig 8. Conceptual model of how anthropogenic drivers in the upper Mississippi and Illinois Rivers influence native fish habitats and recruitment.
Essential ecosystem characteristics (EECs) are groupings of ecosystem components. Tier 1 EECs represent physical and chemical effects; fundamental measures of process that are directly affected by anthropogenic and natural drivers. Tier 2 EECs represent a broad habitat category that is intended to encompass the physical, chemical, and biological components of the riverine habitats that influence reproduction, growth, and survival of biotic communities. The Tier 3 EECs represent components of the biological systems that respond to changes in the hierarchical components of the conceptual model. The strength of our understanding of the relationships of how natural and anthropogenic drivers interact with habitats, biological systems, and fish in large rivers is represented by the different types of lines in the figure. Solid blue lines depict a strong understanding of the relationship, the dotted-dashed blue line represents a moderate understanding of the relationship, and the black dashed line represents a weak understanding of the relationship. The different types of lines also represent the strength of our understanding of within EEC-tier relationships.

References

    1. Thomas JA, Emery EB, McCormick FH. Detection of temporal trends in Ohio River fish assemblages based on lockchamber surveys (1957–2001). In: Rinne J.N., Hughes R.M., Calamusso B, editors. Historical changes in large river fish assemblages of the Americas. 45. Bethesda, MD: American Fisheries Society; 2005. p. 431–49.
    1. Lohner TW, Dixon DA. The value of long-term environmental monitoring programs: an Ohio River case study. Environ Monit Assess. 2013;185(11):9385–96. doi: 10.1007/s10661-013-3258-4 - DOI - PMC - PubMed
    1. McClelland MA, Sass GG, Cook TR, Irons KS, Michaels NN, O’Hara TM, et al. The long-term Illinois River fish population monitoring program. Fisheries. 2012;37(8):340–50. doi: 10.1080/03632415.2012.704815 - DOI
    1. Ward JV. Riverine landscapes: Biodiversity patterns, disturbance regimes, and aquatic conservation. Biol Conserv. 1998;83(3):269–78. doi: 10.1089/acm.2008.0179 WOS:A1998YJ19500005. - DOI
    1. Lee LS, Garnett JA, Bright EG, Sharitz RR, Batzer DP. Vegetation, invertebrate, and fish community response to past and current flow regulation in floodplains of the Savannah River, Southeastern USA. Wetlands Ecol Manage. 2016;24:443–55. doi: 10.1007/s11273-015-9470-y - DOI

Publication types