Landscape diversity and local temperature, but not climate, affect arthropod predation among habitat types
- PMID: 35486623
- PMCID: PMC9053821
- DOI: 10.1371/journal.pone.0264881
Landscape diversity and local temperature, but not climate, affect arthropod predation among habitat types
Abstract
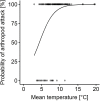
Arthropod predators are important for ecosystem functioning by providing top-down regulation of insect herbivores. As predator communities and activity are influenced by biotic and abiotic factors on different spatial scales, the strength of top-down regulation ('arthropod predation') is also likely to vary. Understanding the combined effects of potential drivers on arthropod predation is urgently needed with regard to anthropogenic climate and land-use change. In a large-scale study, we recorded arthropod predation rates using artificial caterpillars on 113 plots of open herbaceous vegetation embedded in contrasting habitat types (forest, grassland, arable field, settlement) along climate and land-use gradients in Bavaria, Germany. As potential drivers we included habitat characteristics (habitat type, plant species richness, local mean temperature and mean relative humidity during artificial caterpillar exposure), landscape diversity (0.5-3.0-km, six scales), climate (multi-annual mean temperature, 'MAT') and interactive effects of habitat type with other drivers. We observed no substantial differences in arthropod predation rates between the studied habitat types, related to plant species richness and across the Bavarian-wide climatic gradient, but predation was limited when local mean temperatures were low and tended to decrease towards higher relative humidity. Arthropod predation rates increased towards more diverse landscapes at a 2-km scale. Interactive effects of habitat type with local weather conditions, plant species richness, landscape diversity and MAT were not observed. We conclude that landscape diversity favours high arthropod predation rates in open herbaceous vegetation independent of the dominant habitat in the vicinity. This finding may be harnessed to improve top-down control of herbivores, e.g. agricultural pests, but further research is needed for more specific recommendations on landscape management. The absence of MAT effects suggests that high predation rates may occur independent of moderate increases of MAT in the near future.
Conflict of interest statement
The authors have declared that no competing interests exist.
Figures


References
-
- Schowalter TD. Herbivory. In: Schowalter TD, editor. Insect ecology. 4th ed. Academic Press; 2016. pp. 405–443. doi: 10.1016/B978-0-12-803033-2.00012–1 - DOI
-
- Haan NL, Iuliano BG, Gratton C, Landis DA. Designing agricultural landscapes for arthropod-based ecosystem services in North America. In: Bohan DA, Vanbergen AJ, editors. The Future of Agricultural Landscapes, Part II. Academic Press; 2021. pp. 191–250. doi: 10.1016/bs.aecr.2021.01.003 - DOI
Publication types
MeSH terms
Associated data
LinkOut - more resources
Full Text Sources
Research Materials

