. 2022 Apr 29;20(4):e3001627.
doi: 10.1371/journal.pbio.3001627. eCollection 2022 Apr.

Population heterogeneity in clinical cohorts affects the predictive accuracy of brain imaging

Affiliations

Population heterogeneity in clinical cohorts affects the predictive accuracy of brain imaging

Oualid Benkarim et al. PLoS Biol. .

Abstract

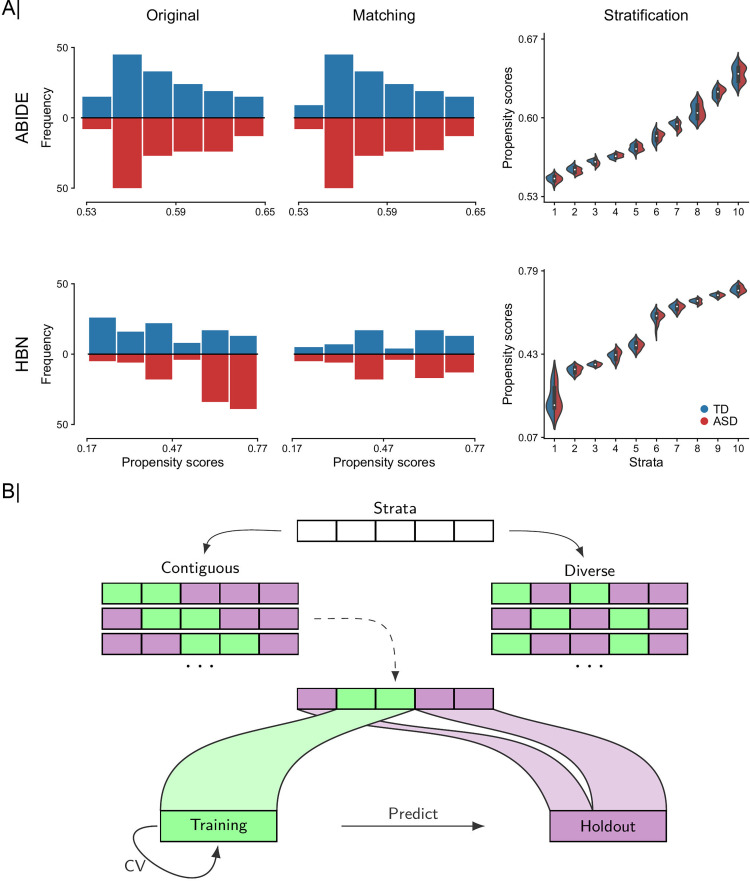
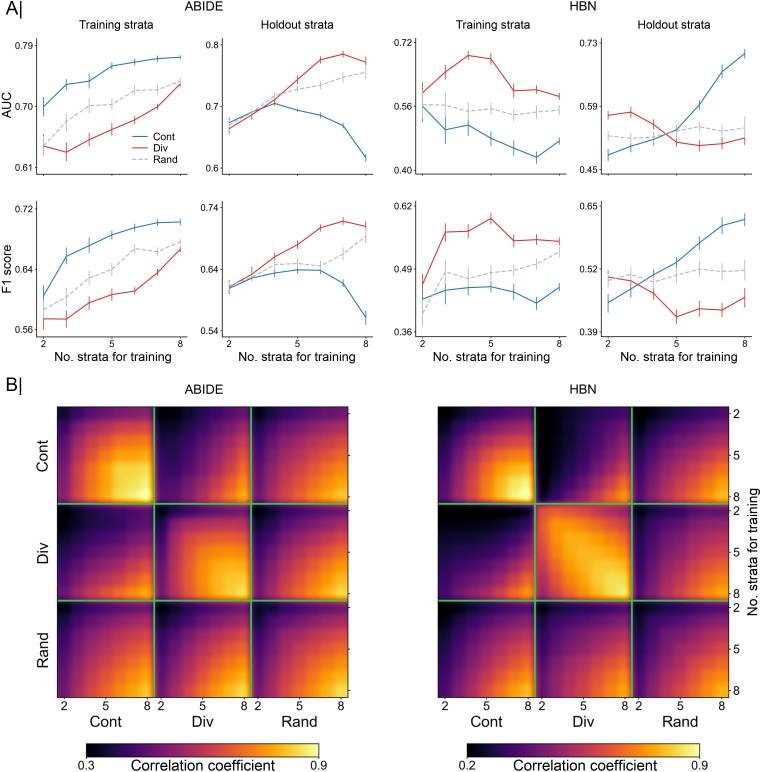
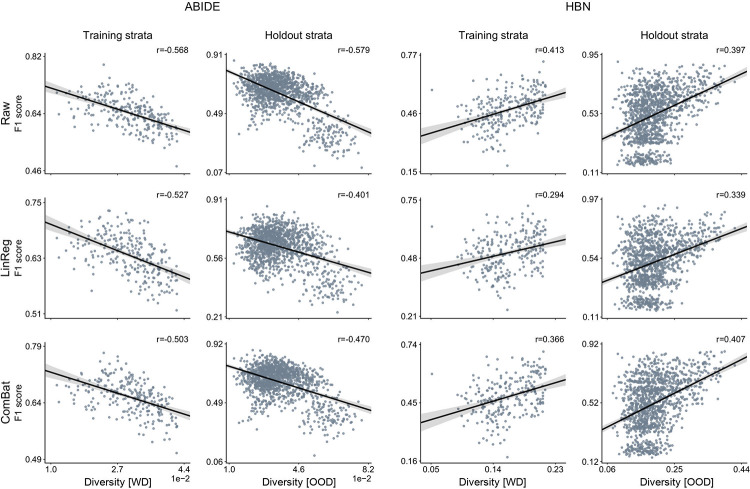
Brain imaging research enjoys increasing adoption of supervised machine learning for single-participant disease classification. Yet, the success of these algorithms likely depends on population diversity, including demographic differences and other factors that may be outside of primary scientific interest. Here, we capitalize on propensity scores as a composite confound index to quantify diversity due to major sources of population variation. We delineate the impact of population heterogeneity on the predictive accuracy and pattern stability in 2 separate clinical cohorts: the Autism Brain Imaging Data Exchange (ABIDE, n = 297) and the Healthy Brain Network (HBN, n = 551). Across various analysis scenarios, our results uncover the extent to which cross-validated prediction performances are interlocked with diversity. The instability of extracted brain patterns attributable to diversity is located preferentially in regions part of the default mode network. Collectively, our findings highlight the limitations of prevailing deconfounding practices in mitigating the full consequences of population diversity.


Conflict of interest statement

The authors have declared that no competing interests exist.

Figures

Fig 1
Fig 1. Workflow for systematic participant stratification and diversity-based participant sampling.
We repurpose propensity scores as a tool to translate several different indicators of population variation into a single diversity index. (A) From left to right: 2-sided histograms in which we show bin counts bins of estimated propensity score distributions for TD (blue) and ASD (red) participants before (i.e., using all observations in original dataset) and after matching (based on age, sex, and site) and partitioning of matched participants in 10 equally sized participant sets (i.e., strata) based on similarities of their propensity scores for ABIDE (top) and HBN (bottom) cohorts. Distributions of propensity scores after matching showed better overlap (middle panel) than the unmatched original distributions (left panel), especially in HBN. Propensity scores are computed as a function of age, sex, and site, which are commonly available in many future population cohorts. (B) Diversity-based participant sampling: Given the attribution of each participant to 1 of q homogeneous strata, a subset of r strata is picked and combined to form the training set used for estimating the predictive model (green) and the q-r remaining strata served as held-out set for testing the performance of that learning model (violet). Two different sampling regimes are used to form the training set: (i) a contiguous scheme where the training set is composed of adjacent strata of similar diversity; and (ii) a diverse scheme where the training data are composed of noncontiguous (at least one) strata with participants pulled from diverse populations. For each analysis setting, the classification accuracy is assessed within the training set based on rigorous 10-fold fit–tune–predict CV cycles, and then all the training data are used to predict disease status in unseen holdout participants. Data underlying this figure can be found in S1 Data. ABIDE, Autism Brain Imaging Data Exchange; ASD, autism spectrum disorder; CV, cross-validation; HBN, Healthy Brain Network; TD, typically developing.
Fig 2
Fig 2. Accuracy of out-of-distribution prediction and consistency of extracted predictive patterns.
Results are based on the classification of ASD versus TD using functional connectivity profiles. (A) Comparison of model accuracy based on contiguous (Cont) and diverse (Div) training sets in the classification of autism. Prediction performance is reported as AUC (top) and F1 score (bottom) in 2 separate cohorts: ABIDE (left) and HBN (right). Accuracy is assessed using different training sets sized from 2 to 8 combined strata. For each cohort, the first column indicates the prediction accuracy using a 10-fold CV strategy based solely on participants from the training strata. Folds were randomly sampled, without considering the propensity scores of the participants. The second column displays the performance in the holdout strata, which contains the remaining participants (from untouched strata). As a baseline for comparison, we used an additional sampling scheme (Rand): Participants for the training set were randomly chosen regardless of their propensity scores. (B) Consistency of model coefficients was quantified by Pearson correlation coefficient across 2 given models in the contiguous, diverse, and random data scenarios. For each of these sampling schemes, consistency is shown for different numbers of combined strata used for predictive model training (from 2 to 8 combined strata), delineated by the green segments. Building models based on diverse strata of participants entailed considerable differences in predictive patterns from those learned based on models with similar participants (i.e., contiguous). Data underlying this figure can be found in S1 Data. ABIDE, Autism Brain Imaging Data Exchange; ASD, autism spectrum disorder; AUC, area under the curve; CV, cross-validation; HBN, Healthy Brain Network; TD, typically developing.
Fig 3
Fig 3. Participant diversity is a major determinant for the classification accuracy of predictive models.
Results are based on the classification of ASD versus TD using functional connectivity profiles. For each dataset, results show prediction accuracy for each possible combination of 5 out of 10 strata for training and the remaining 5 strata as holdout. Prediction accuracy based on AUC (top) and F1 score (bottom) in 2 different cohorts: ABIDE (left) and HBN (right). For each cohort, the first column indicates the predictive model performance using a 10-fold CV strategy based solely on the training set, where diversity is computed as the average of all pairwise absolute differences in propensity scores (i.e., WD). The second column displays the performance for each single stratum in the holdout strata. Diversity denotes the mean absolute difference in propensity scores between the participants of the training set and those in the held-out strata with unseen participants (i.e., OOD). The strength of the association between performance and diversity is reported with Pearson correlation coefficient (r). Our empirical results show a strong relationship between predictive performance and diversity, although different correlation directions were found in ABIDE and HBN cohorts. Data underlying this figure can be found in S1 Data. ABIDE, Autism Brain Imaging Data Exchange; ASD, autism spectrum disorder; AUC, area under the curve; CV, cross-validation; HBN, Healthy Brain Network; OOD, out of distribution; TD, typically developing; WD, within distribution.
Fig 4
Fig 4. Established and new deconfounding strategies appear insufficient to counteract escalating population diversity.
A means to quantify the behavior of predictive models is comparing its predictions on training and testing information. Performance is measured by AUC metric on the original brain imaging data (Raw, top), and after carrying out deconfounding steps on the brain feature prior to the pattern classification pipeline using standard linear regression–based deconfounding (LinReg, middle) and recently proposed ComBat (bottom) approaches. Compared with the conventional nuisance removal using regression residuals, ComBat is a more advanced hierarchical regression to control for site differences. Results are reported for 2 different clinical cohorts: ABIDE (left) and HBN (right). For each cohort, the first column shows the model prediction performance using a 10-fold CV strategy. Diversity is computed as the average of pairwise absolute differences in propensity scores between all participants (i.e., WD). Each dot is a cross-validated accuracy. The second column, for each cohort, displays the performance in the holdout participants. Instead of reporting performance on all the participants in the holdout data, here, performance is assessed independently for participants in each single stratum from the holdout data. Thus, diversity denotes the mean absolute difference in propensity scores between the participants in the training set and those in the held-out stratum (i.e., OOD). Both ComBat and linear regression–based deconfounding failed to mitigate the impact of diversity on prediction accuracy. Data underlying this figure can be found in S1 Data. ABIDE, Autism Brain Imaging Data Exchange; AUC, area under the curve; CV, cross-validation; HBN, Healthy Brain Network; OOD, out of distribution; WD, within distribution.
Fig 5
Fig 5. Breakdown of out-of-distribution predictions reveals unstable model behavior according to diversity subdimensions: acquisition sites, participant age, and sex.
(A) Error matrices that summarize the relationship of diversity (between the training and testing strata, i.e., OOD) with success and failure rate of the predictive models. These matrices are computed across sets of diagnostic classifications sorted in ascending order by diversity. (B) Relationship of out-of-distribution performance with diversity and age for each scanning site in ABIDE (left; NYU, PITT, TCD, and USM) and HBN (right; CBIC, RU, and SI). Performance is shown in terms of proportion of FN, FP, TN, and TP cases of model-based classification of clinical diagnoses. (C) Relationship of out-of-distribution performance with diversity for female (F) and male (M) participants. Predictive models show unstable behavior across each diversity dimension, underscoring the inconsistent results across the different sites and between females and males. Data underlying this figure can be found in S1 Data. ABIDE, Autism Brain Imaging Data Exchange; CBIC, CitiGroup Corcell Brain Imaging Center; FN, false negatives; FP, false positives; HBN, Healthy Brain Network; NYU, New York University Langone Medical Center; OOD, out of distribution; PITT, University of Pittsburgh, School of Medicine; RU, Rutgers University Brain Imaging Center; SI, Staten Island; TCD, Trinity Centre for Health Sciences, Trinity College Dublin; TN, true negatives; TP, true positives; USM, University of Utah, School of Medicine.
Fig 6
Fig 6. Varying participant diversity is detrimental for consistency of model-derived predictive patterns.
Results are based on all possible combinations of 5 out of 10 strata for training and the remaining 5 strata as holdout. (A) Drifts in model coefficients when estimated repeatedly (rows) with increasing diversity, separately in ABIDE (top) and HBN (bottom) cohorts. Model coefficients were ranked according to diversity and grouped into 5 chunks. Coefficients averaged within each chunk are displayed with increasing diversity. Positive and negative coefficients are shown in separate brain renderings for visibility. For each node, positive/negative coefficients were computed by averaging the edges with only positive/negative coefficients. (B) From top to bottom, changes in predictive model coefficients with increasing diversity in ABIDE and HBN cohorts. Consistency of model coefficients, in terms of Pearson correlation, is obtained for each possible combination of training participants (5 strata combined for training), where diversity is computed as the mean absolute difference in the propensity scores of the training participants (i.e., WD). Each entry in the correlation matrices corresponds to the correlation between the coefficients obtained by 2 predictive models trained on different combinations of training strata. Model coefficients were sorted according to the diversity of their corresponding training observations (arranged from low to high). Each matrix shows correlations based on the model coefficients learned when using the raw data (lower triangular part) and the ComBat-deconfounded data (upper part). Our results show that the consistency of model-derived predictive patterns decays with increasing diversity of the training set, even under deconfounding. Data underlying this figure can be found in S1 Data. ABIDE, Autism Brain Imaging Data Exchange; HBN, Healthy Brain Network; WD, within distribution.
Fig 7
Fig 7. Anatomical hot spots where predictive rules risk to become brittle in the face of diversity.
(A) ABIDE cohort: relationship between network-aggregated coefficients of predictive model and level of population diversity. Diversity is computed on the training strata (i.e., WD). Model coefficients are averaged for each intrinsic connectivity network. (B) HBN cohort: relationship of network-aggregated model coefficients with diversity. Brain renderings in A and B expose regions whose coefficients show a significant association with diversity. Consistent across both clinical cohorts, predictive model coefficients in regions of the highly associative DMN showed a privileged relation to escalating population variation. Data underlying this figure can be found in S1 Data. ABIDE, Autism Brain Imaging Data Exchange; DAN, dorsal attention network; DMN, default mode network; FPN, frontoparietal network; LSN, limbic system network; SMN, somatomotor network; VAN, ventral attention network; VN, visual network; WD, within distribution.

References

    1. Gabrieli JD, Ghosh SS, Whitfield-Gabrieli S. Prediction as a humanitarian and pragmatic contribution from human cognitive neuroscience. Neuron. 2015;85(1):11–26. doi: 10.1016/j.neuron.2014.10.047 - DOI - PMC - PubMed
    1. Bzdok D. Classical statistics and statistical learning in imaging neuroscience. Front Neurosci. 2017;11:543. doi: 10.3389/fnins.2017.00543 - DOI - PMC - PubMed
    1. Bzdok D, Yeo BT. Inference in the age of big data: Future perspectives on neuroscience. Neuroimage. 2017;155:549–64. doi: 10.1016/j.neuroimage.2017.04.061 - DOI - PubMed
    1. Orru G, Pettersson-Yeo W, Marquand AF, Sartori G, Mechelli A. Using support vector machine to identify imaging biomarkers of neurological and psychiatric disease: a critical review. Neurosci Biobehav Rev. 2012;36(4):1140–52. doi: 10.1016/j.neubiorev.2012.01.004 - DOI - PubMed
    1. Pereira F, Mitchell T, Botvinick M. Machine learning classifiers and fMRI: a tutorial overview. Neuroimage. 2009;45(1):S199–209. doi: 10.1016/j.neuroimage.2008.11.007 - DOI - PMC - PubMed

Publication types