. 2022 Apr 29;7(70):eabm8161.
doi: 10.1126/sciimmunol.abm8161. Epub 2022 Apr 29.

Succinate dehydrogenase/complex II is critical for metabolic and epigenetic regulation of T cell proliferation and inflammation

Affiliations

Succinate dehydrogenase/complex II is critical for metabolic and epigenetic regulation of T cell proliferation and inflammation

Xuyong Chen et al. Sci Immunol. .

Abstract

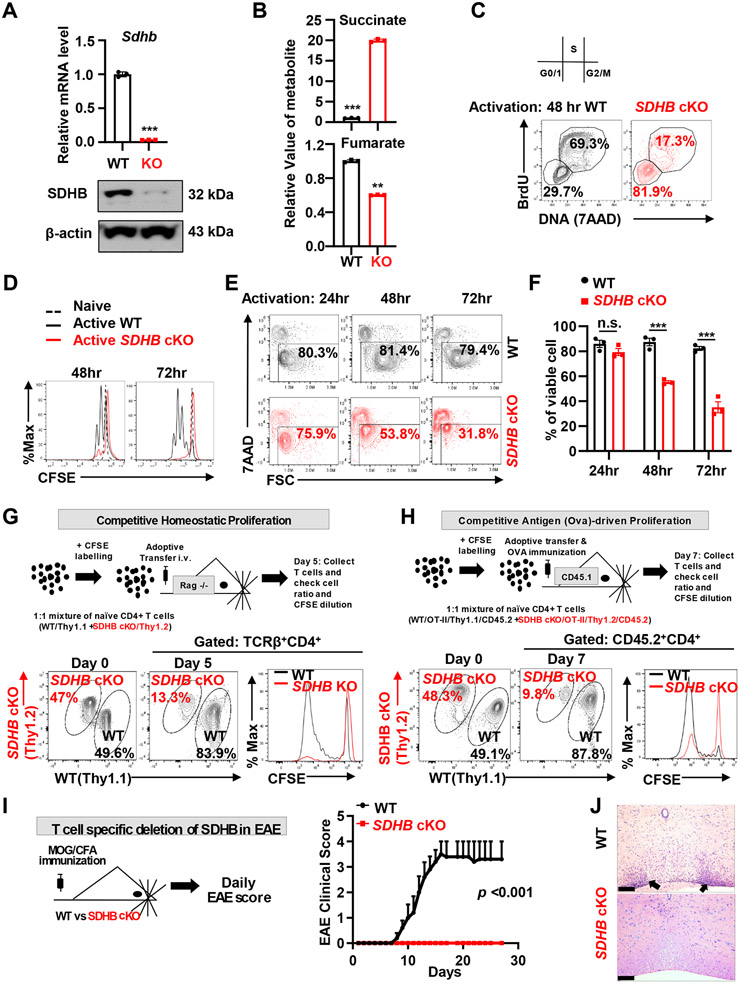
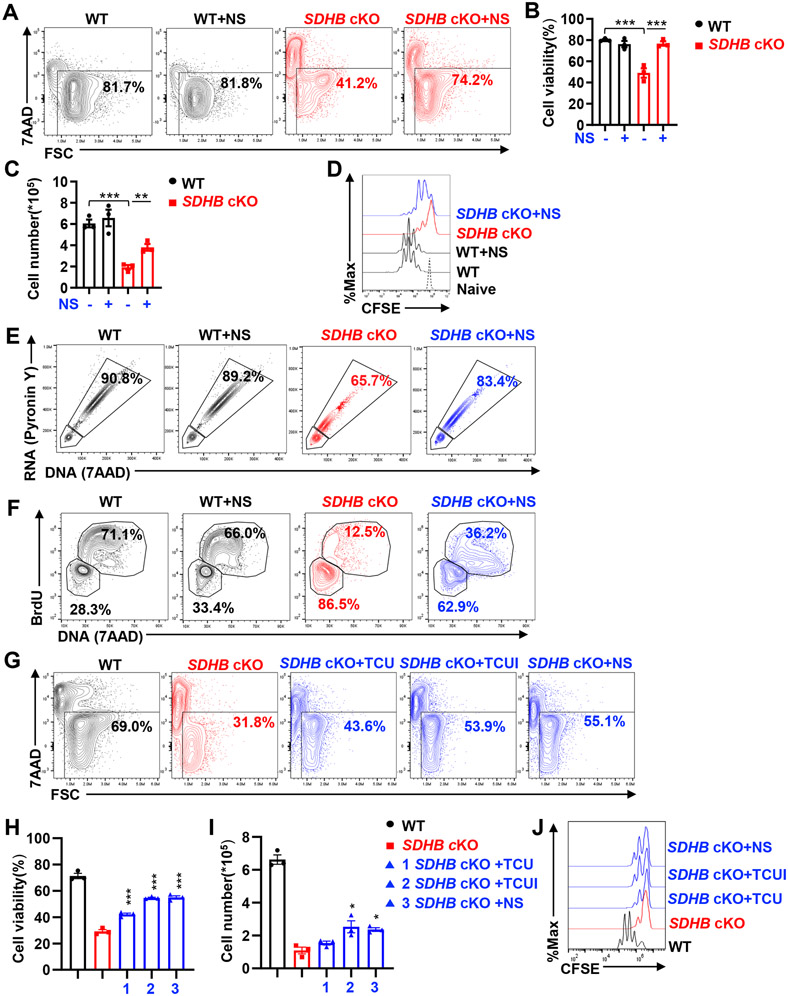
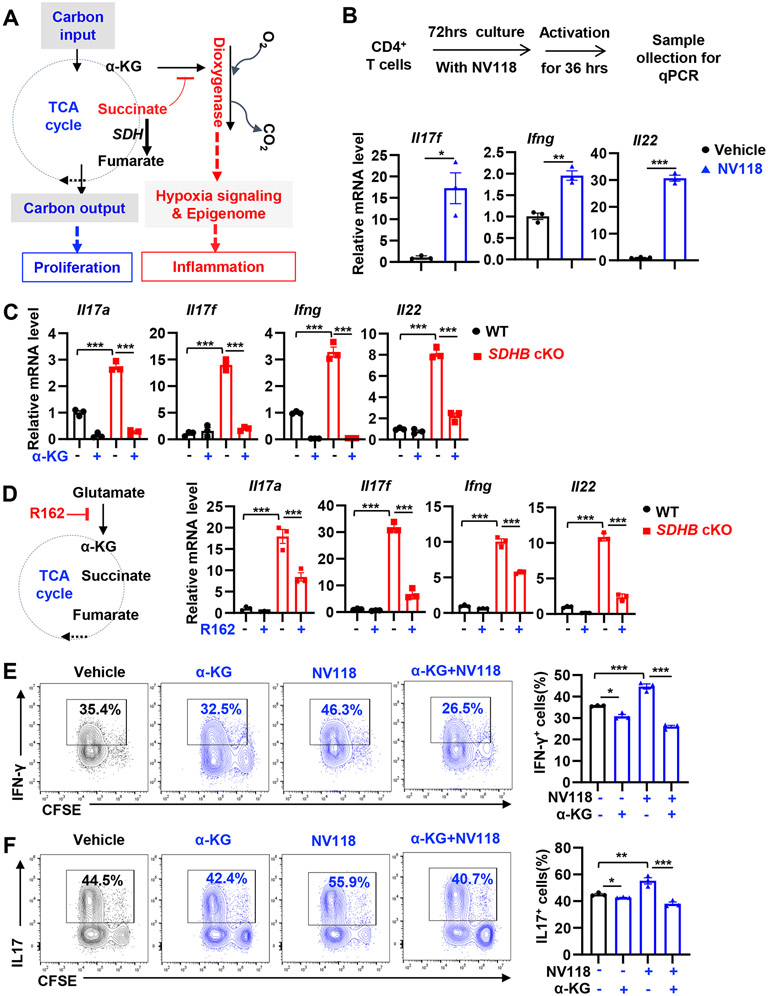
Effective T cell-mediated immune responses require the proper allocation of metabolic resources to sustain growth, proliferation, and cytokine production. Epigenetic control of the genome also governs T cell transcriptome and T cell lineage commitment and maintenance. Cellular metabolic programs interact with epigenetic regulation by providing substrates for covalent modifications of chromatin. By using complementary genetic, epigenetic, and metabolic approaches, we revealed that tricarboxylic acid (TCA) cycle flux fueled biosynthetic processes while controlling the ratio of succinate/α-ketoglutarate (α-KG) to modulate the activities of dioxygenases that are critical for driving T cell inflammation. In contrast to cancer cells, where succinate dehydrogenase (SDH)/complex II inactivation drives cell transformation and growth, SDH/complex II deficiency in T cells caused proliferation and survival defects when the TCA cycle was truncated, blocking carbon flux to support nucleoside biosynthesis. Replenishing the intracellular nucleoside pool partially relieved the dependence of T cells on SDH/complex II for proliferation and survival. SDH deficiency induced a proinflammatory gene signature in T cells and promoted T helper 1 and T helper 17 lineage differentiation. An increasing succinate/α-KG ratio in SDH-deficient T cells promoted inflammation by changing the pattern of the transcriptional and chromatin accessibility signatures and consequentially increasing the expression of the transcription factor, PR domain zinc finger protein 1. Collectively, our studies revealed a role of SDH/complex II in allocating carbon resources for anabolic processes and epigenetic regulation in T cell proliferation and inflammation.


Conflict of interest statement

Competing interests: All other authors declare no conflict of interest.

Figures

Figure 1.
Figure 1.. SDHB is required for the T cell proliferation and survival.
(A) SDHB mRNA and protein levels of the indicated T cells were determined by qPCR and Immunoblot (n=3), ***p < 0.001, Student’s t test. (B) Metabolites of the indicated T cells were determined by CE-QqQ/TOFMS (n=3), **p < 0.01, ***p < 0.001, Student’s t test. (C) The cell cycle profile of the indicated CD4+ T cells was analyzed by BrdU and 7AAD staining. The numbers indicate the percentage of cells in the cell cycle stage. (D) Cell proliferation of the indicated CD4+ T cells was determined by CFSE dilution. (E-F) Cell viability of the indicated CD4+ T cells was assessed by 7AAD uptake, n=3, data are representative of 3 independent experiments, n.s., not significant, ***p < 0.001, one-way ANOVA. T cells (B-F) were activated by the plate-bound anti-CD3/CD28 antibodies. (G) Diagram of in vivo competitive proliferation experimental procedure (top panel). The donor CD4+ T cell ratios before and after adoptive transfer were evaluated by surface staining of isogenic markers, and cell proliferation was evaluated by CFSE dilution (bottle panel). Representative flow plots of the donor T cells were gated from TCRβ+CD4+ cells and parsed by Thy1.1(WT) and Thy1.2(SDHB cKO). Data represent 3 independent experiments. (H) Diagram of in vivo antigen-specific competitive proliferation experimental procedure (top panel), the donor CD4+ T cell ratios before and after adoptive transfer were evaluated by surface staining of isogenic markers, and cell proliferation was evaluated by CFSE dilution (bottle panel). Representative flow plots of the donor T cells were gated from CD45.2+CD4+ cells and parsed by Thy1.1(WT) and Thy1.2(SDHB cKO). Data represent of 3 independent experiments. (I) Diagram of EAE experimental procedure (left panel), clinical scores were evaluated daily (right panel), n=5 mice for each group, experiments were repeated 3 times. (J) H&E staining of spinal cord sections from WT and SDHB cKO mice after EAE induction, leukocyte infiltration are marked by arrowheads. Scale bar, 200μm. Bar graphs, mean ± SEM.
Figure 2.
Figure 2.. SDHB deficiency decouples the TCA cycle from nucleoside biosynthesis.
(A-D) The catabolic activities of the indicated T cells were measured by the generation of 3H2O from Glucose, D-[5-3H(N)] (A), 14CO2 from D-Glucose, [1-14C] (B), 3H2O from Palmitic acid, [9,10-3H] (C), 14CO2 from [U-14C]-glutamine (D), n=3, data are representative of 2 independent experiments. n.s., not significant, **p < 0.01, ***p < 0.001, Student’s t test. (E) Diagram of [13C5]-Glutamine catabolism through entering the downstream TCA cycle, aspartate synthesis and pyrimidine biosynthesis. α-KG: α-ketoglutarate; XMP: uridine, cytidine and thymidine monophosphate; SDH: Succinate dehydrogenase; ●: denoted the 13C label of all carbons of indicated metabolites that are derived from [13C5]-glutamine catabolism. Solid and dashed arrows represent single- and multi-step reactions (left panel), metabolites were extracted and analyzed using IC-UHR-FTMS (right panel), numbers in the X-axis represent those of 13C atoms in given metabolites, and numbers in the Y-axis represent the levels of the metabolites (μmole/g protein). n=3 from one experiment, *p < 0.05, ***p < 0.001, two-way ANOVA. UMP/UDP: uridine mono/diphosphate; dUMP deoxyuridine monophosphate; CMP/CDP: uridine mono/diphosphate; dTMP: deoxythymidine monophosphate; (F) The incorporation of carbon from 14C-glutamine into DNA and RNA was determined by the isotope uptake, n=3, data are representative of 2 independent experiments. *p < 0.05, Student’s t test. (G) Metabolites of the indicated T cells were determined by CE-QqQ/TOFMS and depicted in the Heatmap. (H) DNA and RNA content of the indicated CD4+ T cells were determined by the 7AAD and pyronin-Y uptake. Bar graphs, mean ± SEM. T cells were activated by the plate-bound anti-CD3/CD28 antibodies.
Figure 3.
Figure 3.. Nucleoside supplementation partially compensates for the loss of de novo biosynthesis of nucleotides in SDHB cKO T cells.
(A-D) CD4+ T cells were activated for 72 hrs with or without nucleosides (NS: adenosine, guanosine, thymidine, cytidine, uridine and inosine), cell viability was calculated based on the 7AAD staining (A-B), cell number was measured by a cell counter (C), cell proliferation was determined by CFSE dilution (D), n=3, data are representative of 3 independent experiments, **p < 0.01, ***p < 0.001, one-way ANOVA. (E) DNA and RNA content of the indicated T cells (plate-bound anti-CD3/CD28 activation for 36 hrs) were determined by the 7AAD and pyronin staining. (F) The cell cycle profile of the indicated T cells (plate-bound anti-CD3/CD28 activation for 48 hrs) was analyzed by BrdU and 7AAD staining. (G-J) CD4+ T cells were activated for 72 hrs with TCU (thymidine, cytidine and uridine), TCUI (thymidine, cytidine, uridine and inosine), or NS, cell viability was determined by the 7AAD uptake (G-H), and cell number was measured by a cell counter (I), cell proliferation was determined by CFSE dilution (J), n=3, data are representative of 3 independent experiments, *p < 0.05, ***p < 0.001, one-way ANOVA. Bar graphs, mean ± SEM. T cells were activated by the plate-bound anti-CD3/CD28 antibodies.
Figure 4.
Figure 4.. SDHB deficiency promotes a pro-inflammatory gene signature in T cells after activation.
(A-C) Transcriptomic analysis of RNA-seq data in activated CD3+ T cells (30h). (A) Volcano plot. The log2 FC indicates the mean expression level for each gene. Each dot represents one gene. Red dots represent up-regulated genes; black dots represent down-regulated genes; the blue dots indicate presentative genes in the hallmark gene sets. Highlighted genes (A) were selected based on genes of interest. (B) The most up-regulated pathways were identified by ingenuity pathway analysis (IPA). (C) The signature of differentially expressed genes was identified by GSEA. (D) mRNA levels of indicated genes were determined by qPCR, n=3, data are representative of 3 independent experiments, *p < 0.05, ***p < 0.001, one-way ANOVA. (E) CD4+ T cells were activated for 36 hrs with indicated treatment, mRNA levels of indicated genes were measured by qPCR, n=3, data are representative of 3 independent experiments, n.s., not significant, ***p < 0.001, one-way ANOVA. (F) Cell culture media from the indicated T cell groups (36 hrs after activation) were collected, mixed with fresh medium at 1:1 ratio, and then were used for culturing WT T cells for 36 hrs under activation condition (left panel), mRNA levels of indicated genes were measured by the qPCR (right panel), n=3, data are representative of 2 independent experiments, n.s., not significant, *p < 0.05, Student’s t test. Bar graphs, mean ± SEM. NS: nucleosides. T cells were activated by the plate-bound anti-CD3/CD28 antibodies.
Figure 5.
Figure 5.. Increasing the intracellular succinate/α-KG ratio promotes pro-inflammatory signature in T cells after activation.
(A) Schematic diagram of succinate-mediated metabolic, signaling, and epigenetic regulation of T cell proliferation and inflammation. (B) CD4+ T cells were cultured with 100μM cell permeable succinate (NV118) followed by activation as indicated in the experimental diagram (top panel), mRNA levels of indicated genes were measured by qPCR (bottom panel, n=3, data are representative of 3 independent experiments, *p < 0.05, **p < 0.01, ***p < 0.001, student’s t test. (C) CD4+ T cells were activated for 36 hrs with or without 10mM α-KG, mRNA levels of indicated genes were measured by qPCR, n=3, data are representative of 3 independent experiments, ***p<0.001, one-way ANOVA. (D) Schematic diagram of R162’s action and glutamine catabolism (left panel), CD4+ T cells were activated for 36 hrs with indicated treatments, mRNA levels of indicated genes were measured by the qPCR (right panel), n=3, data are representative of 2 independent experiments, ***p < 0.001, one-way ANOVA. T cells (B-D) were activated by the plate-bound anti-CD3/CD28 antibodies. (E-F) CD4+ T cells were polarized toward TH1 (E) and TH17 (F) lineages for 72 hrs with indicated treatments (2mM α-KG and 25μM NV118). The indicated proteins were quantified by intracellular staining by flow cytometry. Cell proliferation was determined by CFSE staining, n=3, data are representative of 3 independent experiments, *p<0.05, **p<0.01, ***p<0.001, one-way ANOVA. Bar graphs, mean ± SEM.
Figure 6.
Figure 6.. SDHB deficiency increases the level of succinate to enhance DNA accessibility and pro-inflammatory genes transcription.
(A) Differential chromatin accessibility was measured by ATAC-seq in activated CD4+ T cells between indicated genotypes (n=3 replicates for each genotype), identifying 8,543 sites with accessibility gain and 1,521 sites with accessibility loss in activated SDHB cKO T cells. (B) ATAC-seq peaks with differential accessibility were linked to nearby genes, and ontology analysis was performed using GREAT. (C) Accessibility changes in differential ATAC-seq peaks were plotted against expression changes (CD4+ T cells RNA-seq) in the nearby genes identified in (B), concordant changes (i.e., enhanced expression and accessibility) were observed among pro-inflammatory genes and master transcription factors mediating inflammation. (D) Motif analysis was performed on ATAC-seq peaks showing enhanced accessibility in activated SDHB cKO CD4+ T cells. A volcano plot shows up-regulated expression of many cognate transcription factors by RNA-seq. Highlighted genes (C&D) were selected based on genes of interest. (E) mRNA levels of transcription factors in the indicated CD4+ T cells were depicted in the Heatmap, (n=3 replicates for each group). (F) CD4+ T cells were activated for 36 hrs with or without 10mM α-KG, Blimp1 protein levels were measured by intracellular staining by flow cytometry, MFI was analyzed, n=3, data are representative of 3 independent experiments, **p<0.01, ***p<0.001, one-way ANOVA. (G) CD4+ T cells were maintained in naïve condition with 100μM NV118 for 72 hrs and then activated for 36 h, Blimp1 protein levels were measured by intracellular staining by flow cytometry, MFI was analyzed, n=3, data are representative of 3 independent experiments, **p<0.01, student’s t test. Bar graphs, mean ± SEM. T cells were activated by the plate-bound anti-CD3/CD28 antibodies.
Figure 7.
Figure 7.. Succinate-mediated Prdm1/Blimp1 expression contributes to proinflammatory signature in T cells.
(A) CD4+ T cells were activated overnight, then electroporated with gPrdm1 and Cas9, cells were recovered in culture medium for 2 hrs prior to activation for 40 hrs (top panel), Blimp-1 protein levels were measured by intracellular staining by flow cytometry (bottle panel), n=3, data are representative of 2 independent experiments, **p < 0.01, one-way ANOVA. (B) CD4+ T cells were electroporated with gPrdm1 and Cas9, mRNA levels of indicated genes were determined by qPCR, n=3, data are representative of 2 independent experiments, n.s., not significant, **p < 0.01, ***p < 0.001, one-way ANOVA. (C-D) CD4+ T cells were activated overnight, then electroporated with gPrdm1 and Cas9. Cells were then polarized toward TH1 (C) and TH17 (D) lineages for 72 hrs with or without 25μM NV118. The indicated proteins were quantified by intracellular staining by flow cytometry, cell proliferation was determined by CFSE staining. n=3, data are representative of 2 independent experiments, ***p < 0.001, one-way ANOVA. Bar graphs, mean ± SEM. T cells were activated by the plate-bound anti-CD3/CD28 antibodies.

References

    1. Sena LA, Li S, Jairaman A, Prakriya M, Ezponda T, Hildeman DA, Wang CR, Schumacker PT, Licht JD, Perlman H, Bryce PJ, Chandel NS, Mitochondria are required for antigen-specific T cell activation through reactive oxygen species signaling. Immunity 38, 225–236 (2013). - PMC - PubMed
    1. Gerriets VA, Rathmell JC, Metabolic pathways in T cell fate and function. Trends Immunol 33, 168–173 (2012). - PMC - PubMed
    1. Pearce EL, Pearce EJ, Metabolic pathways in immune cell activation and quiescence. Immunity 38, 633–643 (2013). - PMC - PubMed
    1. Dang CV, MYC, metabolism, cell growth, and tumorigenesis. Cold Spring Harbor perspectives in medicine 3, (2013). - PMC - PubMed
    1. Pavlova NN, Thompson CB, The Emerging Hallmarks of Cancer Metabolism. Cell Metab 23, 27–47 (2016). - PMC - PubMed

Publication types

Supplementary concepts