. 2022 Apr 29;8(17):eabm3108.
doi: 10.1126/sciadv.abm3108. Epub 2022 Apr 29.

A novel β-catenin/BCL9 complex inhibitor blocks oncogenic Wnt signaling and disrupts cholesterol homeostasis in colorectal cancer

Affiliations

A novel β-catenin/BCL9 complex inhibitor blocks oncogenic Wnt signaling and disrupts cholesterol homeostasis in colorectal cancer

Helen Tanton et al. Sci Adv. .

Abstract

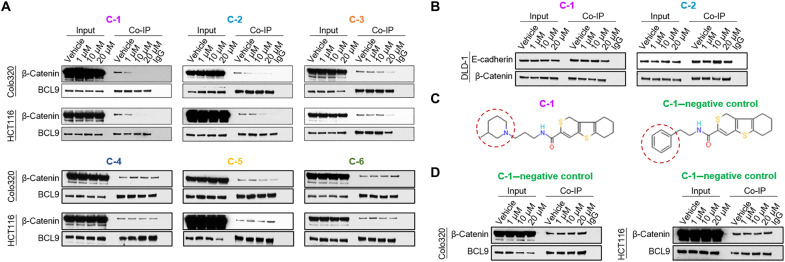
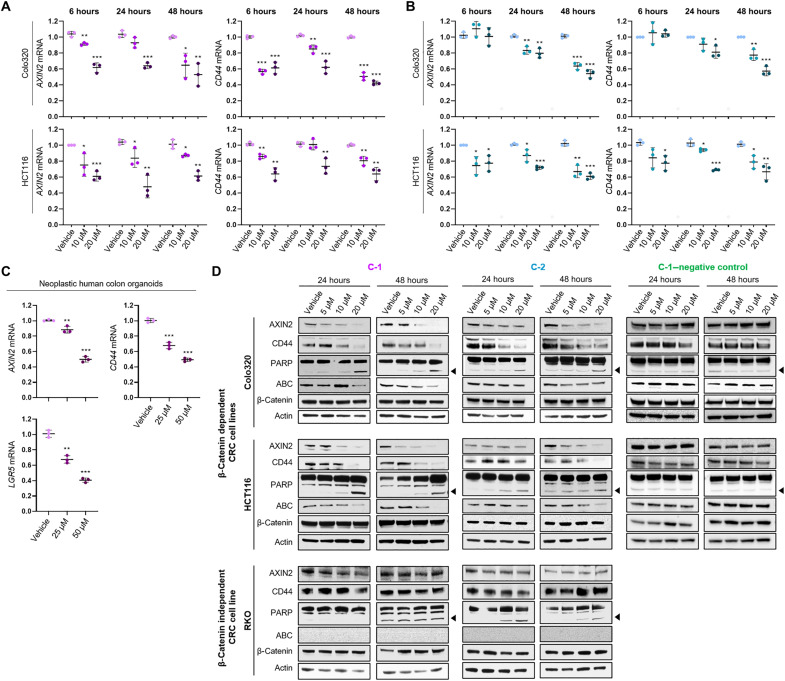
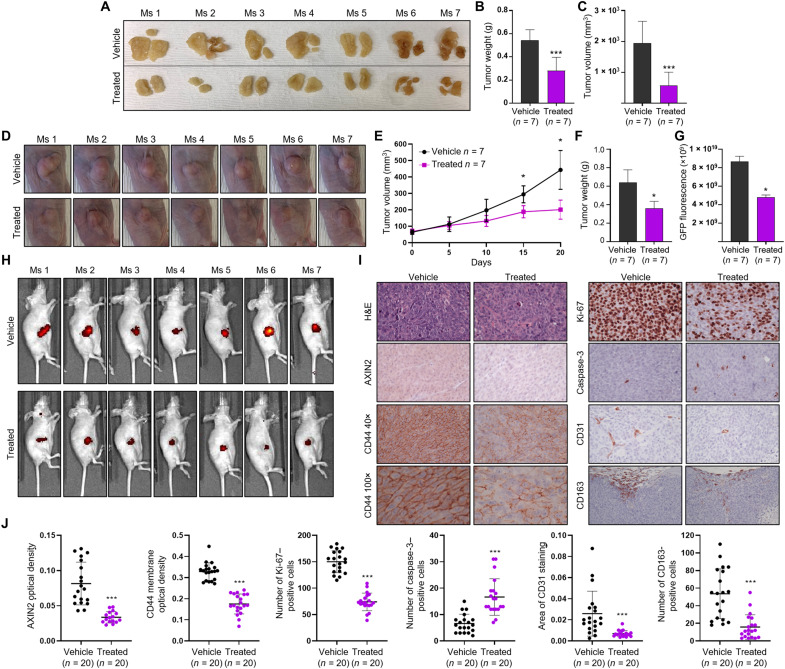
Dysregulated Wnt/β-catenin signaling is implicated in the pathogenesis of many human cancers, including colorectal cancer (CRC), making it an attractive clinical target. With the aim of inhibiting oncogenic Wnt activity, we developed a high-throughput screening AlphaScreen assay to identify selective small-molecule inhibitors of the interaction between β-catenin and its coactivator BCL9. We identified a compound that consistently bound to β-catenin and specifically inhibited in vivo native β-catenin/BCL9 complex formation in CRC cell lines. This compound inhibited Wnt activity, down-regulated expression of the Wnt/β-catenin signature in gene expression studies, disrupted cholesterol homeostasis, and significantly reduced the proliferation of CRC cell lines and tumor growth in a xenograft mouse model of CRC. This study has therefore identified a specific small-molecule inhibitor of oncogenic Wnt signaling, which may have value as a probe for functional studies and has important implications for the development of novel therapies in patients with CRC.


Figures

Fig. 1.
Fig. 1.. Identification of β-catenin/BCL9 inhibitors.
(A) Schematic of the AlphaScreen assay that detects BCL9-HD2/β-catenin complex formation/disruption. (B) Ten-dose response of the AlphaScreen assay with BCL9-HD2 peptide and SAH-BCL9 (stapled BCL9-HD2 peptide). (C) Z′ evaluation of the screen comparing signal upon inhibition with an excess of BCL9-HD2. (D) Frequency plot of the distribution of the activity data from each well normalized to controls and expressed as percentage of inhibition relative to fully inhibited positive controls (no β-catenin in the assay or excess of nonbiotinylated BCL9-HD2 peptide). This frequency plot shows relatively normal distributions for both positive and negative (full binding of β-catenin to BCL9-HD2) controls and centroid of the compound activities, with some tailing to higher activity, consistent with the hit finding ability of this assay. (E) Scatterplot confirming the relative “flatness” of the main centroid of 0% compound activity with slight oscillations likely due to plate-to-plate variability and minor “edge” effects. (F) Ten-dose response AlphaScreen assay of BCL9 peptide (positive control) and five top-performing compounds: E722-2648 (C-1), L814-1428 (C-2), SYN22094413 (C-3), L859-1770 (C-4), and F838-0143 (C-5) titrated against full-length β-catenin (left) and BRD9 (right). (G) ITC of BCL9 peptide, C-1, C-2, C-3, C-4, and C-5. (H) Computational model of a molecularly docked β-catenin/C-1 complex. Ribbon (left), electrostatic surface contoured from −5 to +5 kT/e (middle), and ligand interaction map (right) representations of the lowest energy pose from an extra-precision Glide analysis of C-1 docked into the BCL9 pocket of the 3SL9 structure. All error bars represent means ± SD.
Fig. 2.
Fig. 2.. In vivo β-catenin/BCL9 complex formation in response to lead compounds.
(A) Immunoblots from BCL9 Co-IP assays of Colo320 and HCT116 cell lines, treated with vehicle, C-1, C-2, C-3, C-4, C-5, or C-6. Input samples (2%) are shown on the left-hand side of each panel. Samples incubated with normal rabbit immunoglobulin G (IgG) antibody are shown on the right-hand side of each panel. (B) Immunoblots from β-catenin Co-IP assays of the DLD-1 cell line, treated with vehicle, and two top-performing compounds (C-1 and C-2). Input samples (2%) are shown on the left-hand side of each panel. Samples incubated with normal rabbit IgG antibody are shown on the right-hand side of each panel. (C) The chemical structures of compound C-1 and the C-1–negative control. The red dashed circles highlight the part of the structure that differs in these two compounds. (D) Immunoblots from BCL9 Co-IP assays of Colo320 and HCT116 cell lines, treated with vehicle or increasing concentrations of the C-1–negative control compound. Input samples (2%) are shown on the left-hand side of each panel. Samples incubated with normal rabbit IgG antibody are shown on the right-hand side of each panel.
Fig. 3.
Fig. 3.. The expression of Wnt target genes in response to lead compounds.
(A and B) RT-qPCR of Colo320 and HCT116 cell lines treated with vehicle or increasing concentrations of C-1 (A) and C-2 (B) for 6, 24, and 48 hours for the Wnt target genes AXIN2 (left) and CD44 (right). The data demonstrate the relative fold change normalized to housekeeping genes (B2M and PMM1) and to the vehicle (ΔΔCT). Error bars represent means ± SD of triplicate experiments. (C) RT-qPCR of neoplastic human colon organoids treated with vehicle or increasing concentrations of C-1 for 24 hours for the Wnt target genes, AXIN2, CD44, and LGR5. The data demonstrate the relative fold change normalized to housekeeping genes (GAPDH) and to the vehicle (ΔΔCT). Error bars represent means ± SD of triplicate experiments. (D) Immunoblots of the β-catenin–dependent cell lines, Colo320 and HCT116, and the β-catenin–independent cell line, RKO, treated with vehicle and increasing concentrations of C-1, C-2, or the C-1–negative control compound for 24 and 48 hours. For PARP, the full-length protein (upper bands) and cleaved PARP (lower bands indicated by arrow) are shown. Actin is shown as a loading control. *P > 0.05, **P > 0.01, and ***P > 0.001.
Fig. 4.
Fig. 4.. Wnt activity and Wnt/β-catenin gene signatures in response to lead compounds.
(A) Wnt reporter assay of Colo320 and HCT116 cells, treated for 16 hours with increasing concentrations of ICG-001 (positive control), the two lead compounds in this study, C-1 and C-2, and the C-1–negative control compound. The data demonstrate the respective firefly/renilla luciferase ratios normalized to that of vehicle-treated cells. Error bars represent means ± SD of triplicate experiments. (B) Gene expression profiling of HCT116 cells treated for 48 hours with vehicle or 20 μM C-1 (in triplicate). (B) Differentially expressed genes between control and C-1–treated HCT116 cells at FDR <0.01. (C) GSEA mountain plots and respective heat maps of the leading edge genes for the β-catenin/TCF target gene signatures in CRCs and colorectal adenomas (50), and for the leading edge genes for the cholesterol homeostasis (MSigDB H) gene signature (51). (D) GSEA mountain plots for the up- and down-regulated gene signatures in HCT116 cells following TCF7L2 KO (52), and the down-regulated gene signature in a BCL9/B9L KO mouse model of CRC (53). *P > 0.05, **P > 0.01, and ***P > 0.001.
Fig. 5.
Fig. 5.. Cholesterol trafficking and esterification after C-1 treatment.
(A) Representative fluorescent images of lipids (BODIPY) and nuclei (DAPI) in HCT116 cells treated with vehicle, 20 μM C-1, or the cholesterol inhibitor U-18666A for the time points indicated. Scale bars, 50 μm. (B) Representative fluorescent images of filipin III–stained cholesterol in HCT116 cells treated with vehicle and 20 μM C-1 for the time points indicated. Scale bars, 50 μm. (C) Representative fluorescent images of HCT116 cells treated with vehicle or 20 μM C-1 for 48 hours and stained for filipin (cholesterol) and SERCA-ATPase (ER) (left) or LipidSpot (lipid droplets) (right). Scale bars, 50 μm. (D) Measurements of esterified cholesterol in HCT116 and Colo320 cells treated with vehicle and 20 μM C-1 for the time points indicated. Esterified cholesterol is normalized to the cell’s respective viability measurements. Error bars represent means ± SD of triplicate experiments. (E) Viability measurements of HCT116 and Colo320 cells treated with the compounds indicated (20 μM) for 48 hours. Lov, lovastatin; Ava, avasimibe. Error bars represent means ± SD of triplicate experiments. (F) Viability measurements of HCT116 and Colo320 cells treated with the compounds indicated (20 μM) ± cholesterol (chol; 20 μM) for 48 hours. Error bars represent means ± SD of triplicate experiments. (G) Immunoblots of cleaved and uncleaved SREBP2 in HCT116 cells treated with vehicle or 20 μM C-1 for the time points indicated (right) and densitometry analysis of cleaved SREBP2 normalized to respective actin measurements (left). Actin is shown as a loading control. Error bars represent means ± SD of triplicate experiments. *P > 0.05, **P > 0.01, and ***P > 0.001.
Fig. 6.
Fig. 6.. The effect of lead compounds on the proliferation of CRC cell lines.
The proliferation of the β-catenin–dependent cell lines, Colo320 and HCT116 (A), and the β-catenin–independent cell line, RKO (B), was measured after treatment with vehicle and increasing concentrations of C-1, C-2, or the C-1–negative control for 24, 48, 72, and 96 hours. Error bars represent means ± SD of triplicate experiments. (C) The proliferation of neoplastic human colon organoids treated with vehicle and increasing concentrations of C-1 for 24 and 48 hours (left). Representative images of the organoids treated with the concentrations of C-1 indicated for 24 hours (right). Black arrows indicate apoptotic organoids.
Fig. 7.
Fig. 7.. The effect of C-1 on tumor growth in a xenograft mouse model of CRC.
(A) Images of dissected tumors from mice treated with vehicle (n = 7) or C-1 (n = 7) via intraperitoneal injections. (B and C) Tumor weight and tumor volume of mice treated with vehicle (n = 7) or C-1 (n = 7) via intraperitoneal injections. Error bars represent means ± SD. (D) Images of subcutaneous tumors, taken on day 20 of the study, from mice treated with vehicle (n = 7) or C-1 (n = 7) via intratumoral injections. (E) Body weight (top) and tumor volume (bottom) of mice treated with vehicle (n = 7) or C-1 treated (n = 7) via intratumoral injections. Error bars represent means ± SD. (F and G) Tumor weight and tumor GFP fluorescence measurements recorded from mice treated with vehicle (n = 7) or C-1 (n = 7), via intratumoral injections. Error bars represent means ± SD. (H) GFP fluorescence images of intratumoral vehicle and C-1–treated mice taken on day 20. (I) Representative hematoxylin and eosin (H&E) and IHC stains of AXIN2, CD44, Ki-67, cleaved caspase-3, CD31, and CD163 in tumor tissue from intratumoral vehicle- and C-1–treated mice. Scale bars, 50 μm. (J) Quantification of AXIN2, CD44, Ki-67, CD31, cleaved caspase-3, and CD163 immunostains in the tumors of intratumoral vehicle- and C-1–treated mice. Plots represent individual data points with error bars representing means ± SD. *P > 0.05 and ***P > 0.001.
Fig. 8.
Fig. 8.. Model of C-1 mechanism of action.
Our data from this study are consistent with a model in which C-1 treatment specifically inhibits β-catenin/BCL9 complex formation in CRC cells and reduces cell proliferation and survival, which would otherwise be amplified by oncogenic Wnt signaling in the absence of C-1. C-1 treatment also increases cholesterol esterification and intracellular accumulation of lipid droplets and cholesterol (1), which decreases activation (i.e., cleavage) of SREBP2 (2) and subsequently disrupts the cholesterol homeostasis gene expression signature in the cell (3). These processes are concurrent with the depletion of lipids and cholesterol from the plasma membrane, which may decrease the number of lipid rafts and membrane fluidity/integrity.

References

    1. Logan C. Y., Nusse R., The Wnt signaling pathway in development and disease. Annu. Rev. Cell Dev. Biol. 20, 781–810 (2004). - PubMed
    1. Steinhart Z., Angers S., Wnt signaling in development and tissue homeostasis. Development 145, dev146589 (2018). - PubMed
    1. Clevers H., Nusse R., Wnt/β-catenin signaling and disease. Cell 149, 1192–1205 (2012). - PubMed
    1. Klaus A., Birchmeier W., Wnt signalling and its impact on development and cancer. Nat. Rev. Cancer 8, 387–398 (2008). - PubMed
    1. Sukhdeo K., Mani M., Hideshima T., Takada K., Pena-cruz V., Mendez G., Ito S., Anderson K. C., Carrasco D. R., β-catenin is dynamically stored and cleared in multiple myeloma by the proteasome-aggresome-autophagosome-lysosome pathway. Leukemia 26, 1116–1119 (2012). - PMC - PubMed

LinkOut - more resources