. 2022 Apr 29;8(17):eabl6339.
doi: 10.1126/sciadv.abl6339. Epub 2022 Apr 29.

Overcoming differential tumor penetration of BRAF inhibitors using computationally guided combination therapy

Affiliations

Overcoming differential tumor penetration of BRAF inhibitors using computationally guided combination therapy

Thomas S C Ng et al. Sci Adv. .

Abstract

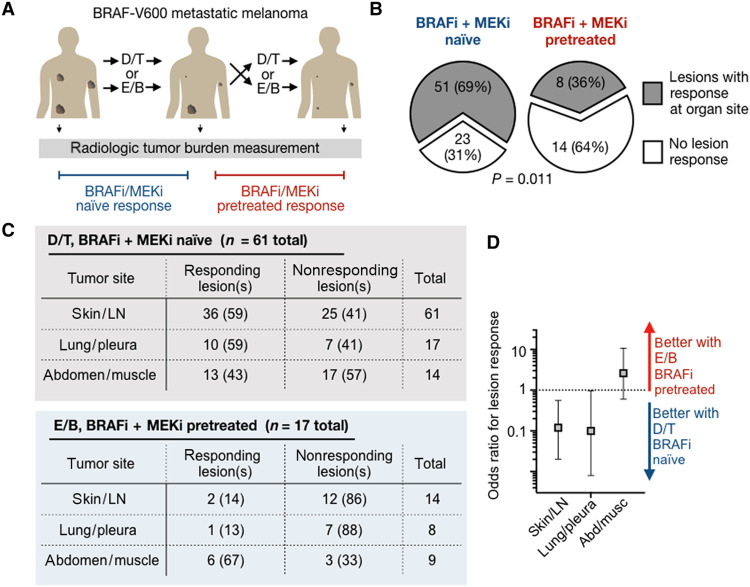
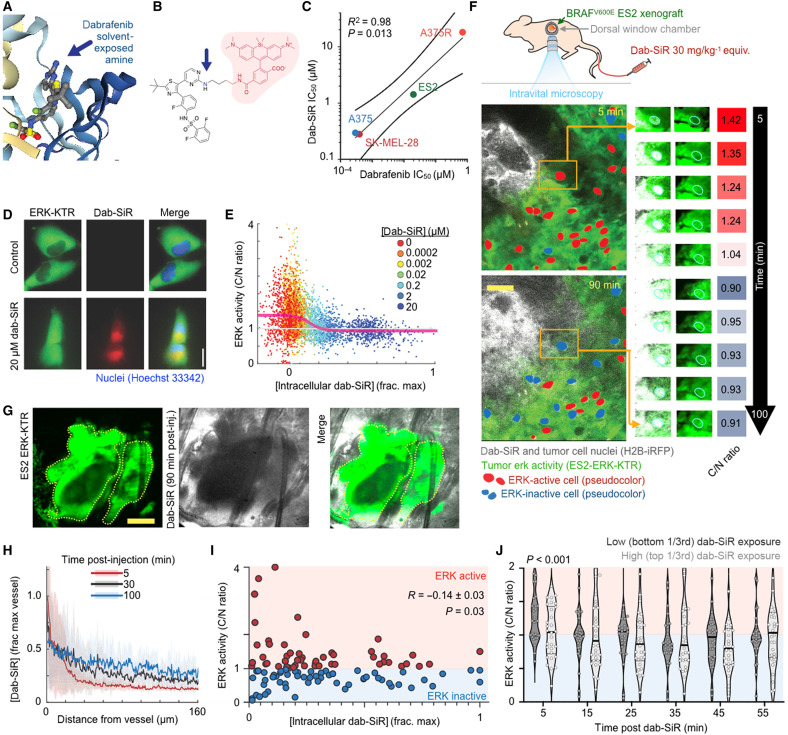
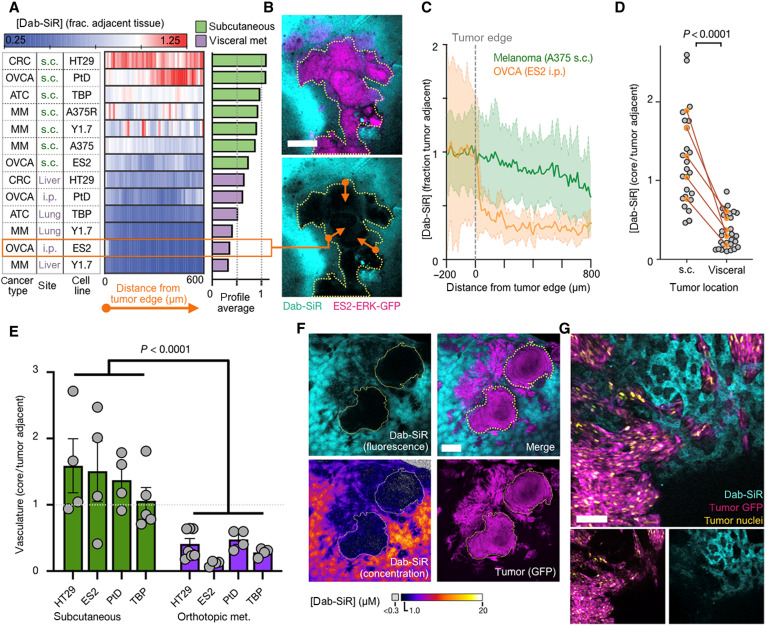
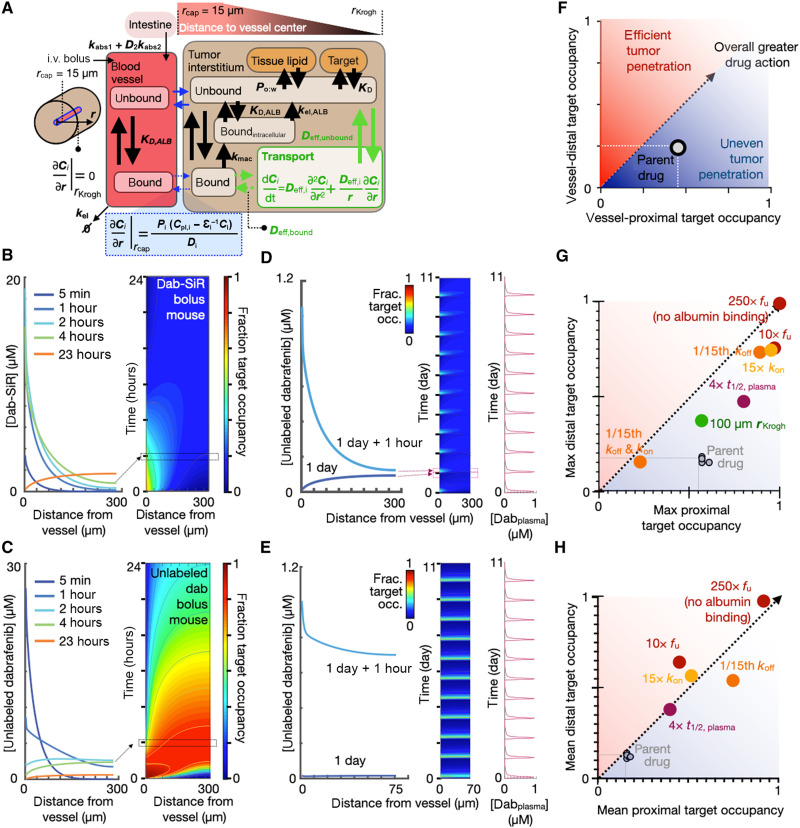
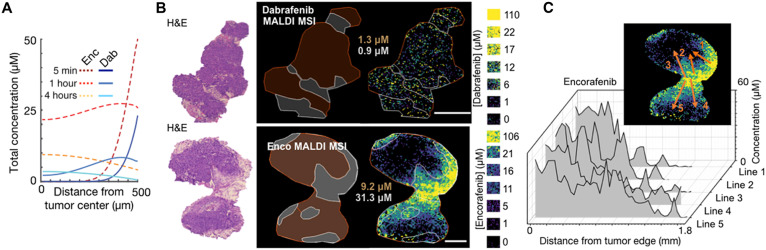
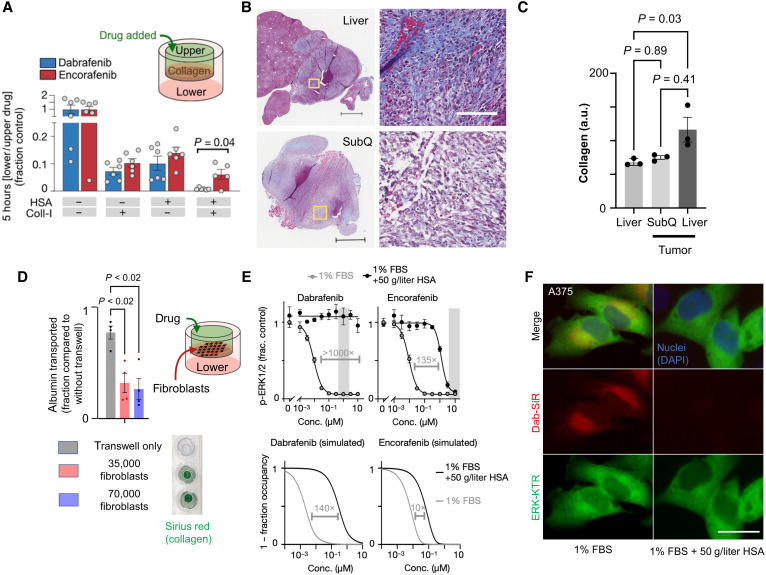
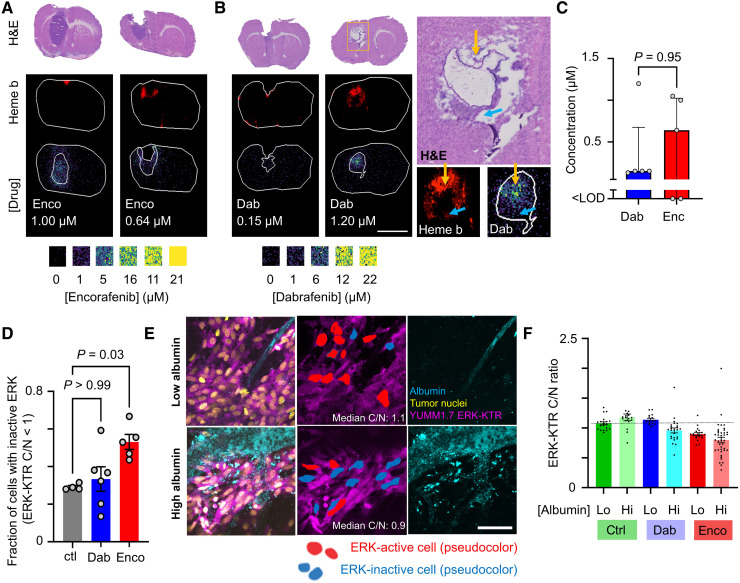
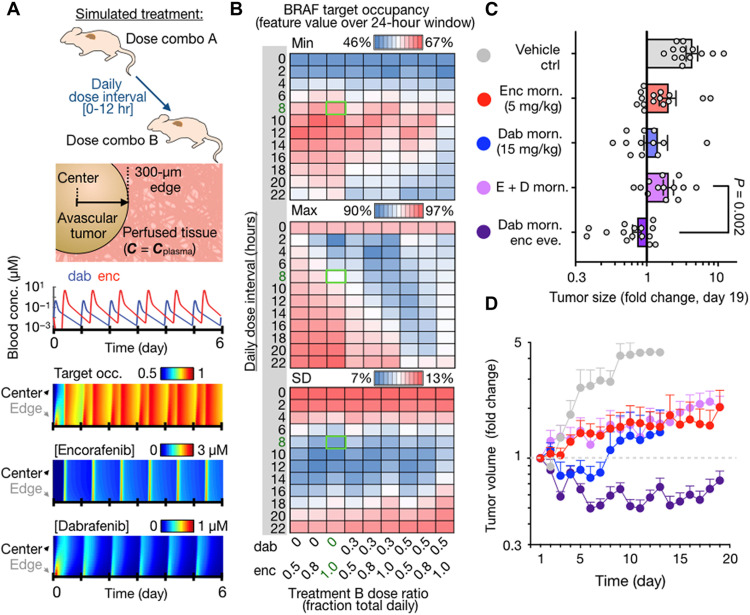
BRAF-targeted kinase inhibitors (KIs) are used to treat malignancies including BRAF-mutant non-small cell lung cancer, colorectal cancer, anaplastic thyroid cancer, and, most prominently, melanoma. However, KI selection criteria in patients remain unclear, as are pharmacokinetic/pharmacodynamic (PK/PD) mechanisms that may limit context-dependent efficacy and differentiate related drugs. To address this issue, we imaged mouse models of BRAF-mutant cancers, fluorescent KI tracers, and unlabeled drug to calibrate in silico spatial PK/PD models. Results indicated that drug lipophilicity, plasma clearance, faster target dissociation, and, in particular, high albumin binding could limit dabrafenib action in visceral metastases compared to other KIs. This correlated with retrospective clinical observations. Computational modeling identified a timed strategy for combining dabrafenib and encorafenib to better sustain BRAF inhibition, which showed enhanced efficacy in mice. This study thus offers principles of spatial drug action that may help guide drug development, KI selection, and combination.


Figures

Fig. 1.
Fig. 1.. Patients exhibit distinct responses to BRAFi + MEKi following prior KI treatment.
(A) Responses of tumor lesions to D/T or E/B were retrospectively analyzed across 81 pretreated or naïve patients. (B) Individual tumor responses were compared between pretreated and naïve cohorts (number of patients and Fisher’s exact test P value shown). (C) Responses of individual tumor lesions to D/T in BRAFi/MEKi-naïve patients or E/B in BRAFi/MEKi-pretreated patients were retrospectively analyzed by radiologic imaging. Lesion responses were binned according to organ site in patients with metastatic melanoma, reported as the number of organ sites showing lesion response and corresponding percentages in parentheses. (D) Odds ratios (means ± 95% CI) are shown corresponding to data in (C).
Fig. 2.
Fig. 2.. Companion dabrafenib imaging reveals heterogeneous single-cell PK/PD.
(A and B) Crystal structure of dabrafenib bound to BRAFV600E (A) (Protein Data Bank: 5CSW) and corresponding design of the near-infrared companion imaging drug, dab-SiR (B). (C) Dabrafenib and dab-SiR were compared across BRAFV600E cell lines by 72-hour cytotoxicity (Pearson’s correlation and two-tailed t test reported; n = 2 reps). (D and E) Representative imaging of ES2-ERK-KTR cells treated ± dab-SiR for 2 hours (D) and corresponding cytoplasm-to-nucleus (C/N ratio) quantification (E) (n > 30 cells per condition); line denotes moving average of single-cell data. (F and G) Intravital microscopy of ES2 xenograft response to dab-SiR (30 mg/kg) using female nu/nu dorsal window chamber model at ×20 (F) (scale bar, 100 μm) and ×2 (G) (scale bar, 1 mm) magnification. Inset highlights single-cell response and corresponding quantification. (H to J) Drug concentration profile (H), ERK activity (I), and response after binning by drug exposure (J) were quantified from data as in (F). Data are means ± SE across three tumors and 90 cells. Two-way ANOVA (J) (n = 60 total cells) was used.
Fig. 3.
Fig. 3.. Dab-SiR penetration into solid tumors correlates with anatomical context and vascularization.
(A to D) Mean radial line profiles quantify dab-SiR concentration as a function of distance from the tumor edge (A) (n ≥ 2 tumors per model), with representative omentum metastasis from ES2 (B) (scale bar, 100 μm) and individual line profiles (C) (thick line and shading denote means ± SE). Orange arrows illustrate radial profiles (multiple averaged per tumor). (D) Using models as in (A), dab-SiR was quantified in tumor center regions versus adjacent tissue, shown as individual tumor measurements (gray) and average values for matched subcutaneous (s.c.) and visceral metastasis models (two-tailed t test). i.p., intraperitoneally. (E) Corresponding to images as in (A), lectin was quantified in tumor center regions versus adjacent tissue, shown as individual tumor measurements (gray) and average values for matched subcutaneous and visceral metastasis models (P < 0.001, two-way ANOVA; n = 36 total tumors). (F and G) Confocal microscopy of dab-SiR in YUMMER1.7 (Y1.7) melanoma tumors in the liver at ×2 (F) (scale bar, 1 mm) and ×20 (G) (scale bar, 100 μm) magnification.
Fig. 4.
Fig. 4.. Multicompartmental kinetic modeling identifies albumin binding as an important factor for BRAFi tumor penetration.
(A) Computational model schematic (tables S2 to S4 contain full equations and parameters). (B and C) Tumor concentration (left) and drug-target occupancy (right) of dab-SiR (B) and unlabeled parent dabrafenib (C) as a function of distance from tumor capillary and over time, modeled as a bolus [30 mg/kg, intravenously (i.v.)] in mice at t = 0. (D and E) Dabrafenib drug penetration over time and space, modeled with daily oral administration (30 mg/kg) in mice. Peak (+1 hour) and trough plasma concentrations at 1 and 5 days after treatment initiation are depicted, for poorly vascularized (D) (rKrogh = 300 μm) and well-vascularized (E) (rKrogh = 70 μm) tumors. (F to H) Parameter sensitivity analysis identifies factors affecting drug action for maximal (G) and mean (H) dabrafenib target occupancy, in cells nearest (x axis) or furthest (y axis) from vessels. Model parameters were adjusted as indicated, and results were compared to the model for parent dabrafenib depicted in (C).
Fig. 5.
Fig. 5.. Encorafenib and dabrafenib exhibit distinct heterogeneous tumor penetration.
(A) Simulation of parent dabrafenib or encorafenib, given by intravenous bolus in mice, and their penetration from a fully perfused margin into the avascular center of a 1-mm spherical tumor. (B) Representative mass spectrometry imaging (MALDI MSI) of unlabeled dabrafenib and encorafenib and corresponding standard tissue phantoms (calibration curves shown in fig. S9). Tissues were analyzed 4 hours after injection in the subcutaneous YUMMER1.7 melanoma model. Regions highlighting dense tumor (brown) versus stroma, as guided by hematoxylin and eosin (H&E), with corresponding mean drug concentrations are shown on the left (scale bars, 1 mm). Line profiles depicting drug concentration are shown in the inset and graphed in (C).
Fig. 6.
Fig. 6.. Albumin binding limits diffusion through collagen and cellular uptake.
(A) Transwell measurement of unlabeled drug transport from upper to lower chamber by liquid chromatography–mass spectrometry (means ± SEM, two-tailed t test, n ≥ 5). (B) Representative visceral (top) and subcutaneous (bottom) YUMMER1.7 melanoma tumors stained for collagen using Masson trichrome (blue). Inset (yellow boxes) shown at the right. Scale bars, 500 and 100 μm (inset). (C) Collagen quantified from Masson trichrome in (B) (n = 3, means ± SE, Kruskal-Wallis test). (D) Transwell measurement as in (A) was used with activated fibroblasts rather than collagen gel. Alexa Fluor 647–albumin transport from top to bottom chamber was measured after 3 hours (means ± SE, two-way ANOVA corresponding to fig. S11). Transwell inserts were stained with Sirius red. (E) p-ERK1/2 immunofluorescence of A375 cells treated for 2 hours in the presence or absence of physiologic HSA concentrations (top, with observed in vivo drug concentration range shaded) and corresponding computational modeling predictions based on drug PK/PD properties (bottom). (F) Dab-SiR drug uptake in the presence of albumin for A375 cells (1 μM; incubated for 2 hour). a.u., arbitrary units; DAPI, 4′,6-diamidino-2-phenylindole.
Fig. 7.
Fig. 7.. Heterogeneous BRAFi uptake and response in intracranial metastases.
(A and B) Representative MALDI MSI of encorafenib (A) and dabrafenib (B) and corresponding quantification (C) in an intracranial PDX model of metastatic melanoma, assessed 4 hours after intravenous drug injection as in Fig. 5. Regions highlighting tumor, as guided by H&E, with corresponding mean drug concentrations are shown. Scale bar, 4 mm. Heme b marks vasculature and blood. (B) Magnified inset at the right highlights high (yellow arrow) and low (blue arrow) uptake. (C) Drug concentrations across intracranial lesions (median ± interquartile range, Mann-Whitney U test, n = 5). (D) Fraction of cells showing low ERK activity 4 hours after treatment in intracranial YUMM1.7 melanoma micrometastases (means ± SE, n ≥ 4 animals, Kruskal-Wallis test). (E) Corresponding to (D), representative encorafenib-treated micrometastases. Scale bar, 50 μm. (F) Corresponding to (D) and (E), ERK-KTR activity across tumor regions showing low or high albumin exposure (N ≥ 3 animals per condition across 359 total cells, means ± SE).
Fig. 8.
Fig. 8.. Combined dabrafenib and encorafenib treatment more effectively blocks tumor growth when dosing is staggered.
(A) Top: Proposed dose combination strategy and computational tumor model. Middle: Simulated blood concentrations of total drug are shown for staggered treatment combination, spaced 8 hours apart. Bottom: Simulations of BRAF target occupancy and total drug concentrations as a function of distance from tumor edge, over the course of a 6-day treatment period for staggered dabrafenib and encorafenib. (B) Simulated heatmaps showing the fraction of BRAF that is bound by drug as a function of drug fractionation across the first and second daily doses (x axis) and daily dose interval (y axis). Green box highlights the selected dosing scheme for experiments and corresponds to simulations shown in (A). (C and D) Braf-mutant melanoma allograft growth in C57Bl/6 mice was monitored by caliper in response to BRAFi regimens, shown as individual tumor data at day 19 after treatment (C) and over time (D) with matched color labeling. Data are means ± SEM, across 69 total tumors in 19 mice (two-tailed Welch’s t test).

References

    1. Karoulia Z., Gavathiotis E., Poulikakos P., New perspectives for targeting RAF kinase in human cancer. Nat. Rev. Cancer 17, 676–691 (2017). - PMC - PubMed
    1. Delord J., Robert C., Nyakas M., McArthur G., Kudchakar R., Mahipal A., Yamada Y., Sullivan R., Arance A., Kefford R., Carlino M., Hidalgo M., Gomez-Roca C., Michel D., Seroutou A., Aslanis V., Caponigro G., Stuart D., Moutouh-de Parseval L., Demuth T., Dummer R., Phase I dose-escalation and -expansion study of the braf inhibitor encorafenib (LGX818) in metastatic BRAF-mutant melanoma. Clin. Cancer Res. 23, 5339–5348 (2017). - PubMed
    1. Subbiah V., Puzanov I., Blay J. Y., Chau I., Lockhart A. C., Raje N. S., Wolf J., Baselga J., Meric-Bernstam F., Roszik J., Diamond E. L., Riely G. J., Sherman E. J., Riehl T., Pitcher B., Hyman D. M., Pan-cancer efficacy of vemurafenib in BRAF (V600)-mutant non-melanoma cancers. Cancer Discov. 10, 657–663 (2020). - PMC - PubMed
    1. Corcoran R., André T., Atreya C., Schellens J., Yoshino T., Bendell J., Hollebecque A., McRee A., Siena S., Middleton G., Muro K., Gordon M., Tabernero J., Yaeger R., O’Dwyer P., Humblet Y., De Vos F., Jung A., Brase J., Jaeger S., Bettinger S., Mookerjee B., Rangwala F., Van Cutsem E., Combined BRAF, EGFR, and MEK inhibition in patients with BRAFV600E-mutant colorectal cancer. Cancer Discov. 8, 428–443 (2018). - PMC - PubMed
    1. Dummer R., Ascierto P., Gogas H., Arance A., Mandala M., Liszkay G., Garbe C., Schadendorf D., Krajsova I., Gutzmer R., Chiarion-Sileni V., Dutriaux C., de Groot J., Yamazaki N., Loquai C., Moutouh-de Parseval L., Pickard M., Sandor V., Robert C., Flaherty K., Encorafenib plus binimetinib versus vemurafenib or encorafenib in patients with BRAF-mutant melanoma (COLUMBUS): A multicentre, open-label, randomised phase 3 trial. Lancet Oncol. 19, 603–615 (2018). - PubMed