. 2022 Aug;67(2):253-265.
doi: 10.1165/rcmb.2021-0359OC.

Cystic Fibrosis Airway Mucus Hyperconcentration Produces a Vicious Cycle of Mucin, Pathogen, and Inflammatory Interactions that Promotes Disease Persistence

Affiliations

Cystic Fibrosis Airway Mucus Hyperconcentration Produces a Vicious Cycle of Mucin, Pathogen, and Inflammatory Interactions that Promotes Disease Persistence

Bethany D Batson et al. Am J Respir Cell Mol Biol. 2022 Aug.

Abstract

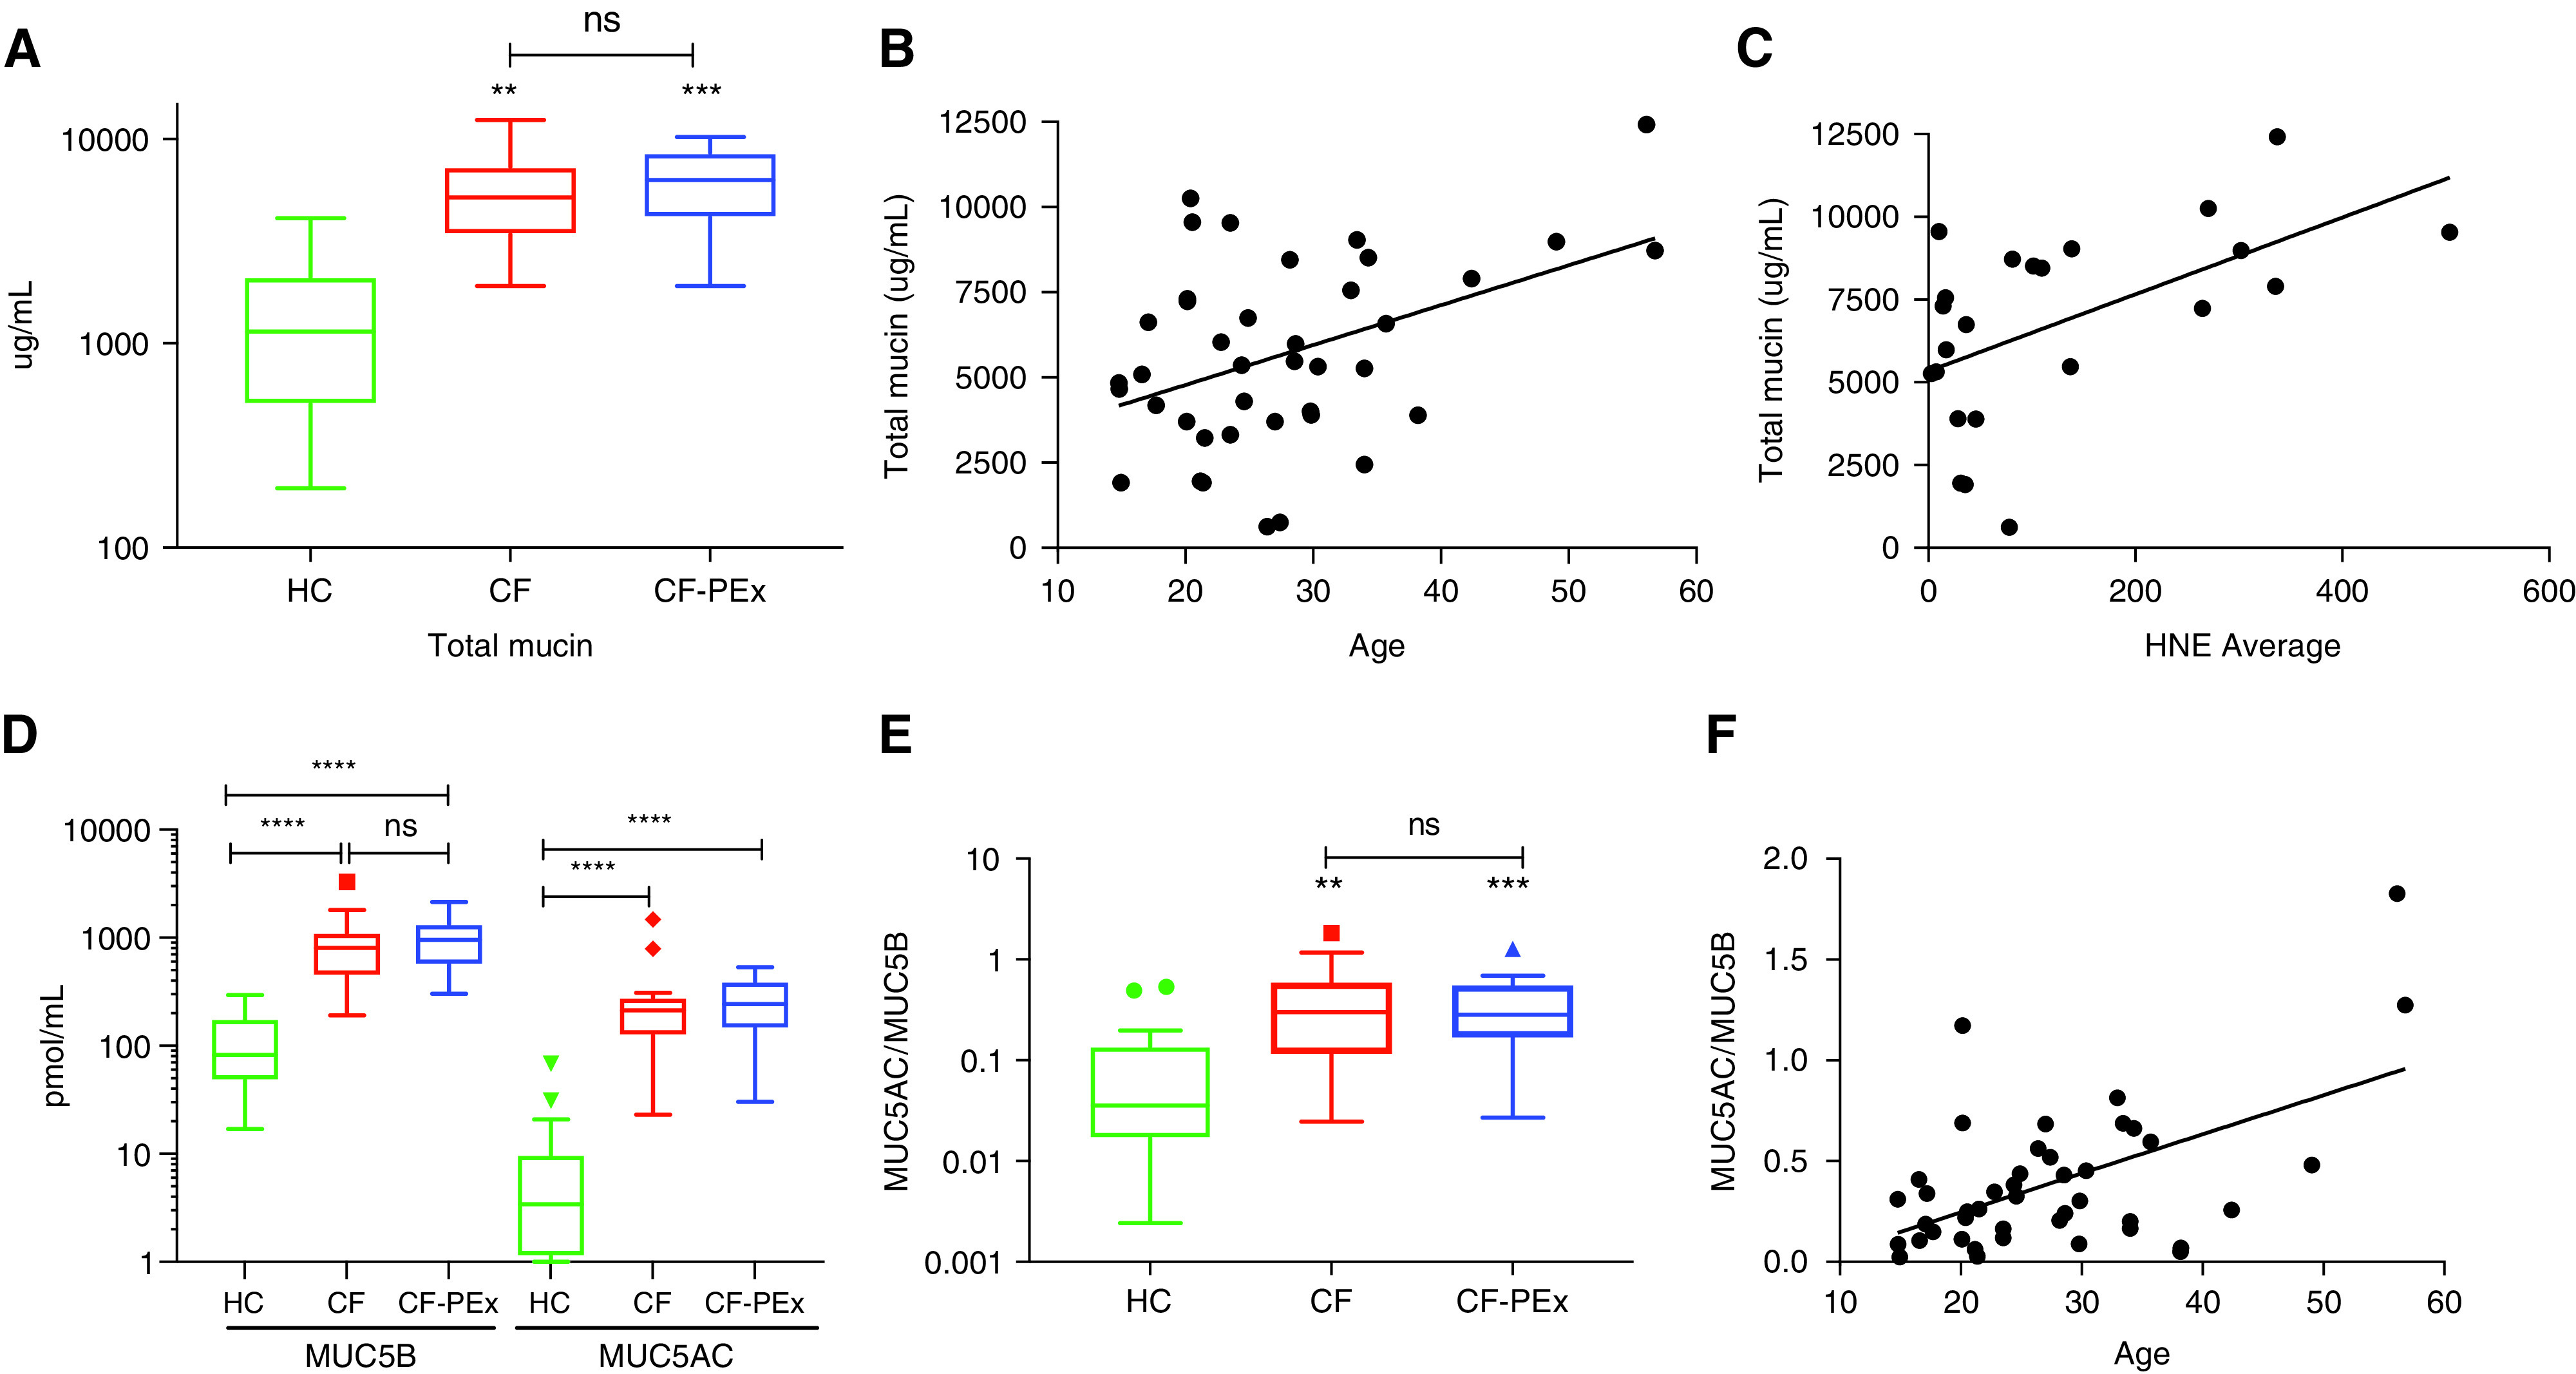
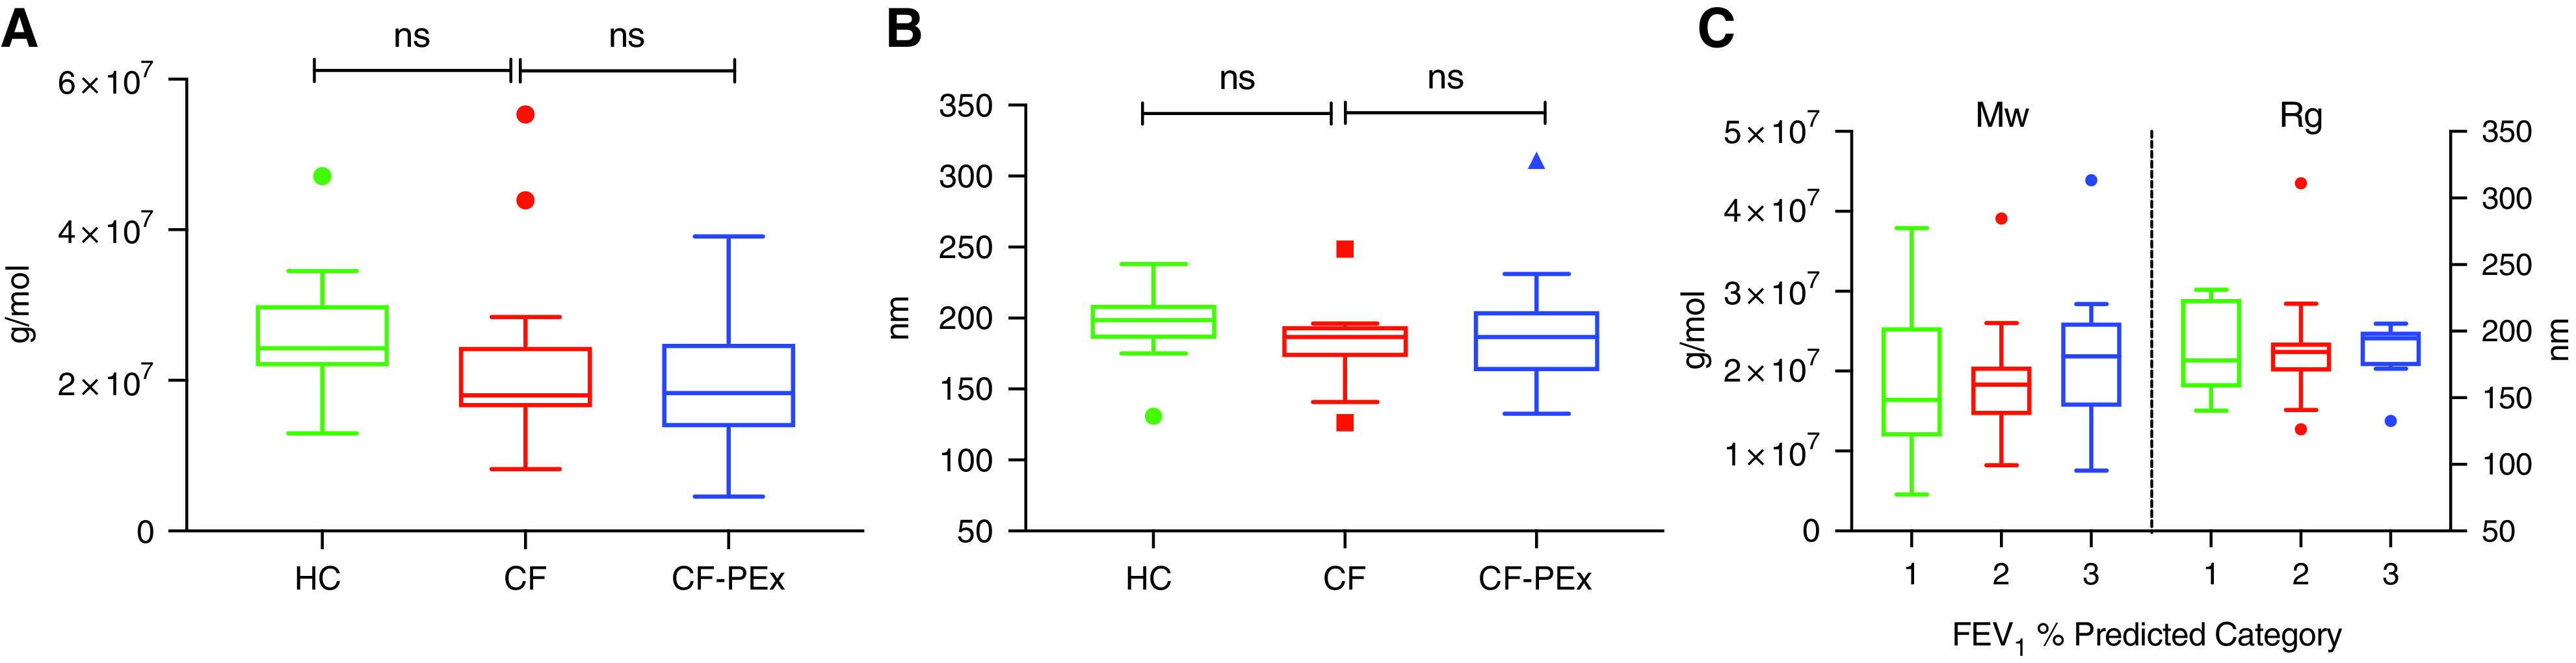
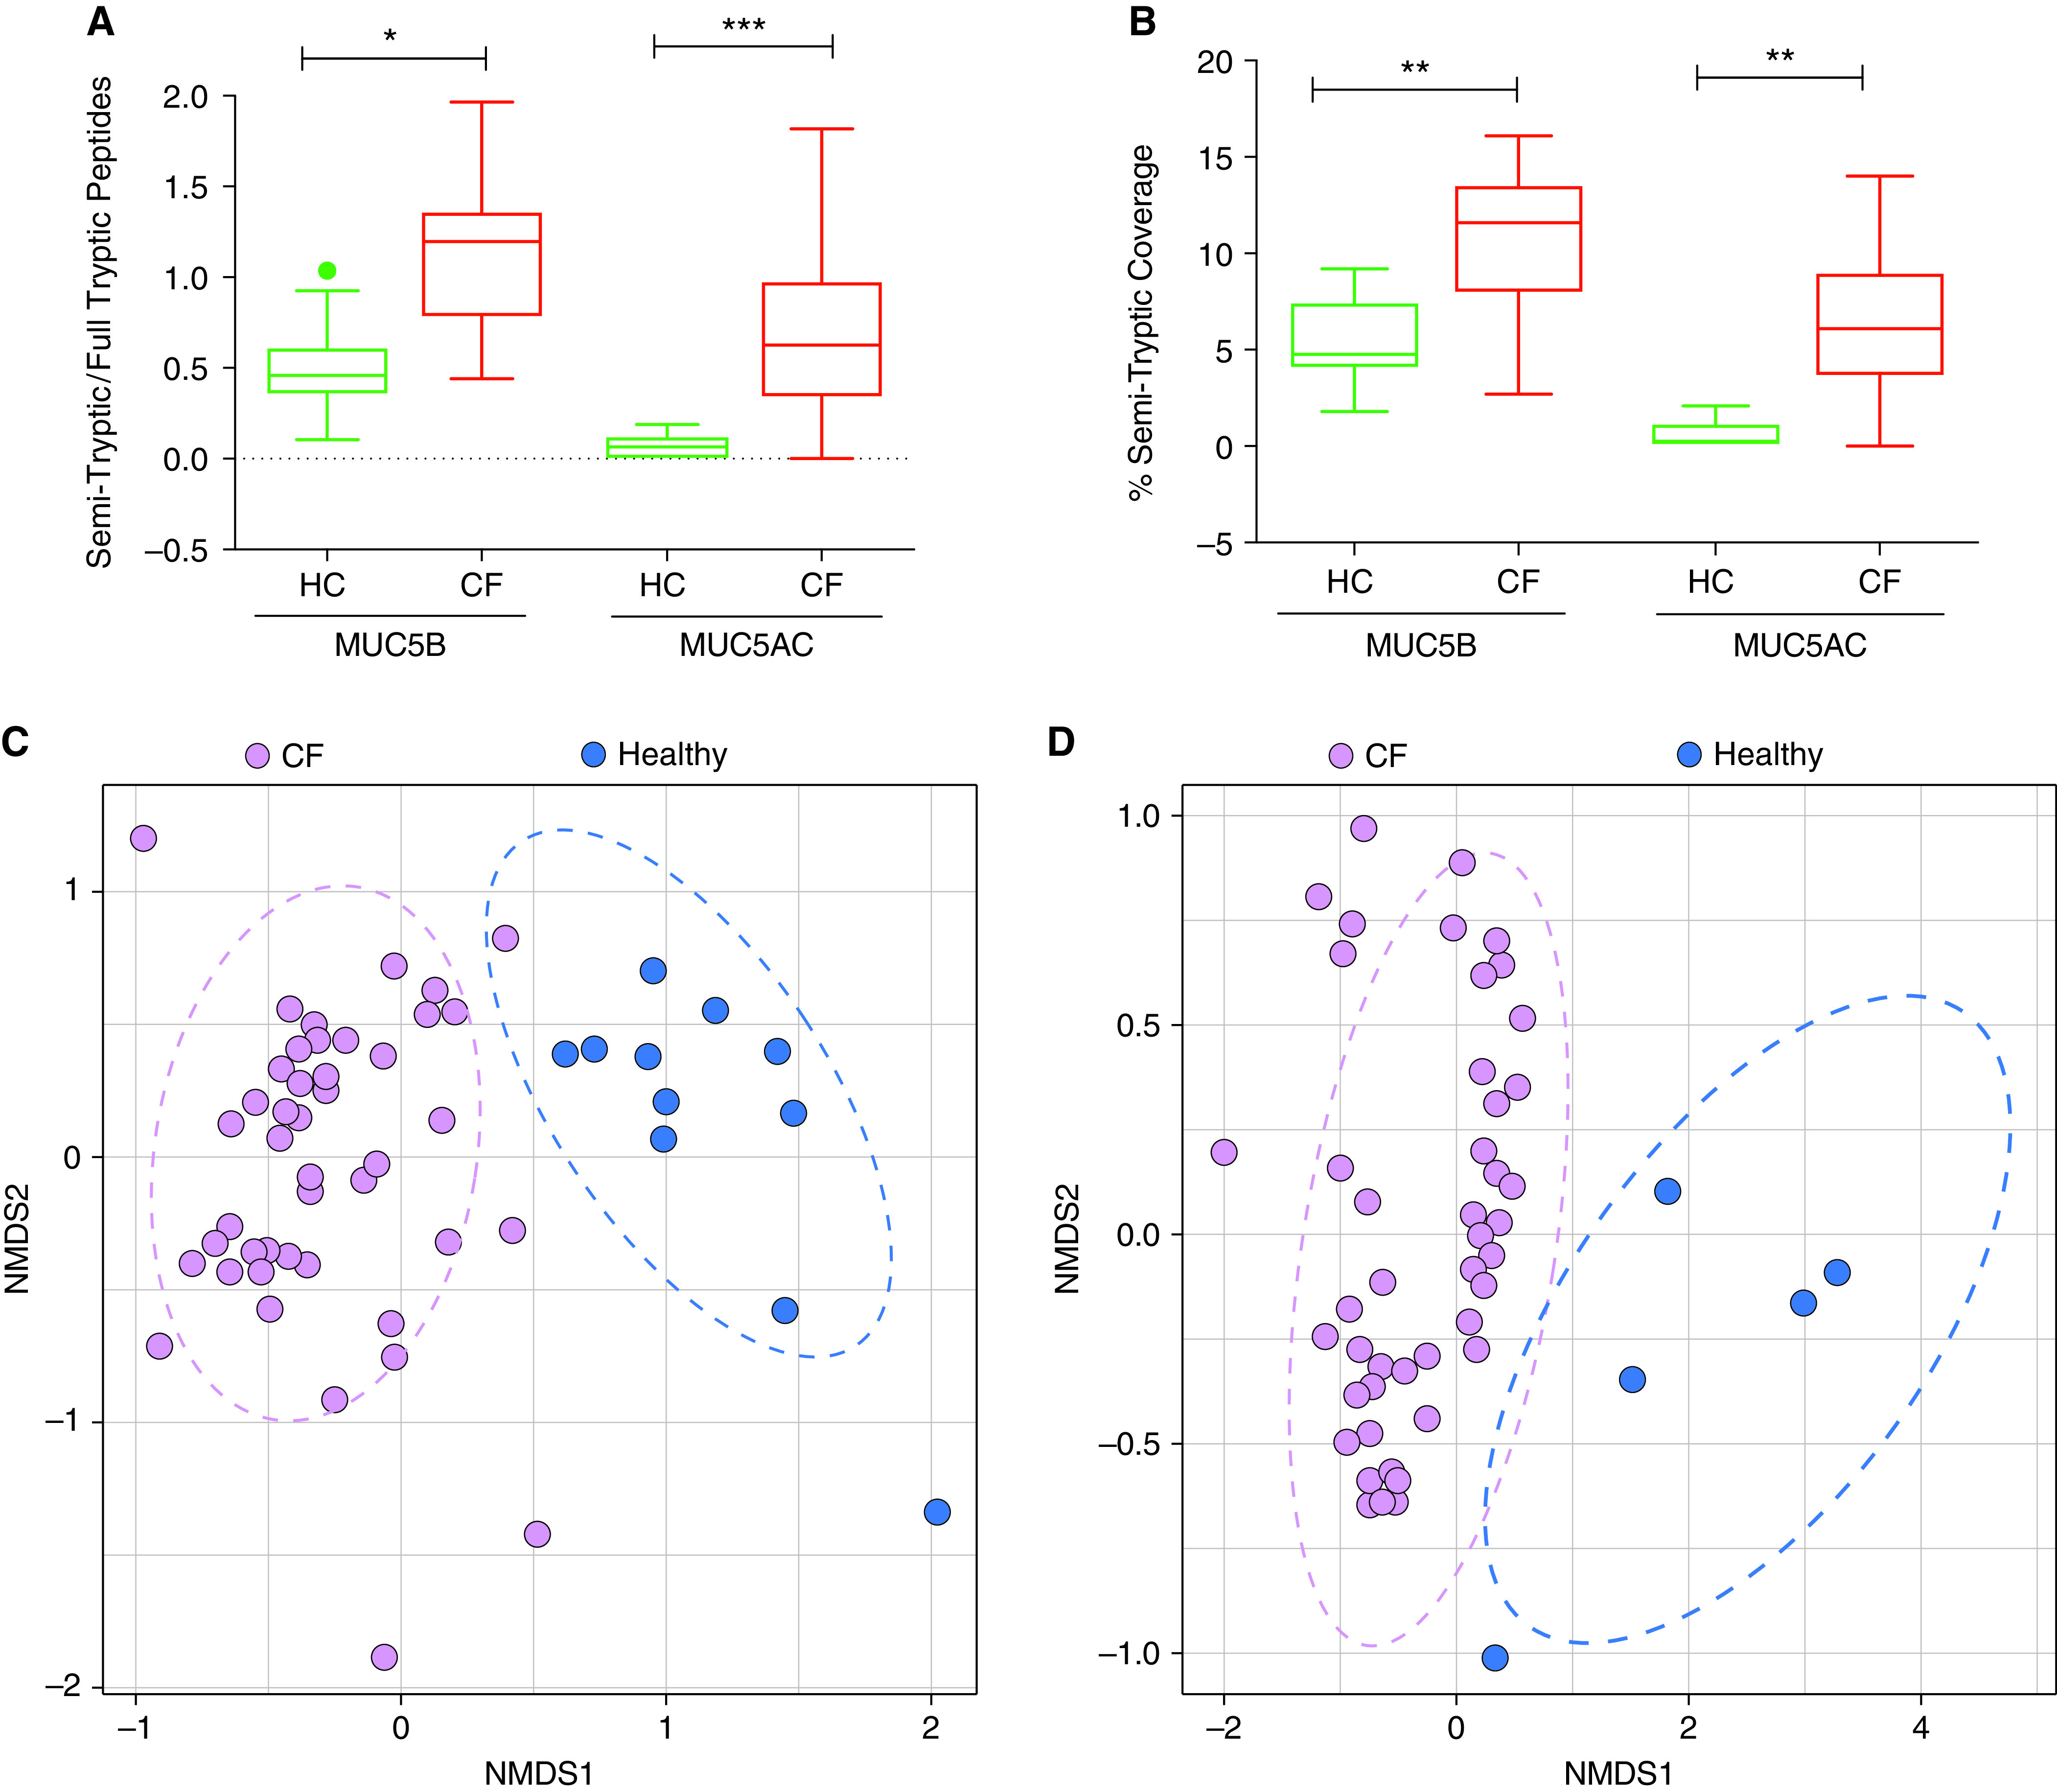
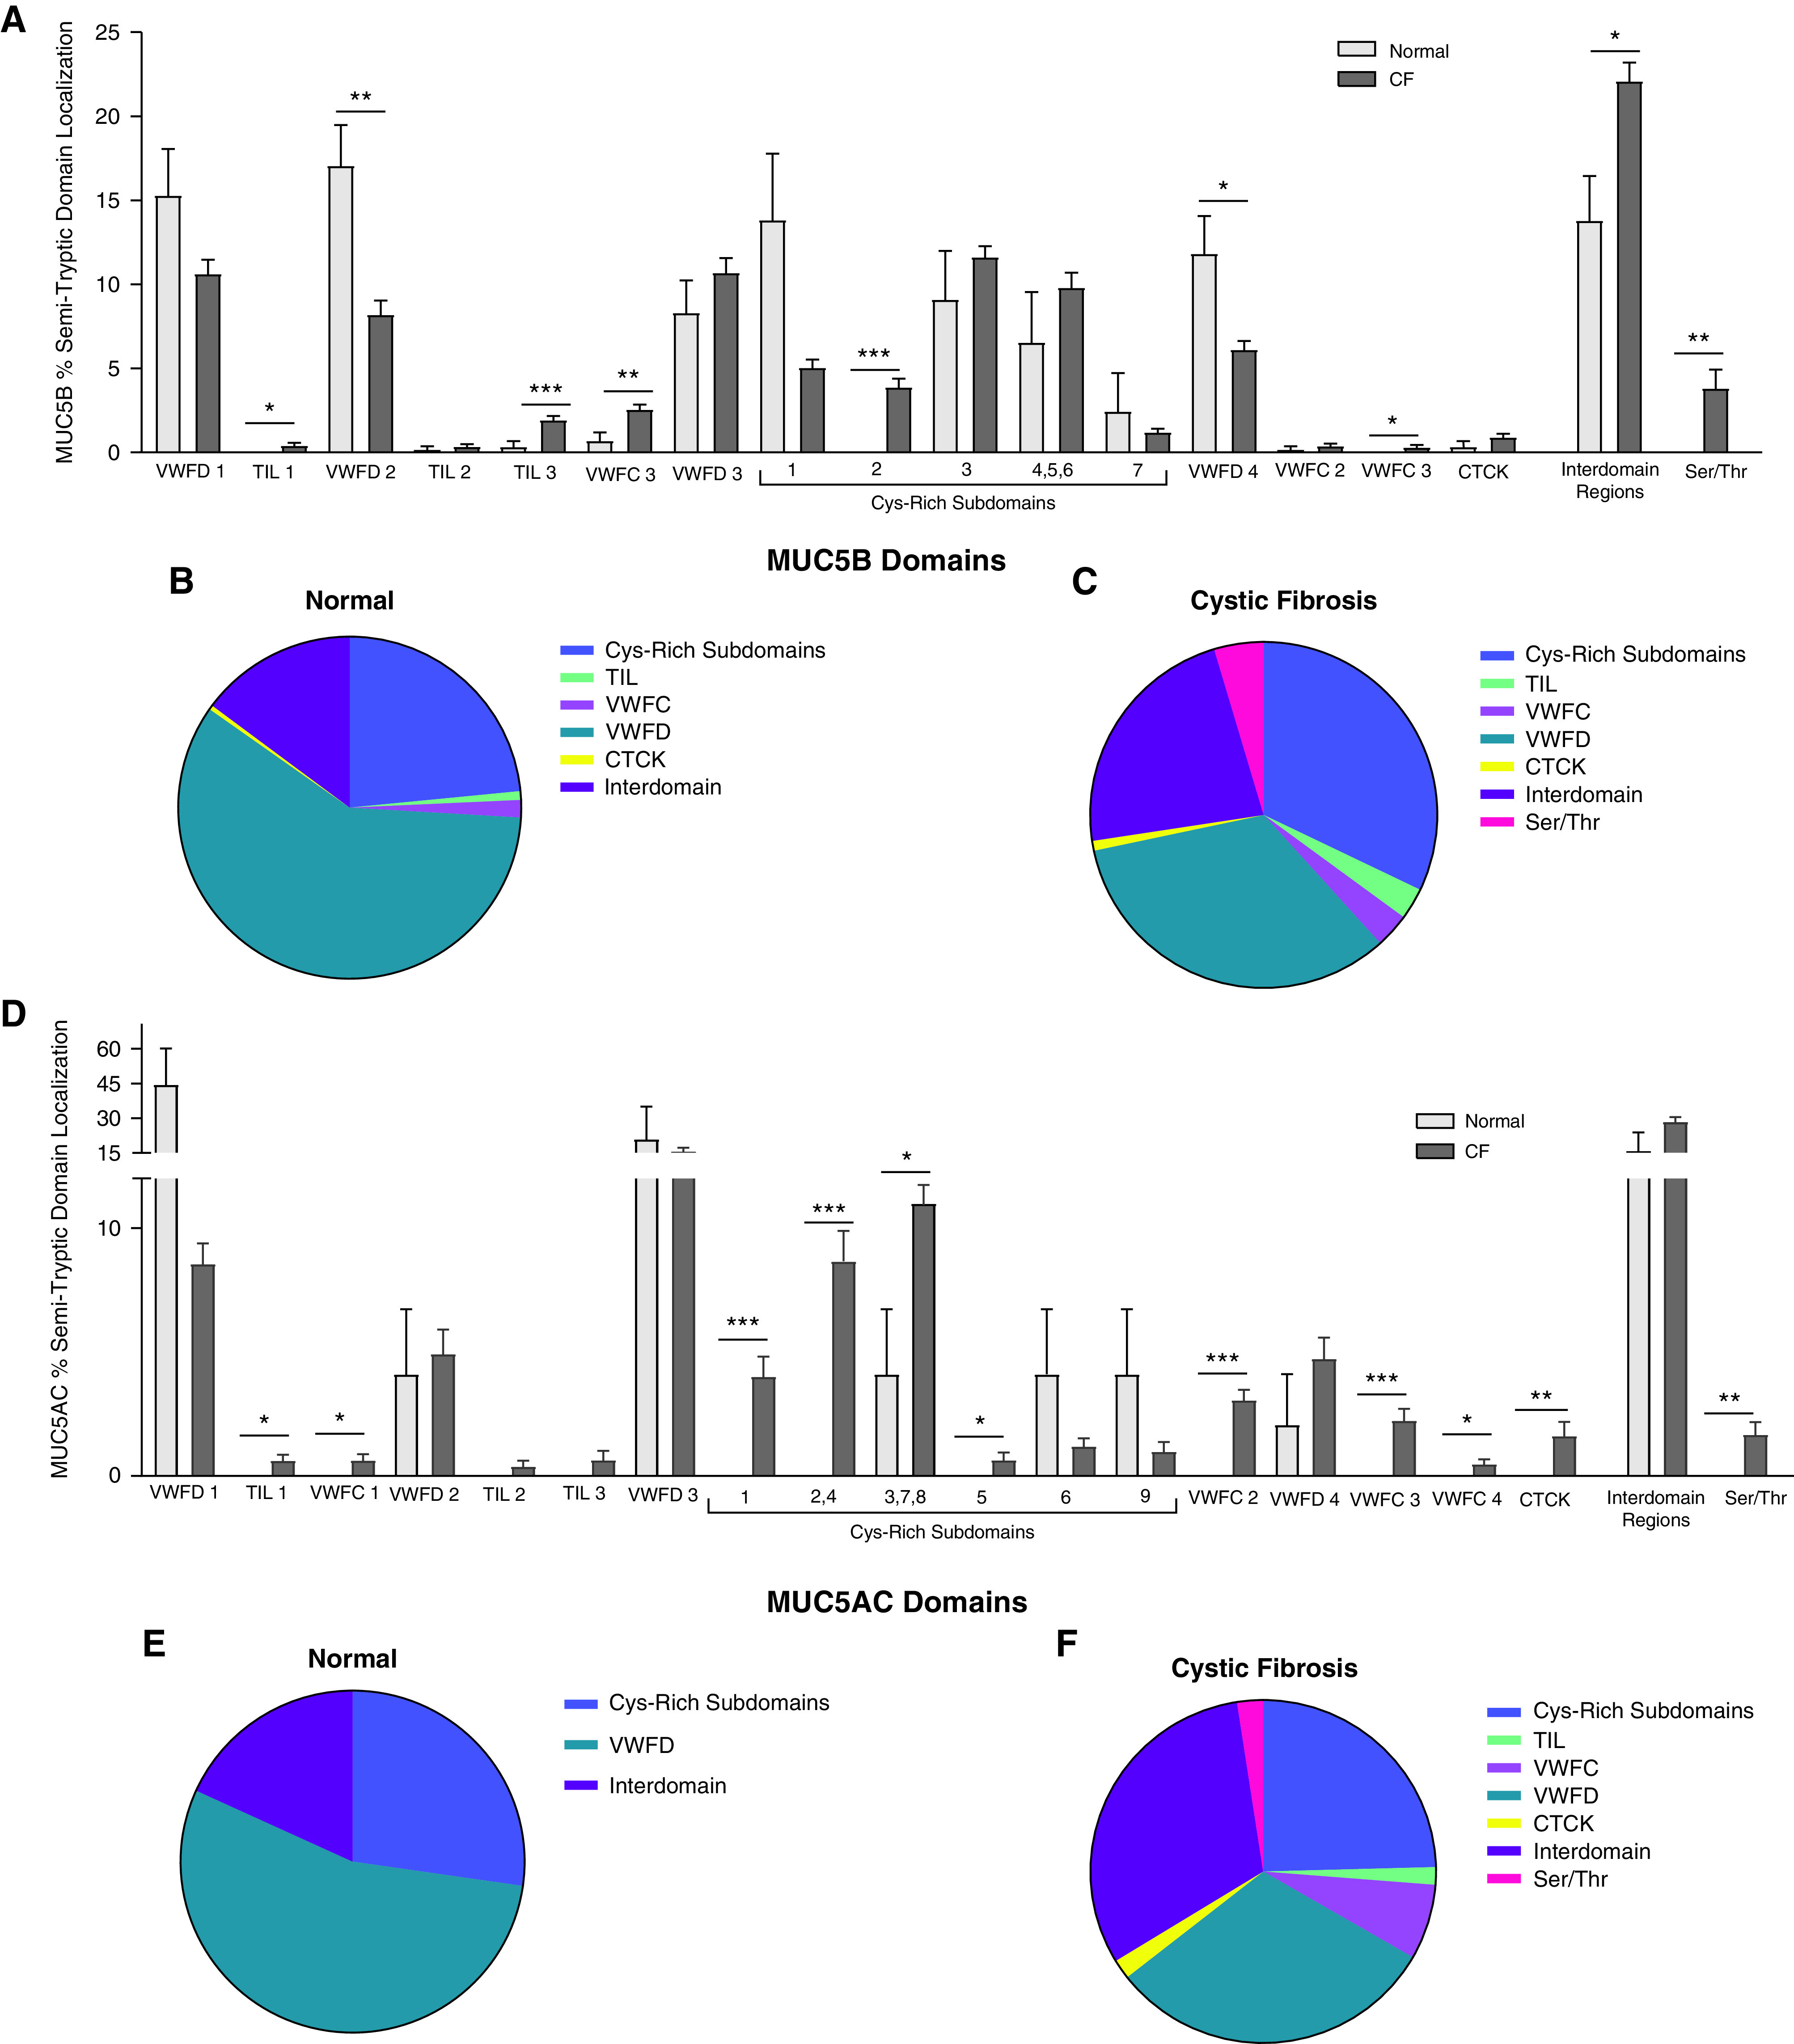
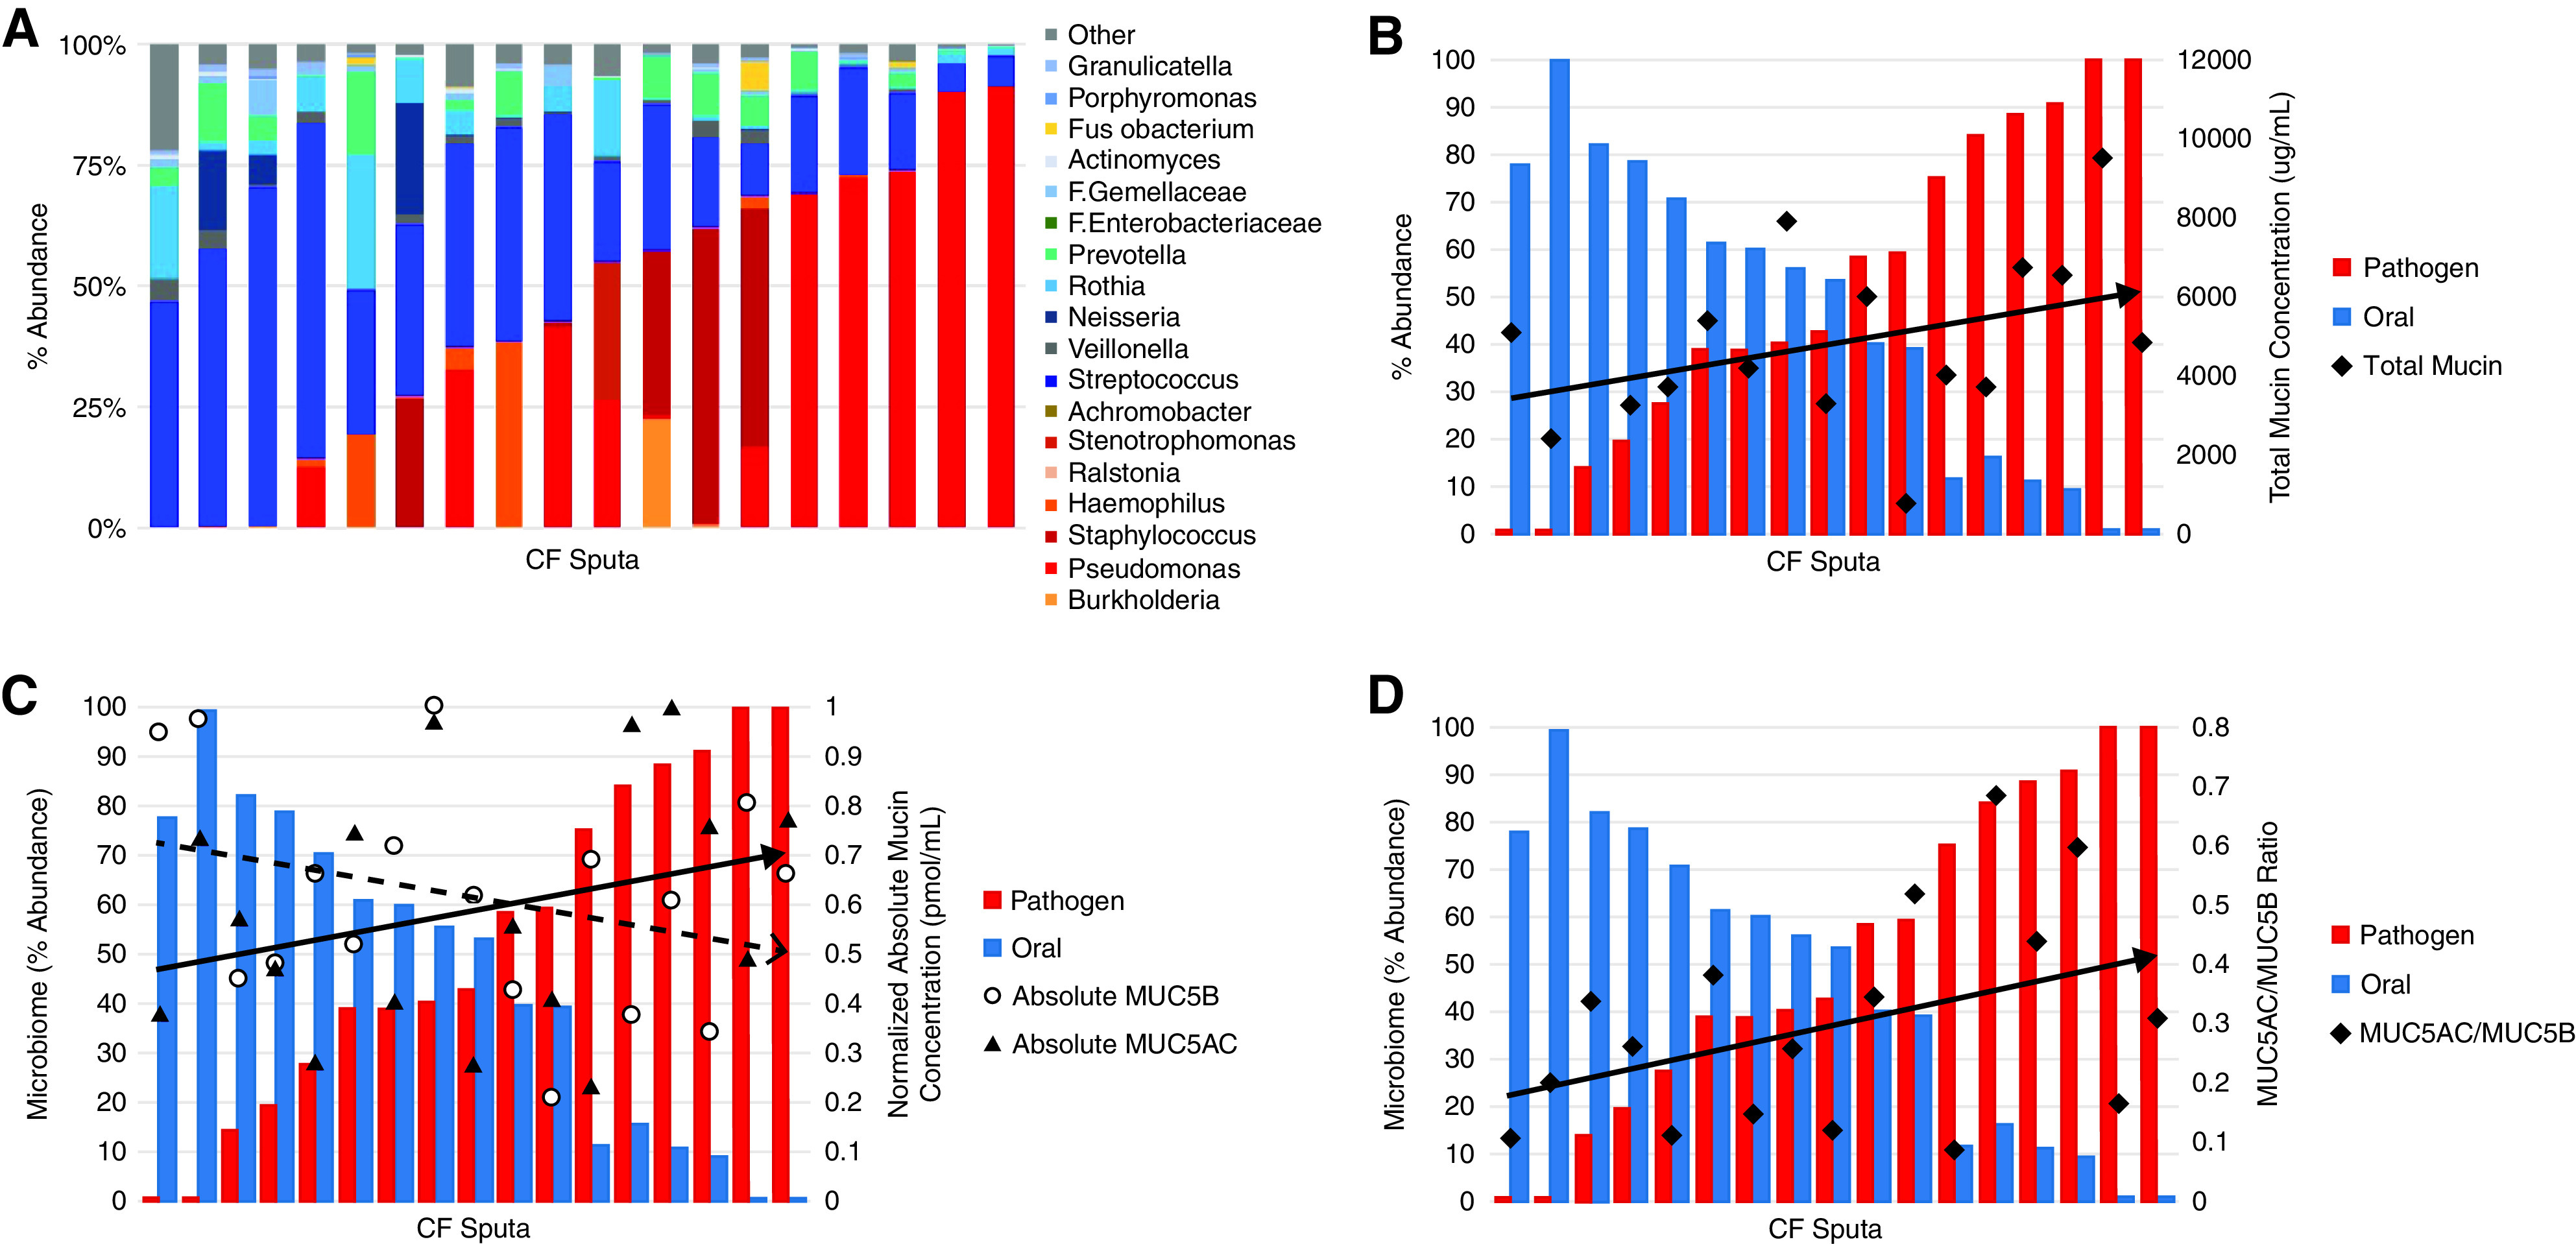
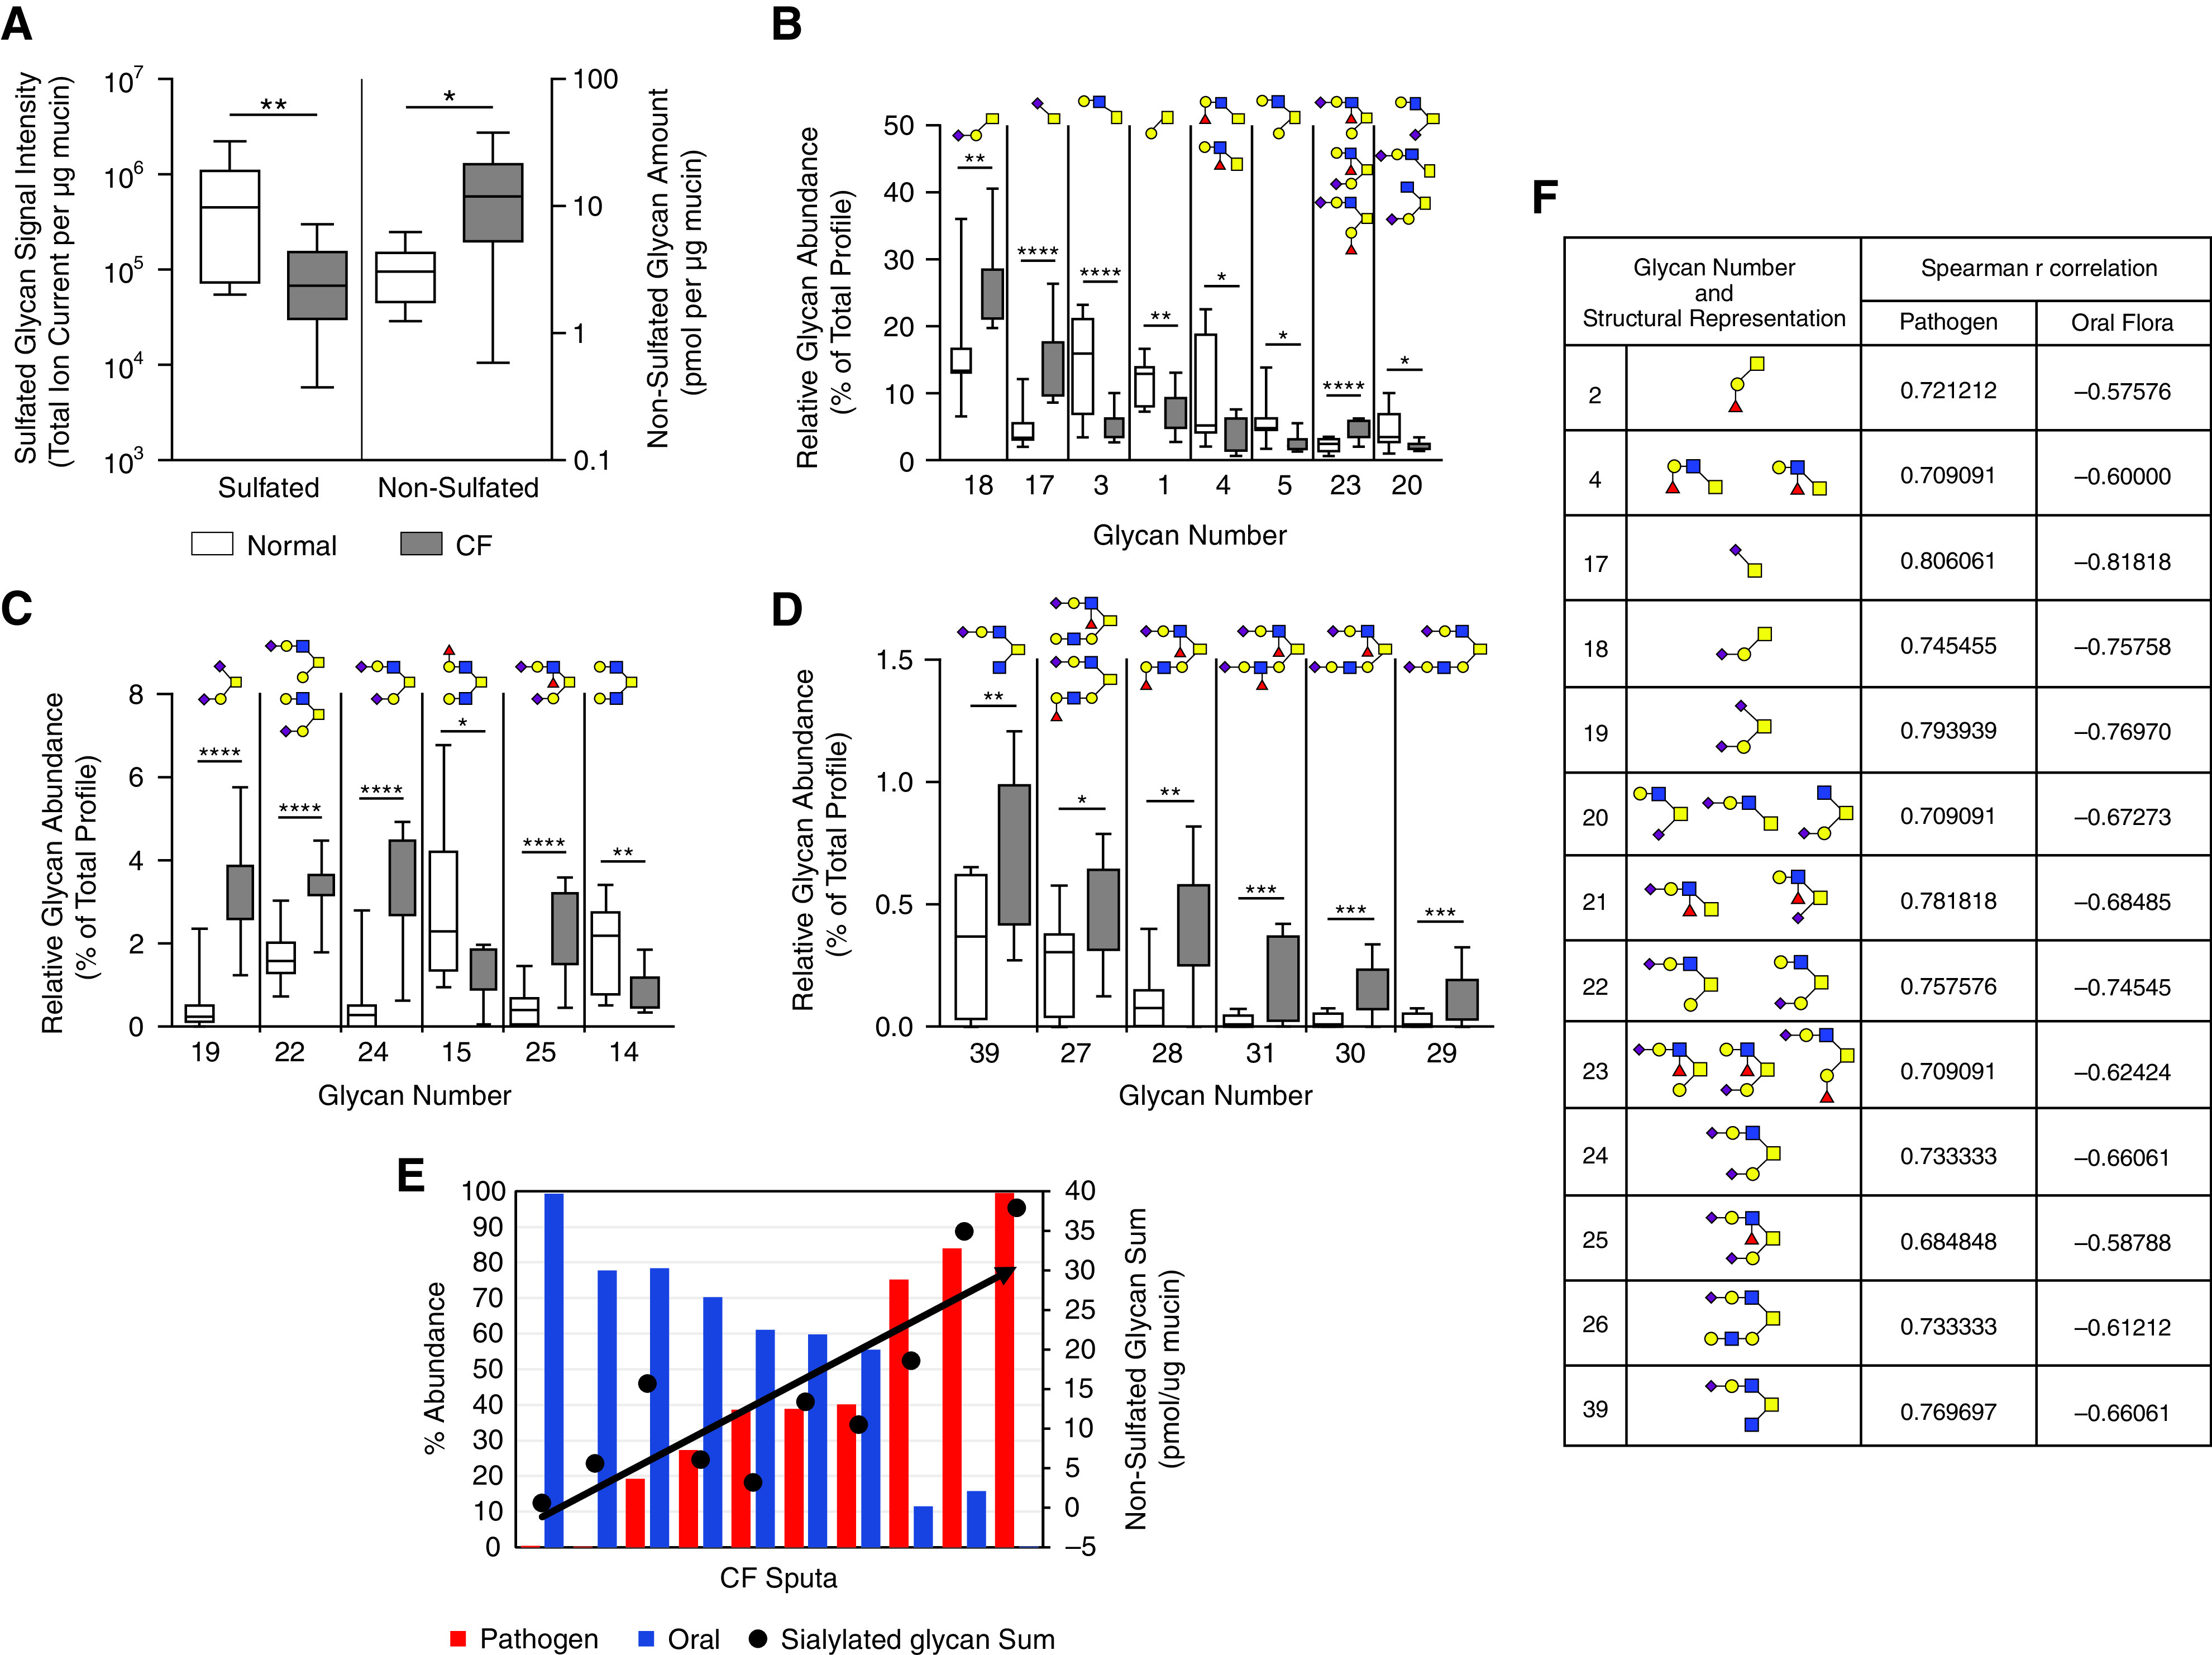
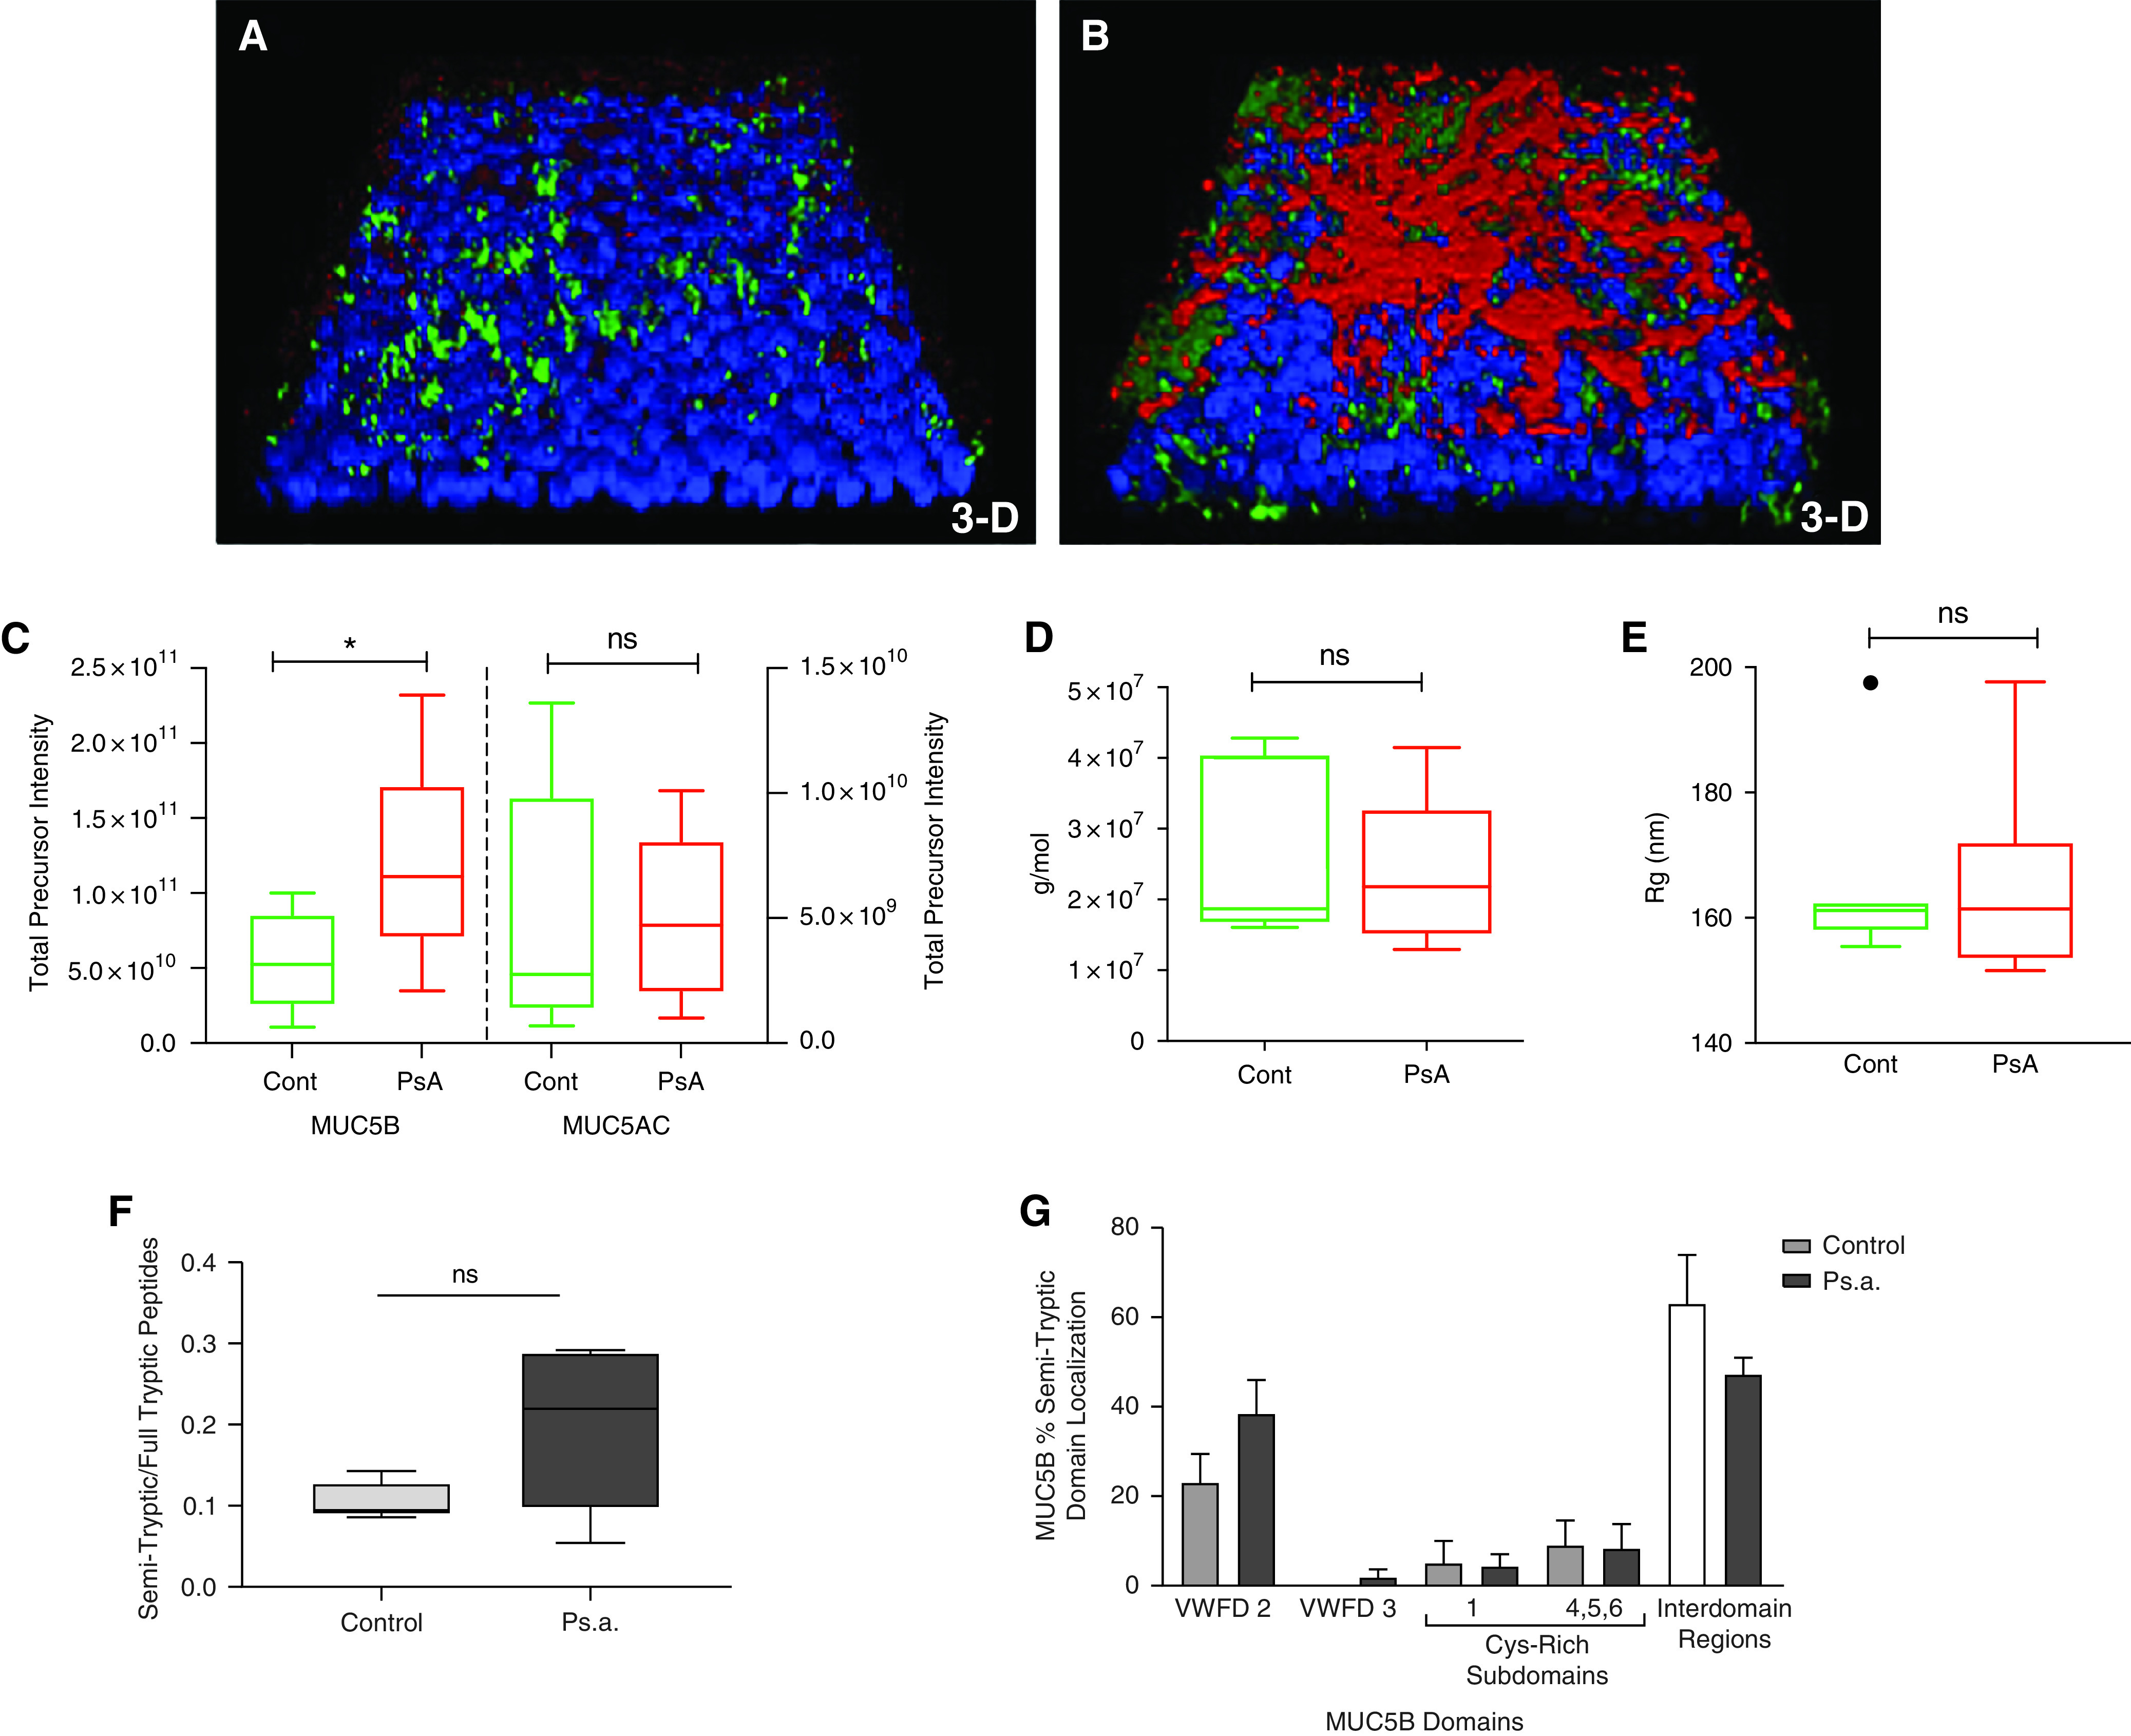
The dynamics describing the vicious cycle characteristic of cystic fibrosis (CF) lung disease, initiated by stagnant mucus and perpetuated by infection and inflammation, remain unclear. Here we determine the effect of the CF airway milieu, with persistent mucoobstruction, resident pathogens, and inflammation, on the mucin quantity and quality that govern lung disease pathogenesis and progression. The concentrations of MUC5AC and MUC5B were measured and characterized in sputum samples from subjects with CF (N = 44) and healthy subjects (N = 29) with respect to their macromolecular properties, degree of proteolysis, and glycomics diversity. These parameters were related to quantitative microbiome and clinical data. MUC5AC and MUC5B concentrations were elevated, 30- and 8-fold, respectively, in CF as compared with control sputum. Mucin parameters did not correlate with hypertonic saline, inhaled corticosteroids, or antibiotics use. No differences in mucin parameters were detected at baseline versus during exacerbations. Mucin concentrations significantly correlated with the age and sputum human neutrophil elastase activity. Although significantly more proteolytic cleavages were detected in CF mucins, their macromolecular properties (e.g., size and molecular weight) were not significantly different than control mucins, likely reflecting the role of S-S bonds in maintaining multimeric structures. No evidence of giant mucin macromolecule reflecting oxidative stress-induced cross-linking was found. Mucin glycomic analysis revealed significantly more sialylated glycans in CF, and the total abundance of nonsulfated O-glycans correlated with the relative abundance of pathogens. Collectively, the interaction of mucins, pathogens, epithelium, and inflammatory cells promotes proteomic and glycomic changes that reflect a persistent mucoobstructive, infectious, and inflammatory state.

Keywords: cystic fibrosis; inflammation; microbiome; mucins; mucus obstruction.


Figures

Figure 1.
Figure 1.
Mucin concentration increases significantly in cystic fibrosis (CF). (A) Total mucin concentrations of CF sputum is significantly higher than healthy control (HC) but does not differ between stable CF and CF with pulmonary exacerbation (CF-PEx) disease status. (B and C) Correlation between total mucin concentration and age (B) (n = 40) (Pearson r = 0.430; P = 0.006) and HNE (C) (n = 23) (Pearson r = 0.552; P = 0.006). (D and E) Absolute MUC5B and MUC5AC concentrations and the MUC5AC/MUC5B ratio are significantly elevated in CF but do not differ between stable and exacerbation disease status (healthy, n = 19; CF stable, n = 17; and CF exacerbation, n = 24). (F) Correlation of the ratio of MUC5AC/MUC5B ratio and age (n = 43) (Pearson r = 0.546; P = 0.00015). **P < 0.01, ***P < 0.005, and ****P < 0.001. FEV1 =  forced expiratory volume in 1 second; HNE = human neutrophil elastase; ns = not significant.
Figure 2.
Figure 2.
Macromolecular properties of the purified gel-forming mucins from sputum are not significantly different between healthy and CF. SEC-MALS measurement of (A) molecular weight (Mw) and (B) radius of gyration (Rg) of mucins purified by isopycnic centrifugation from sputum (healthy, n = 10; CF stable, n = 15; and CF exacerbation, n = 24). FEV1 percent predicted categories: 1: values ⩽36% (n = 10), 2: values >36% but ⩽65% (n = 17), and 3: values >65% (n = 10). (C) No significant differences in molecular weight and radius of gyration within the CF cohort based on FEV1 percent predicted category.
Figure 3.
Figure 3.
MUC5B and MUC5AC from CF sputum have a significantly higher ratio of semitryptic to fully tryptic peptides. Label-free LC-MS/MS analysis allowing (A) identification of unique semitryptic and fully tryptic peptides per sputum sample for MUC5B and MUC5AC and (B) the percentage of the mucin protein backbone covered by semitryptic peptides (control [HC], n = 10; CF, n = 41). (C and D) MUC5B and MUC5AC from CF (purple) and normal sputa (blue) show distinct signatures based on semitryptic peptides and the mucin domains they map to. Nonmetric multidimensional scaling (NMDS) analysis of unique MUC5B and MUC5AC semitryptic peptide sequences per sample from healthy and CF sputa and of their domain signature generated by mapping each semitryptic peptide to the MUC5B (C) or MUC5AC (D) backbone. There is significant separation between the CF and normal samples based on permutational multivariate analysis of variance (PERMANOVA) (P < 001) (MUC5B: normal, n = 11; CF, n = 44; MUC5AC: normal, n = 7; CF, n = 44.) Samples were excluded from analysis if no semitryptic peptides were identified. *P < 0.05, **P < 0.01, and ***P < 0.005.
Figure 4.
Figure 4.
Specific domain localization of semitryptic peptides differs between CF and normal. Percentage of unique semitryptic peptides per sample mapped to individual Uniprot annotated protein domains for (A) MUC5B and (D) MUC5AC with pie charts showing localization based on region type for (B) normal and (C) CF for MUC5B and (E) normal and (F) CF for MUC5AC. *P < 0.05, **P < 0.01, and ***P < 0.005.
Figure 5.
Figure 5.
Relationship between microbiome and mucin concentrations. (A) Abundance of bacterial genera based on sputum microbiome sequence analysis shows stratification on the basis of oral flora or classic pathogen classification. 16s rRNA sequencing identified microbiome composition of a subset of CF sputum samples (n = 20). Each column represents one sputum sample. Cool-toned bars (blue/green) indicate that the genera is commonly identified as part of the oral flora community and warm (red/orange) toned bars indicate microbe is typically identified as a CF lung pathogen. (B) Total mucin concentrations compared to abundance of genera classified as either oral flora or pathogen (r = 0.42; P = 0.053). Absolute quantitative LS-MS/MS using labeled peptides was used to determine MUC5AC and MUC5B concentrations and the ratio between them (C), which was compared with microbiome data. Each pair of blue and red bars represents one CF sputum sample (n = 17), which were arranged by increasing pathogen abundance from left to right. The ratio reflects the relationship between the absolute concentrations (C) of MUC5AC (black triangles, r = 0.32; P = 0.22) and MUC5B (open circles, r = −0.41; P = 0.11). (D) MUC5AC/MUC5B ratio versus pathogen abundance (r = 0.48; P = 0.062).
Figure 6.
Figure 6.
Purified gel forming mucins from control and CF sputum have significantly different glycan profiles. (A) Mass spectrometry analysis of sulfated and nonsulfated (sialylated) glycans of purified gel-forming mucins isolated via isopycnic centrifugation from healthy and CF sputa (healthy, n = 7; CF, n = 10). (BD) Glycans of high, intermediate, and low abundance. (E) Significant positive correlation between pathogen abundance and cumulative nonsulfated glycan sum normalized per mg mucin (r = 0.82; P = 0.0001). Data are presented as box and whisker plots indicating the median, quartile, and data range. Glycan numbers refer to glycan structures in Table E1. *P < 0.05, **P < 0.01, ***P < 0.005, and ****P < 0.001. (F) Additional glycans that significantly associated with microbiome composition based on Spearman r correlation are listed in the inset table.
Figure 7.
Figure 7.
CF-HTBE cultures apically challenged with Pseudomonas aeruginosa exhibit mucin hypersecretion without alteration in macromolecular properties. (A and B) Representative images of whole-mount immunohistochemistry three-dimensional renderings of 120-hour tryptic soy broth (TSB) control (cont) (A) and P. aeruginosa (B) challenged CF-HTBE culture from the same donor. Blue: DAPI (nuclei). Red: MUC5AC. Green: MUC5B. (C) MUC5B and MUC5AC concentrations in HBE apical secretions after challenge as measured by label-free LC-MS/MS (n = 5). (D and E) Gel-forming mucins purified from apical secretions by isopycnic centrifugation show similar molecular weight (D) and radius of gyration (E) as measured by SEC-MALS (n = 7). (F and G) Ratio of unique MUC5B semitryptic peptides to fully tryptic peptides (F) and MUC5B semitryptic peptide localization is not significantly different between control and P. aeruginosa–challenged cultures (G). *P ⩽ 0.05.

Comment in

References

    1. Riordan JR, Rommens JM, Kerem B, Alon N, Rozmahel R, Grzelczak Z, et al. Identification of the cystic fibrosis gene: cloning and characterization of complementary DNA. Science . 1989;245:1066–1073. - PubMed
    1. Boucher RC. Airway surface dehydration in cystic fibrosis: pathogenesis and therapy. Annu Rev Med . 2007;58:157–170. - PubMed
    1. Thornton DJ, Rousseau K, McGuckin MA. Structure and function of the polymeric mucins in airways mucus. Annu Rev Physiol . 2008;70:459–486. - PubMed
    1. Kirkham S, Sheehan JK, Knight D, Richardson PS, Thornton DJ. Heterogeneity of airways mucus: variations in the amounts and glycoforms of the major oligomeric mucins MUC5AC and MUC5B. Biochem J . 2002;361:537–546. - PMC - PubMed
    1. Kesimer M, Ehre C, Burns KA, Davis CW, Sheehan JK, Pickles RJ. Molecular organization of the mucins and glycocalyx underlying mucus transport over mucosal surfaces of the airways. Mucosal Immunol . 2013;6:379–392. - PMC - PubMed

Publication types