. 2022 Apr 29;18(4):e1010056.
doi: 10.1371/journal.pcbi.1010056. eCollection 2022 Apr.

phastSim: Efficient simulation of sequence evolution for pandemic-scale datasets

Affiliations

phastSim: Efficient simulation of sequence evolution for pandemic-scale datasets

Nicola De Maio et al. PLoS Comput Biol. .

Abstract

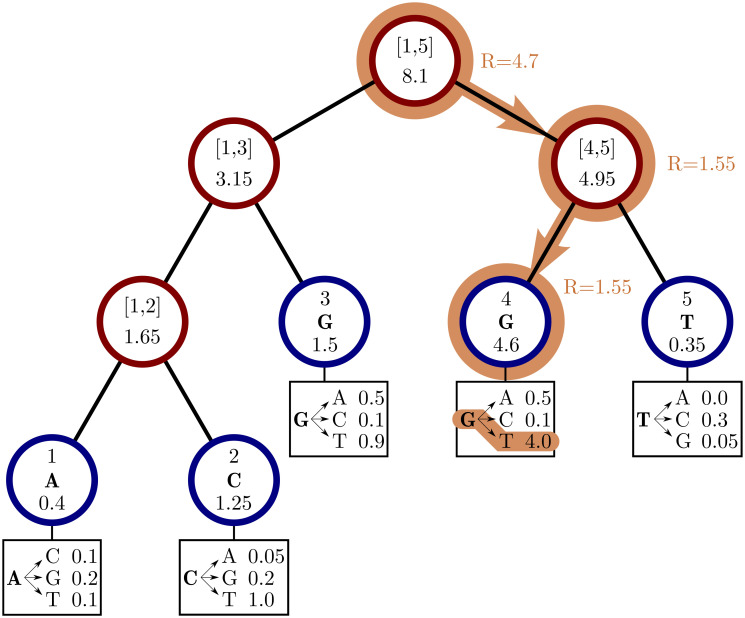
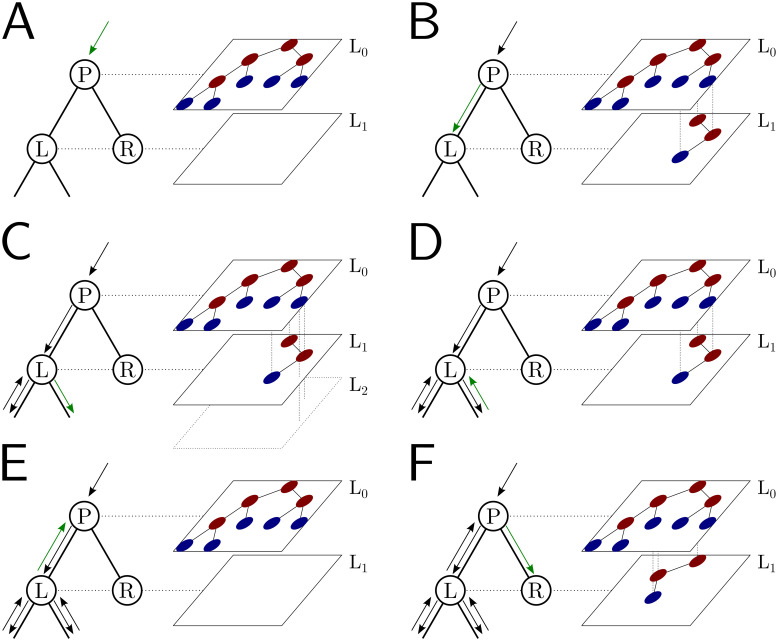
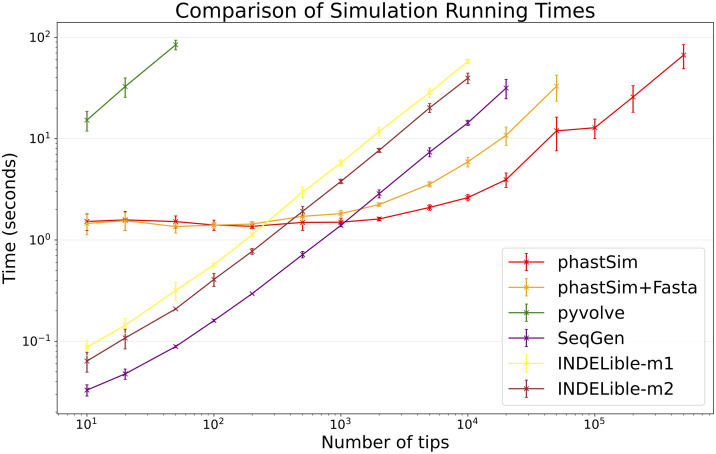
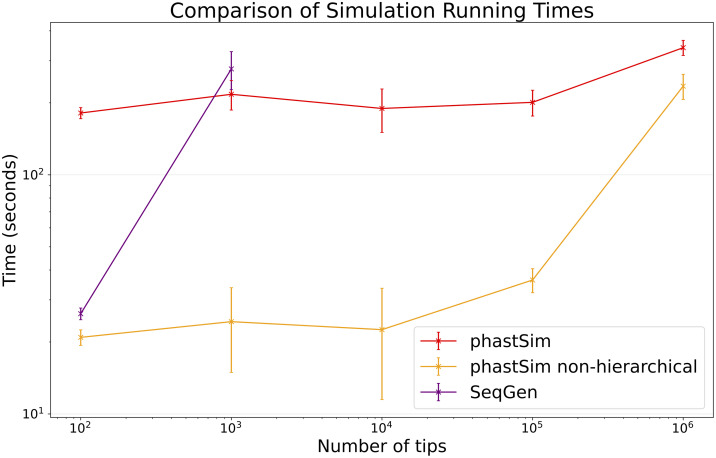
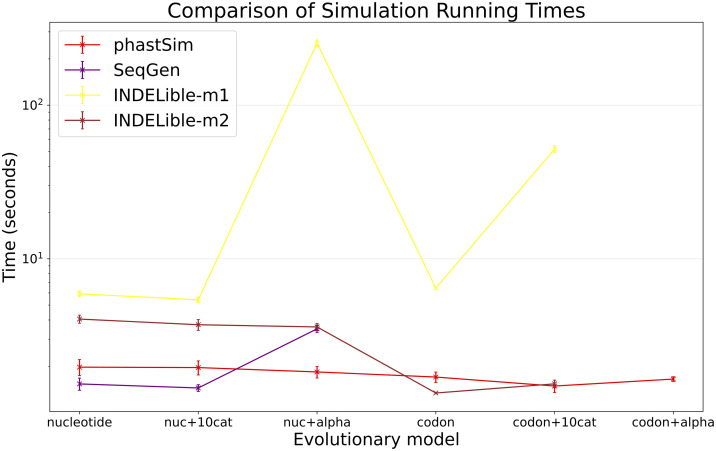
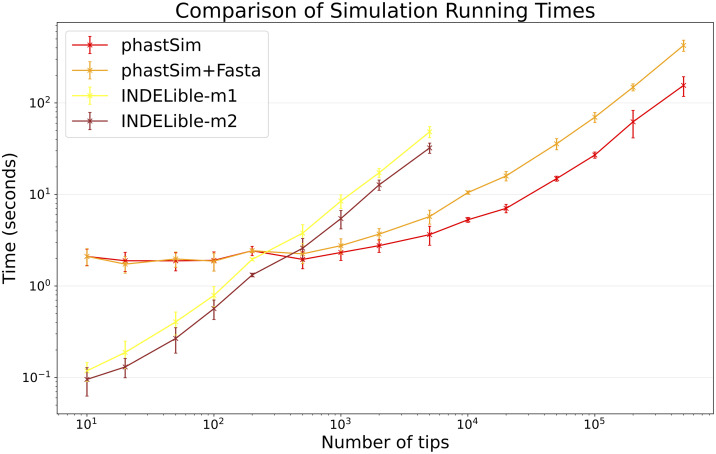
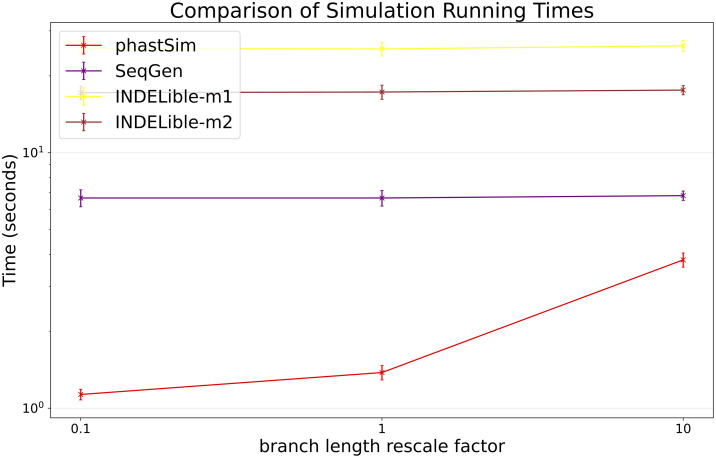
Sequence simulators are fundamental tools in bioinformatics, as they allow us to test data processing and inference tools, and are an essential component of some inference methods. The ongoing surge in available sequence data is however testing the limits of our bioinformatics software. One example is the large number of SARS-CoV-2 genomes available, which are beyond the processing power of many methods, and simulating such large datasets is also proving difficult. Here, we present a new algorithm and software for efficiently simulating sequence evolution along extremely large trees (e.g. > 100, 000 tips) when the branches of the tree are short, as is typical in genomic epidemiology. Our algorithm is based on the Gillespie approach, and it implements an efficient multi-layered search tree structure that provides high computational efficiency by taking advantage of the fact that only a small proportion of the genome is likely to mutate at each branch of the considered phylogeny. Our open source software allows easy integration with other Python packages as well as a variety of evolutionary models, including indel models and new hypermutability models that we developed to more realistically represent SARS-CoV-2 genome evolution.


Conflict of interest statement

The authors have declared that no competing interests exist.

Figures

Fig 1
Fig 1. Example genome search tree and its use.
An example genome search tree for ancestral genome ACGGT. Blue nodes are terminal and red nodes are internal. Inside each node we represent on top the genome positions represented by the node; at the center inside terminal nodes we show the allele of the node; at the bottom of nodes is their total rate. Under each terminal node we show the example relevant mutation rates. The path highlighted in orange shows an example sampling of one mutation event. A parameter R is assigned an initial random number sampled uniformly between 0 and the total rate 8.1, in this case it is R = 4.7. As we move downward, the value of R can decrease, as described in Algorithm 2, determining which site will mutate and how. Here, an initial R = 4.7 results in the sampling of a G→T mutation at genome position 4.
Fig 2
Fig 2. Example of multi-layer genome search tree and its evolution.
We track the evolution of the multi-layer genome search tree starting from the genome search tree of Fig 1. Colors for the genome search tree are the same as in Fig 1 (right side of each panel). On the left side of each panel, we show an extract of the phylogenetic tree containing three nodes (“P” for parent, which in this example is the root of the phylogeny, and “L” and “R” for left and right node). “L” has further descendants, but we don’t show them here and only focus on this triplet of nodes as an example. The green arrow along the phylogenetic tree shows the current step of the preorder traversal being considered by the given panel. Black arrows show past steps. Vertical dashed lines in the multi-layer genome search tree connect nodes that represent the same portions of the genome but that are in different layers. “L0” stands for “Layer 0” and “L1” for “Layer 1”, etc. A At the phylogenetic root “P” we initialize the genome search tree for layer 0. B As we move to child “L”, a new substitution is sampled (as in Fig 1) and 3 corresponding genome nodes are created in layer 1. These nodes correspond to the nodes in the original genome search tree whose rate is affected by the new mutation. C As we traverse the subtree of the descendants of L, new nodes and mutations might be added in the layers below. D We are finished traversing the subtree of the descendants of L, and we return to L, at which point all nodes in layer below 1 have either been removed or have become irrelevant. E We return to P, at which point the genome search tree nodes previously added layer 1 are also ignored or deleted. F We move from P to R, and in doing so new mutation events might be sampled and the corresponding genome nodes might be added to layer 1 (new genome search tree nodes corresponding to 1 new substitution are shown in the new layer 1).
Fig 3
Fig 3. Comparison of running times of different simulators in a scenario similar to SARS-CoV-2 data.
On the Y axis we show the number of seconds it takes to perform simulations using different software. On the X axis is the number of tips simulated. Each point represents ten replicates. We do not run the most demanding simulators when each replicate would take substantially more than 1 minute to run. In red is the time to run phastSim with a concise output, and in orange is the time for phastSim with additionally generating a FASTA format output. In green is the demand of pyvolve, and in purple of Seq-Gen. In yellow and brown are respectively the time for running INDELible with method 1 (matrix exponentiation) and method 2 (Gillespie approach).
Fig 4
Fig 4. Comparison of running times of different simulators in a scenario similar to E. Coli outbreak data.
On the Y axis we show the number of seconds it takes to perform simulations using different software. On the X axis is the number of tips simulated. Each point represents ten replicates. We do not run Seq-Gen for more than 1000 tips due to high computational demand. In red is the time to run phastSim, and in orange is the time for phastSim with the simple, non-hierarchical approach. In purple is the time demand of Seq-Gen.
Fig 5
Fig 5. Comparison of running times of different simulators in a SARS-CoV-2 scenario using different evolutionary models.
On the Y axis we show the number of seconds it takes to perform simulations using different software. On the X axis is the model used for simulations: “nucleotide” is a nucleotide substitution model without variation; “nuc+10cat” is a nucleotide model with 10 rate categories; “nuc+alpha” is a nucleotide model with continuous variation in rate (each site has a distinct rate sampled from a Gamma distribution); “codon” represents a codon substitution model; “codon+10cat” represents a codon substitution model with 10 categories for ω; “codon+alpha” is a codon model with continuous rate variation in mutation rate and in ω (only allowed in phastSim). Each value represents ten replicates. Seq-Gen does not allow codon models. Colors are as in Fig 3. Here we used alignments of 1000 tips.
Fig 6
Fig 6. Comparison of running times of Indelible and phastSim simulators in a SARS-CoV-2 scenario with indels.
In this scenario we compare phastSim against Indelbile-m1 and Indelible-m2 (the only other methods considered here that model indels). Each value represents ten replicates.
Fig 7
Fig 7. Comparison of running times of different simulators in a SARS-CoV-2 scenario after rescaling the tree branch lengths by different factors.
On the Y axis we show the number of seconds it takes to perform simulations using different software. On the X axis is the rescaling factor we use to make the phylogenetic tree branch lengths longer or shorter. Colors are as in Fig 3. Here we used alignments of 5000 tips.

Update of

Similar articles

Cited by

References

    1. Arenas M. Simulation of molecular data under diverse evolutionary scenarios. PLoS Comput Biol. 2012;8(5):e1002495. doi: 10.1371/journal.pcbi.1002495 - DOI - PMC - PubMed
    1. Fletcher W, Yang Z. The effect of insertions, deletions, and alignment errors on the branch-site test of positive selection. Molecular biology and evolution. 2010;27(10):2257–2267. doi: 10.1093/molbev/msq115 - DOI - PubMed
    1. Jordan G, Goldman N. The effects of alignment error and alignment filtering on the sitewise detection of positive selection. Molecular biology and evolution. 2012;29(4):1125–1139. doi: 10.1093/molbev/msr272 - DOI - PubMed
    1. Vialle RA, Tamuri AU, Goldman N. Alignment modulates ancestral sequence reconstruction accuracy. Molecular biology and evolution. 2018;35(7):1783–1797. doi: 10.1093/molbev/msy055 - DOI - PMC - PubMed
    1. Worobey M, Pekar J, Larsen BB, Nelson MI, Hill V, Joy JB, et al.. The emergence of SARS-CoV-2 in Europe and North America. Science. 2020;370(6516):564–570. doi: 10.1126/science.abc8169 - DOI - PMC - PubMed

Publication types