Review
. 2022 May 27;7(5):1269-1299.
doi: 10.1021/acssensors.2c00149. Epub 2022 Apr 29.

Quantum Dots for Cancer-Related miRNA Monitoring

Affiliations
Review

Quantum Dots for Cancer-Related miRNA Monitoring

Catarina S M Martins et al. ACS Sens. .

Abstract

Quantum dots (QDs) possess exceptional optoelectronic properties that enable their use in the most diverse applications, namely, in the medical field. The prevalence of cancer has increased and has been considered the major cause of death worldwide. Thus, there has been a great demand for new methodologies for diagnosing and monitoring cancer in cells to provide an earlier prognosis of the disease and contribute to the effectiveness of treatment. Several molecules in the human body can be considered relevant as cancer markers. Studies published over recent years have revealed that micro ribonucleic acids (miRNAs) play a crucial role in this pathology, since they are responsible for some physiological processes of the cell cycle and, most important, they are overexpressed in cancer cells. Thus, the analytical sensing of miRNA has gained importance to provide monitoring during cancer treatment, allowing the evaluation of the disease's evolution. Recent methodologies based on nanochemistry use fluorescent quantum dots for sensing of the miRNA. Combining the unique characteristics of QDs, namely, their fluorescence capacity, and the fact that miRNA presents an aberrant expression in cancer cells, the researchers created diverse strategies for miRNA monitoring. This review aims to present an overview of the recent use of QDs as biosensors in miRNA detection, also highlighting some tutorial descriptions of the synthesis methods of QDs, possible surface modification, and functionalization approaches.

Keywords: bioconjugation; bioimaging; biosensor; cancer; detection; functionalization; miRNA; monitoring; quantum dots.


Conflict of interest statement

The authors declare no competing financial interest.

Figures
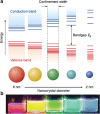
Figure 1
Figure 1
(a) Representative scheme of “quantum confinement” effect indicating that smaller QDs have higher band gap energy levels; (b) different colors of five colloidal dispersions of CdSe QDs with diameters from 6 to 2 nm, after UV excitation. Reprinted with permission from ref (23), Copyright 2016 The Authors under Creative Commons 4.0 Attribution License, published by Springer Nature.
Figure 2
Figure 2
Schematic representation of quantum dots surface modifications strategies.
Figure 3
Figure 3
Scheme of the cavity–chain surface modification of QDs. Reprinted with permission from ref (84). Copyright 2012 Elsevier.
Figure 4
Figure 4
Conjugation of MPA-capped CdTe QDs with amine-modified DNA, via EDC/NHS chemistry.
Figure 5
Figure 5
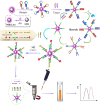
Schematic representation of the principle of the proposed biosensor for miRNA-21 and MUC1 detection, based on DCHA strategy. Reprinted with permission from ref (111). Copyright 2020 Elsevier.
Figure 6
Figure 6
(A) Graphical representation of the CV analysis for the different modified electrodes (a–f): bare GCE (a), GCE/Nafion/SQDs (b), GCE/Nafion/SQDs/AuNPs (c), GCE/Nafion/SQDs/AuNPs/Fc-tsDNA (d), GCE/Nafion/SQDs/AuNPs/Fc-tsDNA/HT (e), and GCE/Nafion/SQDs/AuNPs/Fc-tsDNA/HT/output DNA (f). The inset represents the enlarged partial CV curves. (B) Graphical representation of the ECL signals of the proposed biosensor: GCE/Nafion/SQDs/AuNPs (a), GCE/Nafion/SQDs/AuNPs/Fc-tsDNA/HT (b), and GCE/Nafion/SQDs/AuNPs/Fc-tsDNA/HT/output DNA (c). Reprinted with permission from ref (112). Copyright 2020 American Chemical Society.
Figure 7
Figure 7
Representation of the designed ECL biosensor for the detection of miRNA-21: (A) Construction process of the biosensor (AgNPs/SnO2 QDs/MnO2 NFs); (B) 3D DNA walker amplification procedure; (C) synergistic promotion strategy (CP, capture probes; HT, hexanethiol; MT, mimic targets). Reprinted with permission from ref (113). Copyright 2021 Elsevier.
Figure 8
Figure 8
Schematic representation of the ECL biosensor. (A) Graphic representation of the ECL-potential profiles. (B, C) Cyclic voltammetry of the modified electrodes: SnO2 QDs/GCE in PBS solution (a), SnO2 QDs/GCE (b), SnO2 QDs/MnO2 NFs/GCE (c), AgNPs/SnO2 QDs/MnO2 NFs/GCE (d), bare GCE (e), MnO2 NFs/GCE (f), and AgNPs/GCE (g) in S2O8 in 0.1 M PBS (pH 7.4). (D) Representation of the mechanism of luminescence of the different modified electrodes. Reprinted with permission from ref (113). Copyright 2021 Elsevier.
Figure 9
Figure 9
Representative scheme of the mechanism of PEC biosensor signal: (a) in the absence of the target and (b) in the presence of the target. Reprinted with permission from ref (122). Copyright 2019 American Chemical Society.
Figure 10
Figure 10
Representative scheme of assembly of the “on–off–on” PEC biosensor. (S1, represents DNA 1; S2, represents DNA 2). Reprinted with permission from ref (123). Copyright 2019 Elsevier.
Figure 11
Figure 11
Schematic representation of (A) Bi2Te3 nanosheets’ synthesis; (B) construction of PEC biosensor, and (C) mechanism for photocurrent generation. Reprinted with permission from ref (49). Copyright 2020 American Chemical Society.
Figure 12
Figure 12
Graphical representation of the PEC signals of CdS QDs/MB-based PEC biosensor, at 430 and 627 nm, under different conditions: (a) no targets; (b) 10 pM miRNA-21; (c) 10 pM let-7a; (d) 10 pM miRNA-21 + 10 pM let-7a. Reprinted with permission from ref (126). Copyright 2021 Elsevier.
Figure 13
Figure 13
Illustration of the assembly of the proposed sensing probe for the dual detection of miRNA-141 and miRNA-21. Reprinted with permission from ref (64). Copyright 2017 Elsevier.
Figure 14
Figure 14
RLS spectra of the functionalized QDs (red line), miRNA-122 (black line), and miRNA+QDs-P (blue line). Reprinted with permission from from ref (50). Copyright 2017 Elsevier.
Figure 15
Figure 15
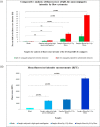
(i) Graphical representation of the results obtained through the comparative analysis of fluorescence intensity of QD-Ab nanoconjugates, synthesized by site-click and carbodiimide chemistry, by flow cytometry (mean values, n = 3). Bars represent mean ± SE values, and p ≤ 0.001 was considered statistically significant. (ii) Graphical representation of the mean fluorescence intensity measurements (n = 3) of the QD-Ab nanoconjugates, synthesized via carbodiimide chemistry, using fluorometry. Bars represent mean ± SE values, and p ≤ 0.0001 was considered statistically significant. Reprinted with permission from ref (75). Copyright 2020 Elsevier.

References

    1. World Health Organization . Cancer; https://www.who.int/news-room/fact-sheets/detail/cancer (accessed 2021-08-02).
    1. Tricoli J. V.; Jacobson J. W. MicroRNA: Potential for Cancer Detection, Diagnosis, and Prognosis. Cancer Res. 2007, 67 (10), 4553.10.1158/0008-5472.CAN-07-0563. - DOI - PubMed
    1. Amri C.; Shukla A. K.; Lee J. H. Recent Advancements in Nanoparticle-Based Optical Biosensors for Circulating Cancer Biomarkers. Materials 2021, 14 (6), 1339.10.3390/ma14061339. - DOI - PMC - PubMed
    1. Choi Y. E.; Kwak J. W.; Park J. W. Nanotechnology for Early Cancer Detection. Sensors 2010, 10 (1), 428–455. 10.3390/s100100428. - DOI - PMC - PubMed
    1. Fernandes M.; Teixeira A. L.; Medeiros R. The opportunistic effect of exosomes on Non-Hodgkin Lymphoma microenvironment modulation. Crit. Rev. Oncol. Hematol. 2019, 144, 102825.10.1016/j.critrevonc.2019.102825. - DOI - PubMed

Publication types