

A composite ranking of risk factors for COVID-19 time-to-event data from a Turkish cohort
- PMID: 35487152
- PMCID: PMC8993420
- DOI: 10.1016/j.compbiolchem.2022.107681
A composite ranking of risk factors for COVID-19 time-to-event data from a Turkish cohort
Abstract
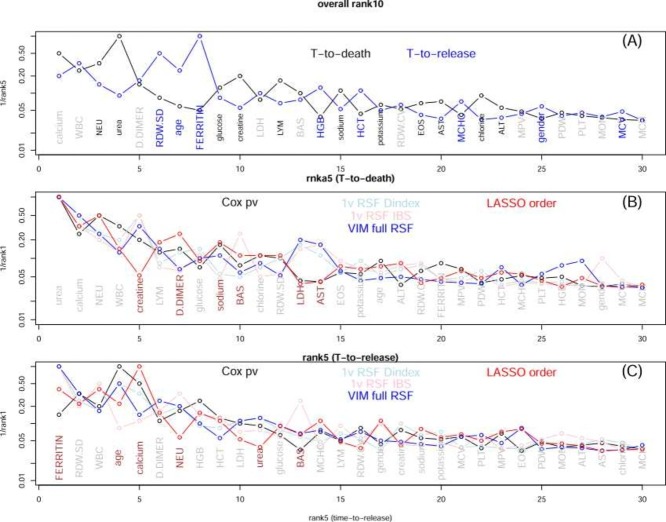
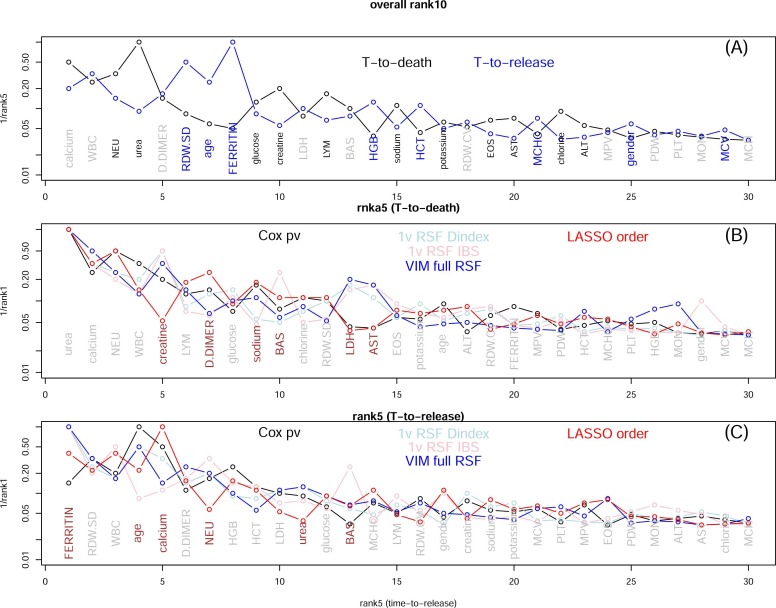
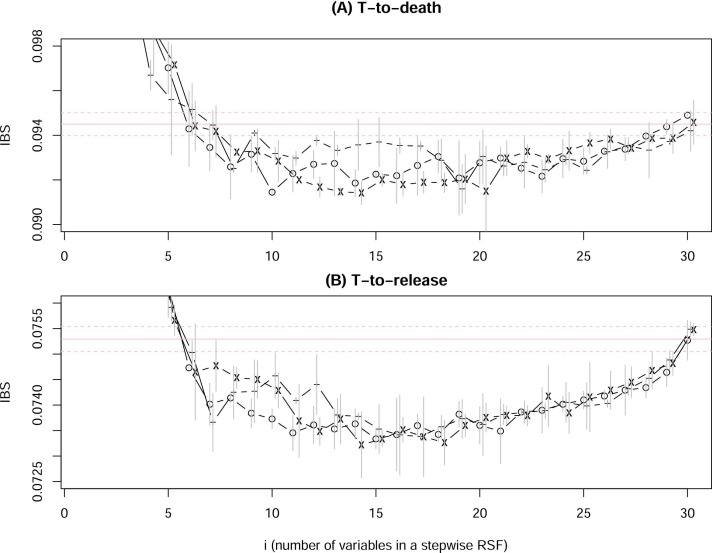
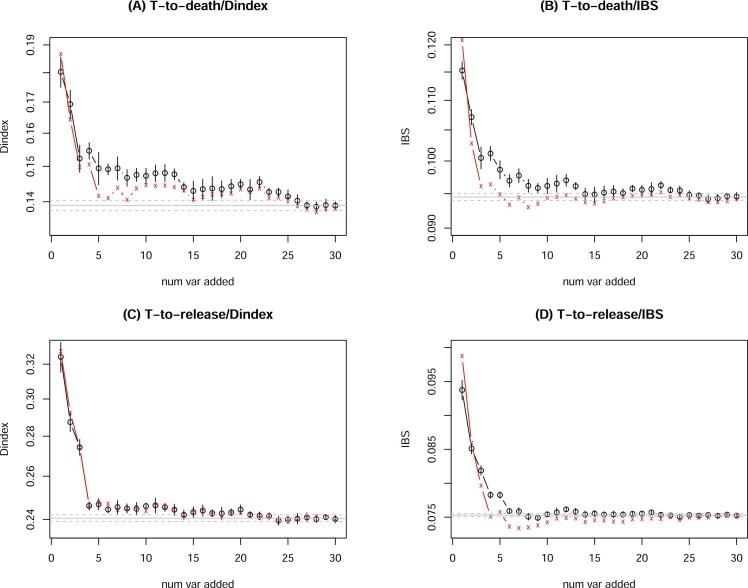
Having a complete and reliable list of risk factors from routine laboratory blood test for COVID-19 disease severity and mortality is important for patient care and hospital management. It is common to use meta-analysis to combine analysis results from different studies to make it more reproducible. In this paper, we propose to run multiple analyses on the same set of data to produce a more robust list of risk factors. With our time-to-event survival data, the standard survival analysis were extended in three directions. The first is to extend from tests and corresponding p-values to machine learning and their prediction performance. The second is to extend from single-variable to multiple-variable analysis. The third is to expand from analyzing time-to-decease data with death as the event of interest to analyzing time-to-hospital-release data to treat early recovery as a meaningful event as well. Our extension of the type of analyses leads to ten ranking lists. We conclude that 20 out of 30 factors are deemed to be reliably associated to faster-death or faster-recovery. Considering correlation among factors and evidenced by stepwise variable selection in random survival forest, 10 ~ 15 factors seem to be able to achieve the optimal prognosis performance. Our final list of risk factors contain calcium, white blood cell and neutrophils count, urea and creatine, d-dimer, red cell distribution widths, age, ferritin, glucose, lactate dehydrogenase, lymphocyte, basophils, anemia related factors (hemoglobin, hematocrit, mean corpuscular hemoglobin concentration), sodium, potassium, eosinophils, and aspartate aminotransferase.
Keywords: COVID-19; Competing risks; Composite ranking; Survival analysis.
Copyright © 2022 Elsevier Ltd. All rights reserved.
Conflict of interest statement
There is no conflict of interest to declare.
Figures
References
-
- Aljameel S.S., Khan I.U., Aslam N., Aljabri M., Alsulmi E.S. Machine learning-based model to predict the disease severity and outcome in COVID-19 patients. Sci. Program. 2021;2021
-
- Allison P. Event History Analysis: Regression for Longitudinal Event Data. 2nd edition. SAGE Publications; 2014.
Publication types
MeSH terms
LinkOut - more resources
Full Text Sources
Medical
