. 2022 May 10;17(5):1081-1088.
doi: 10.1016/j.stemcr.2022.04.001. Epub 2022 Apr 28.

Prepubertal androgen signaling is required to establish male fat distribution

Affiliations

Prepubertal androgen signaling is required to establish male fat distribution

Zachary L Sebo et al. Stem Cell Reports. .

Abstract

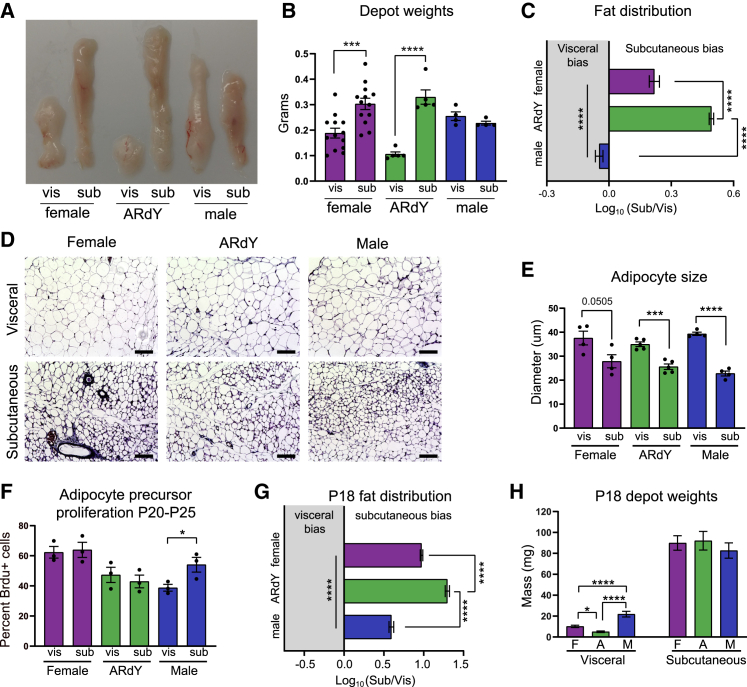
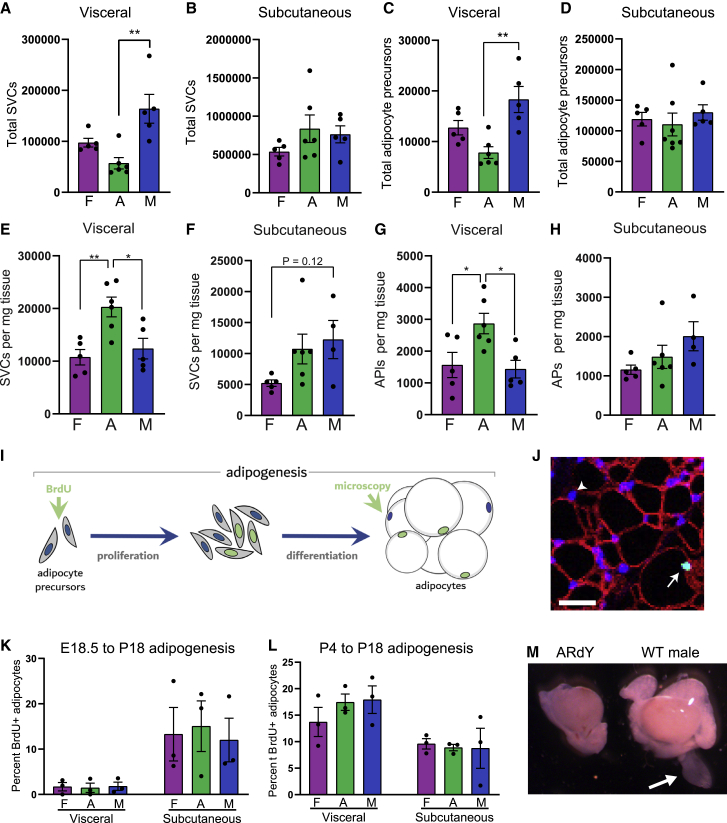
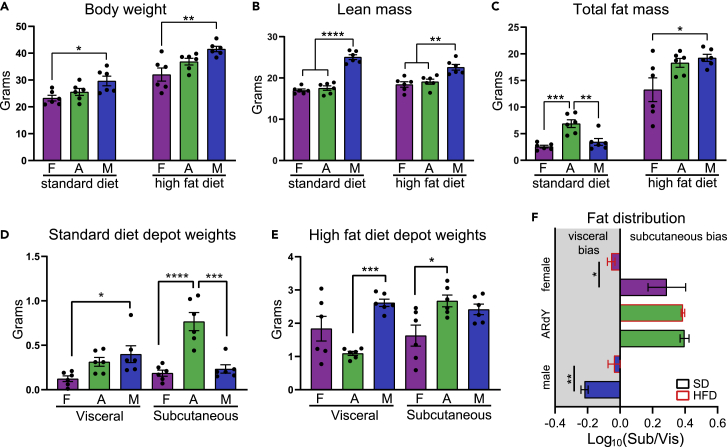
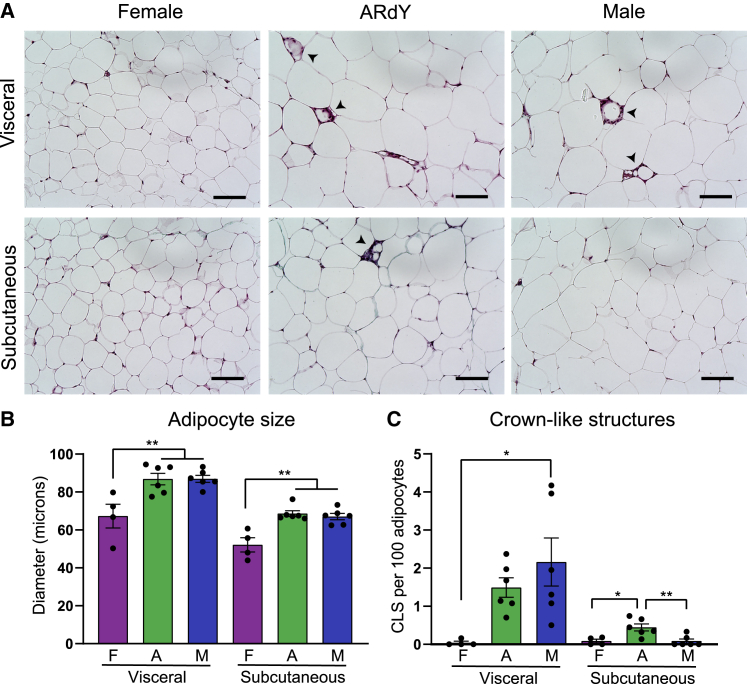
Fat distribution is sexually dimorphic and is associated with metabolic disease risk. It is unknown if prepubertal sex-hormone signaling influences adult fat distribution. Here, we show that karyotypically male androgen-insensitive mice exhibit pronounced subcutaneous adiposity compared with wild-type males and females. This subcutaneous adipose bias emerges prior to puberty and is not due to differences in adipocyte size or rates of adipogenesis between visceral and subcutaneous fat. Instead, we find that androgen-insensitive mice lack an adequate progenitor pool for normal visceral-fat expansion during development, thus increasing the subcutaneous-to-visceral-fat ratio. Obesogenic visceral-fat expansion is likewise inhibited in these mice, yet their metabolic health is similar to wild-type animals with comparable total fat mass. Taken together, these data show that adult fat distribution can be determined prior to the onset of puberty by the relative number of progenitors that seed nascent adipose depots.

Keywords: adipocyte; adipocyte precursors; adipose; androgen; fat distribution; obesity; progenitors.


Figures

Figure 1
Figure 1
Subcutaneous adiposity dominates in ARdY mice (A) Image of visceral and subcutaneous adipose depots of 7-week-old mice. (B) Visceral and subcutaneous adipose depot weights of 7-week-old mice (n = 4–13). (C) Fat distribution of 7-week-old mice (n = 4–13). (D) Images of visceral and subcutaneous adipose tissue from 7-week-old mice. (E) Adipocyte sizes from visceral and subcutaneous adipose depots of 7-week-old mice (n = 4–5). (F) Adipocyte precursor proliferation of adolescent mice in visceral and subcutaneous adipose depots (n = 3). (G) Fat distribution of 18-day-old mice (n = 11–23). (H) Visceral and subcutaneous adipose depot weights of 18-day-old mice (n = 11–23). Statistical significance in (B), (E), and (F) was determined by unpaired two-tailed Student’s t test to compare depots within the same genotype. Statistical significance in (C), (G), and (H) was determined by ordinary one-way ANOVA with Tukey’s multiple comparison’s test. vis, visceral; sub, subcutaneous.
Figure 2
Figure 2
ARdY fat distribution is determined by reduced progenitor seeding in nascent visceral fat (A) Total stromal vascular cells (SVCs) in visceral fat of 18- to 21-day-old mice (n = 5–6). (B) Total SVCs in subcutaneous fat of 18- to 21-day-old mice (n = 5–6). (C) Total adipocyte precursor cells in visceral fat of 18- to 21-day-old mice (n = 4–6). (D) Total adipocyte precursor cells in subcutaneous fat of 18- to 21-day-old mice (n = 4–6). (E) SVCs per mg visceral fat (n = 5–6). (F) SVCs per mg subcutaneous fat (n = 4–6). (G) Adipocyte precursors per mg visceral fat (n = 5–6). (H) Adipocyte precursors per mg subcutaneous fat (n = 4–6). (I) Schematic of adipogenesis in vivo. (J) Image showing how BrdU+ adipocytes are identified. Arrowhead shows DAPI+ adipocyte nucleus. Arrow shows BrdU+/DAPI+ adipocyte nucleus. Non-adipocyte nuclei are surrounded by stained plasma membranes, as described in Jeffery et al. (2015). Scalebar, 25 μm. (K) New adipocyte formation from E18.5 to P18 (n = 3). (L) New adipocyte formation from P4 to P18 (n = 3). (M) Image of P4 testis and surrounding structures in ARdY and male mice. Arrow shows epididymal appendage. Statistical significance was determined by ordinary one-way ANOVA with Tukey’s multiple comparison’s test. AP, adipocyte precursor; F, female; A, ARdY; M, male; WT, wild type.
Figure 3
Figure 3
ARdY mice develop subcutaneous obesity on a high-fat diet (HFD) due to reduced visceral-fat growth (A) Body weight of 15-week-old mice fed either a standard diet or an HFD (n = 6). (B) Lean mass of 15-week-old mice fed either a standard diet or an HFD as determined by MRI (n = 6). (C) Total fat mass of 15-week-old mice fed either a standard diet or an HFD as determined by MRI (n = 6). (D) Visceral and subcutaneous depot weights of 15-week-old mice on standard diet (n = 6). (E) Visceral and subcutaneous depot weights of 15-week-old mice on HFD (n = 6). (F) Fat distribution of 15-week-old mice on standard diet or HFD (n = 6). Statistical significance in (A)–(E) was determined by ordinary one-way ANOVA with Tukey’s multiple comparisons test. Statistical significance in (F) was determined by an unpaired two-tailed Student’s t test. F, female; A, ARdY; M, male; Sub, subcutaneous; Vis, visceral.
Figure 4
Figure 4
Adipocyte hypertrophy and adipocyte death are normal in obese ARdY visceral fat (A) Representative images of visceral and subcutaneous fat in 15-week-old mice fed HFD for 8 weeks. Arrowheads show crown-like structures. Scalebar, 100 μm. (B) Adipocyte size in visceral and subcutaneous fat of 15-week-old mice fed HFD for 8 weeks (n = 4–6). (C) Crown-like structures per 100 adipocytes in visceral and subcutaneous fat of 15-week-old mice fed HFD for 8 weeks (n = 4–6). Statistical significance in (B) and (C) was determined by ordinary one-way ANOVA with Tukey’s multiple comparisons test. F, female; A, ARdY; M, male.

Similar articles

Cited by

References

    1. Abràmoff M.D., Magalhães P.J., Ram S.J. Image processing with ImageJ. Biophotonics Int. 2004;11:36–42.
    1. Barkley M.S., Goldman B.D. A quantitative study of serum testosterone, sex accessory organ growth, and the development of intermale aggression in the mouse. Horm. Behav. 1977;8:208–218. - PubMed
    1. Berry R., Rodeheffer M.S. Characterization of the adipocyte cellular lineage in vivo. Nat. Cell Biol. 2013;15:302–308. - PMC - PubMed
    1. Birsoy K., Berry R., Wang T., Ceyhan O., Tavazoie S., Friedman J.M., Rodeheffer M.S. Analysis of gene networks in white adipose tissue development reveals a role for ETS2 in adipogenesis. Development. 2011;138:4709–4719. - PMC - PubMed
    1. Carpenter A.E., Jones T.R., Lamprecht M.R., Clarke C., Kang I.H., Friman O., Guertin D.A., Chang J.H., Lindquist R.A., Moffat J. CellProfiler: image analysis software for identifying and quantifying cell phenotypes. Genome Biol. 2006;7:R100. - PMC - PubMed

Publication types

LinkOut - more resources