. 2022 Aug;163(2):411-425.e4.
doi: 10.1053/j.gastro.2022.04.031. Epub 2022 Apr 26.

Toll-like Receptor 9 Pathway Mediates Schlafen+-MDSC Polarization During Helicobacter-induced Gastric Metaplasias

Affiliations

Toll-like Receptor 9 Pathway Mediates Schlafen+-MDSC Polarization During Helicobacter-induced Gastric Metaplasias

Lin Ding et al. Gastroenterology. 2022 Aug.

Abstract

Background & aims: A subset of myeloid-derived suppressor cells (MDSCs) that express murine Schlafen4 (SLFN4) or its human ortholog SLFN12L polarize in the Helicobacter-inflamed stomach coincident with intestinal or spasmolytic polypeptide-expressing metaplasia. We propose that individuals with a more robust response to damage-activated molecular patterns and increased Toll-like receptor 9 (TLR9) expression are predisposed to the neoplastic complications of Helicobacter infection.

Methods: A mouse or human Transwell co-culture system composed of dendritic cells (DCs), 2-dimensional gastric epithelial monolayers, and Helicobacter were used to dissect the cellular source of interferon-α (IFNα) in the stomach by flow cytometry. Conditioned media from the co-cultures polarized primary myeloid cells. MDSC activity was determined by T-cell suppression assays. In human subjects with intestinal metaplasia or gastric cancer, the rs5743836 TLR9T>C variant was genotyped and linked to TLR9, IFNα, and SLFN12L expression by immunohistochemistry. Nuclear factor-κB binding to the TLR9 C allele was determined by electrophoretic mobility shift assays.

Results: Helicobacter infection induced gastric epithelial and plasmacytoid DC expression of TLR9 and IFNα. Co-culturing primary mouse or human cells with DCs and Helicobacter induced TLR9, IFNα secretion, and SLFN+-MDSC polarization. Neutralizing IFNα in vivo mitigated Helicobacter-induced spasmolytic polypeptide-expressing metaplasia. The TLR9 minor C allele creates a nuclear factor-κB binding site associated with higher levels of TLR9, IFNα, and SLFN12L in Helicobacter-infected stomachs that correlated with a greater incidence of metaplasias and cancer.

Conclusions: TLR9 plays an essential role in the production of IFNα and polarization of SLFN+ MDSCs on Helicobacter infection. Subjects carrying the rs5743836 TLR9 minor C allele are predisposed to neoplastic complications if chronically infected.

Keywords: 2-D Organoid-Derived Monolayer; DAMPs; IFNα; Plasmacytoid Dendritic Cells; SPEM.


Conflict of interest statement

Declaration of Interests: The authors have declared that no competing interests exist.

Figures

Figure 1.
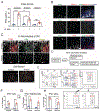
Figure 1.. H. felis infection induced gastric epithelial and pDC expression of IFNα.
Mice were infected with H. felis for 2 months. (A) IFNα levels in the corpus, antrum and serum from uninfected and infected mice were measured by ELISA. (B) Immunofluorescent images for IFNα (green), PDCA-1(red), E-cadherin (white) and TFF2 (red) in the gastric corpus of 2-month H. felis–infected mice. Scale bars: 10 μm. (C) Representative immunofluorescent images of gastric corpus and antrum immunostained for IFNα (green), TLR9 (red) and E-cadherin (white). Scale bars: 50 μm. Arrowheads indicate IFNα+TLR9+ cells within lamina propria (blue) and epithelial cells (pink), respectively. (D-E) Single cell suspensions from corpus or antrum were analyzed for IFNα, EpCam, CD45, PDCA-1, CD11c. Gated IFNα+CD45+PDCA-1+CD11c+ cells were further analyzed for MHCII and CD11b. Gated (F) IFNα+, (G) IFNα+ EpCam+ epithelial cells and (H) IFNα+ PDCA-1+CD11c+ pDC subpopulations as a percent of total number of gastric cell are shown in bar graphs. Shown are the median and interquartile range for N=4 mice per group. *P< .05. **P< .01. ***P< .001. ****p< .0001. N=4 mice per group.
Figure 2.
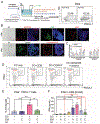
Figure 2.. pDCs and epithelial cells secrete IFNα in the mouse co-cultures.
(A) Schematic of the transwell system comprised of mouse pDCs, 2-dimensional (2-D) epithelial monolayers derived from corpus (CEM) versus antral (AEM) organoids co-cultured with or without (MOI of 4) H. felis. pDCs were generated from mouse bone marrow cells by treating with recombinant Flt-3 ligand (~65% of these cells were PDCA-1+) seeded in the bottom of the Transwell. These polarized DCs were pre-incubated with or without TLR9 antagonist ODN2088. Live H. felis was then added to the upper Transwell chamber supporting the 2-D monolayers. Conditioned media (CdM) were collected from the bottom well 48 h after initiating the co-culture. A neutralizing antibody against IFNα was added to the CdM to identify the effect of IFNα. Thioglycollate-elicited peritoneal myeloid cells (TG cells) from Slfn4-tdTomato (Slfn4-tdT) mice were treated with CdM for 24 h, and then co-cultured with CFSE-pre-stained CTL cells for 72 h. (B) Brightfield (BF) and immunofluorescent (IF) staining of CEM vs AEM cultures demonstrating the expression of H+K+-ATPase (H, K-ATP4A, red), Pepsinogen C (PGC, green), surface mucous cells (UEAI, red) in CEM, and gastrin (green) and Chromogranin A (red) in AEM. Scale bar, BF 25μm, IF 50μm. (C) RT-PCR was performed using RNA extracted from mouse tissue and 2D monolayers quantify the expression of Atp4a, PgC, Muc5ac (M5), Muc6 (M6) and gastrin (Gast) (bar graphs). (D) 48 h after co-culture, pDCs in the bottom well were analyzed for IFNα by flow cytometry. (E) Bar graphs show the quantitation. (F) An ELISA assay was performed to determine IFNα levels in the CdM. Horizontal lines represent the median and interquartile range. N=4 expts. *P< .05. **P< .01. ***P< .001. ****p< .0001.
Figure 3.
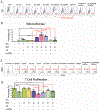
Figure 3.. pDCs and epithelial cells induce Slfn4+-MDSCs via IFNα.
Thioglycollate-elicited peritoneal myeloid cells (TG cells) from Slfn4-tdTomato (Slfn4-tdT) mice were treated with CdM from the 2-D monolayers/pDCs/H. felis co-culture (Figure 2) for 24 h, and then co-cultured with CFSE-prestained CTLs for 72 h. Flow cytometry was performed to analyze (A) the epifluorescence of Slfn4-tdT cells and (B) CFSE-based T cell suppression assay. The left three representative histograms in (B) show proliferation of control groups: No CFSE, without and with anti-CD3/28 microbeads to activate T cell proliferation. A neutralizing antibody against IFNα was added to the CdM to determine the effect of IFNα by flow cytometry (C) and quantified in the bar graphs (D). Horizontal lines represent the median and interquartile range for N=4 expts. *P< .05. **P< .01. ***P< .001. ****P< .0001.
Figure 4.
Figure 4.. Human organoids/DCs/H. pylori co-culture experiment.
(A) Schematic of the transwell system comprised of human DCs, 2-dimensional (2-D) corpus organoid-derived monolayers co-cultured with or without (UI) H. pylori. Dendritic cells were generated from PBMCs by treating with GMCSF seeded in the bottom of the transwell. Wild type H. pylori G27 strain and its CagA-mutant strain G27ΔCag were added to the upper Transwell chamber supporting the 2-D organoid-derived monolayers. Conditioned media (CdM) were collected from the bottom well 48 h after initiating the co-culture. A neutralizing antibody against IFNα was added to the CdM to determine the effect of IFNα. SLFN12L+-MDSCs and CFSE-prestained CTLs from PBMCs were treated with CdM and then co-cultured together for 72 h. Flow cytometry was performed to analyze (B) SLFN12L and (D) Standard MDSC markers CD33, CD11b and (F) TLR9 in the DCs in the bottom of the well. (C, E, G) Bar graphs show the quantitation as a percentage of PBMCs. Horizontal lines represent the median and interquartile range for N=4 expts. *P< .05. **P< .01. ***P< .001. ****P< .0001.
Figure 5.
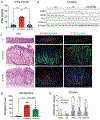
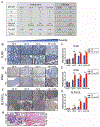
Figure 5.. Neutralizing IFNα in vivo during H. felis infection reduces SPEM.
(A) IFNα levels in the corpus from uninfected, infected and IFNα neutralized mice were measured by ELISA. (B) Western blot of SLFN4, ATP4B, TFF2 and CD44v9 expression in mouse corpus, β-Tubulin as a loading control. (C) Histologic changes were shown by H&E, ATP4b (green), GSII (green), TFF2 (red) and Clusterin (green) IF. Scale bar, 50μm. (D) Corpus metaplasia weighted score for n=7 mice per group. One-way ANOVA followed by Friedman test was performed. (E) SPEM markers ATP4b, Gastric intrinsic factor (Gif), Tff2, Clusterin (Clu) and CD44v9 mRNA were analyzed by qPCR. One-way ANOVA followed by Tukey’s multiple comparisons test on log-transformed values is shown. Horizontal lines represent the median and interquartile range for n=7 mice per group over 2 experiments. *P< .05. ***P< .001. ****p< .0001. NS, not significant.
Figure 6.
Figure 6.. The rs5743836 TLR9T>C SNP correlated with IM, GAC and higher TLR9/IFNα/SLFN12L expression in the infected stomach.
(A) Association of the minor TLR9 C allele (at −1237 from promoter start site) frequency with gastric metaplasia or gastric cancer (GAC) in Vietnamese and Chinese patient cohorts. * P< .05 over uninfected control group within the cohort. NS, not significant. HP: H. pylori; G: Gastritis; A:gastric atrophy; IM:Intestinal metaplasia; GAC:gastric cancer. Representative images showing IHC staining for (B) TLR9 (D) IFNα and (F) SLFN12L in gastric biopsies from uninfected Vietnamese patients with gastritis (Hp G), H. pylori-infected gastritis (Hp+ G), H. pylori-infected patients with gastric atrophy (Hp+ A) or H. pylori-infected patients with atrophy and IM (Hp+ A+IM) carrying both major T alleles TLR9 −1237T/T or carrying at least one minor TLR9 −1237C allele. Mag: 200X. Histologic scoring of (C) TLR9 (E) IFNα and (G) SLFN12L were shown as bar graphs. Kruskal-Wallis ANOVA with Dunn’s test of multiple comparisons was performed. (H) Representative Alcian blue staining for patients with intestinal metaplasia and atrophy and carrying either the T/T or T/C alleles. Horizontal lines represent the median and interquartile range. *P< .05. **P< .01. ***P< .001. ****P< .0001.
Figure 7.
Figure 7.. NFkB binding activity correlated with rs5743836TLR9C allele.
HEK-293 cells were treated with PBS (Con) or TNFα (30ng/mL) for 30 min to induce NFκB prior to extracting nuclear proteins. (A) A western blot was performed to confirm NFκB expression in 5, 10, 20 μg of nuclear extract. Histone H3 was the loading control. (B) Electrophoretic mobility shift assays (EMSA) were performed to demonstrate NFκB DNA binding to the double-stranded probe consisting of only the major T allele TLR9 −1237T (Probe T) versus the minor C allele −1237C (Probe C). NFκB, nonspecific binding (NS), and free probe are indicated by arrows. 200-fold excess of unlabeled (cold) probe was used as competitor. (C) Two concentrations of NFκB antibody (0.2; 0.4 μg/μL) was used to disrupt and supershift the protein bound to Probe C.

References

    1. Ding L, Hayes MM, Photenhauer A, et al. Schlafen 4-expressing myeloid-derived suppressor cells are induced during murine gastric metaplasia. The Journal of clinical investigation 2016;126:2867–80. - PMC - PubMed
    1. Schwarz DA, Katayama CD, Hedrick SM. Schlafen, a new family of growth regulatory genes that affect thymocyte development. Immunity 1998;9:657–68. - PubMed
    1. Geserick P, Kaiser F, Klemm U, et al. Modulation of T cell development and activation by novel members of the Schlafen (slfn) gene family harbouring an RNA helicase-like motif. Int Immunol 2004;16:1535–48. - PubMed
    1. van Zuylen WJ, Garceau V, Idris A, et al. Macrophage activation and differentiation signals regulate schlafen-4 gene expression: evidence for Schlafen-4 as a modulator of myelopoiesis. PLoS One 2011;6:e15723. - PMC - PubMed
    1. Katsoulidis E, Mavrommatis E, Woodard J, et al. Role of interferon {alpha} (IFN{alpha})-inducible Schlafen-5 in regulation of anchorage-independent growth and invasion of malignant melanoma cells. J Biol Chem 2010;285:40333–41. - PMC - PubMed

Publication types