

Targeting IL8 as a sequential therapy strategy to overcome chemotherapy resistance in advanced gastric cancer
- PMID: 35487914
- PMCID: PMC9055054
- DOI: 10.1038/s41420-022-01033-1
Targeting IL8 as a sequential therapy strategy to overcome chemotherapy resistance in advanced gastric cancer
Abstract
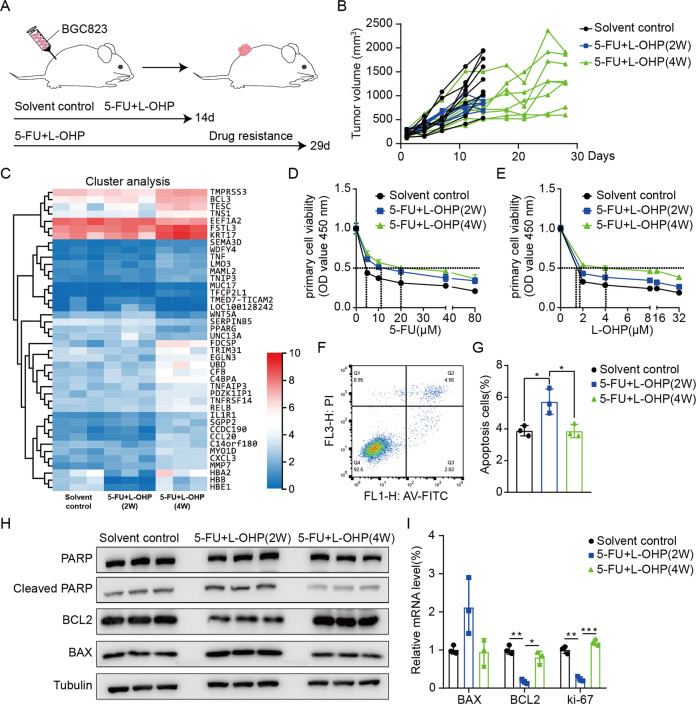
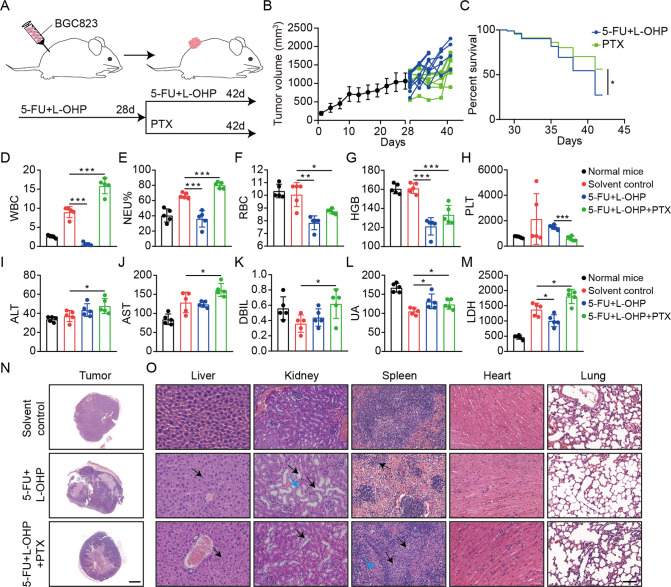
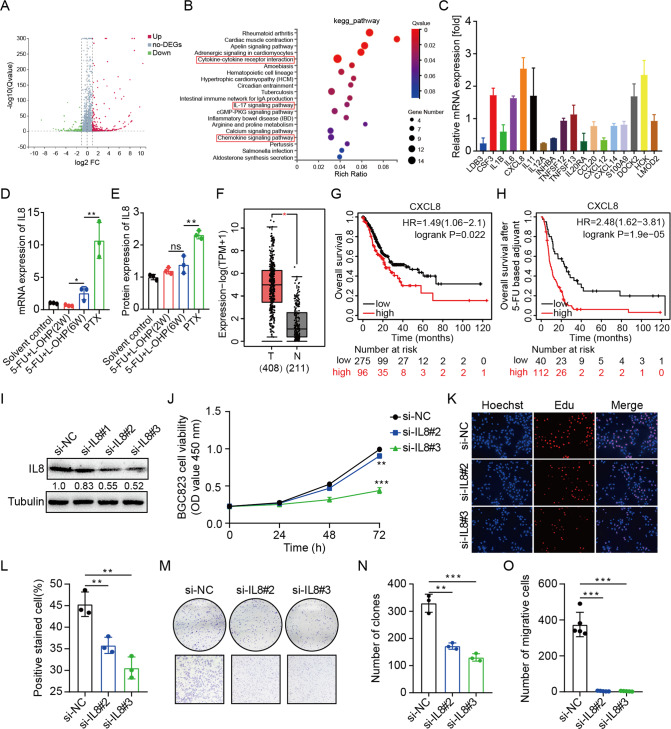
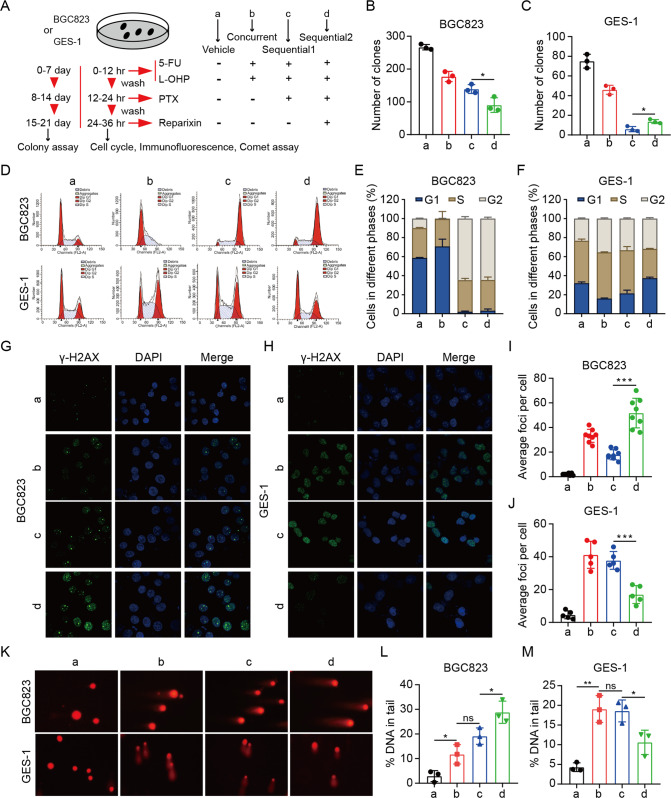
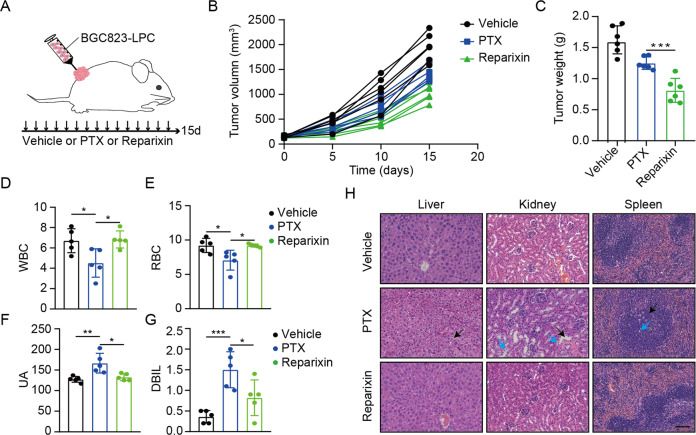
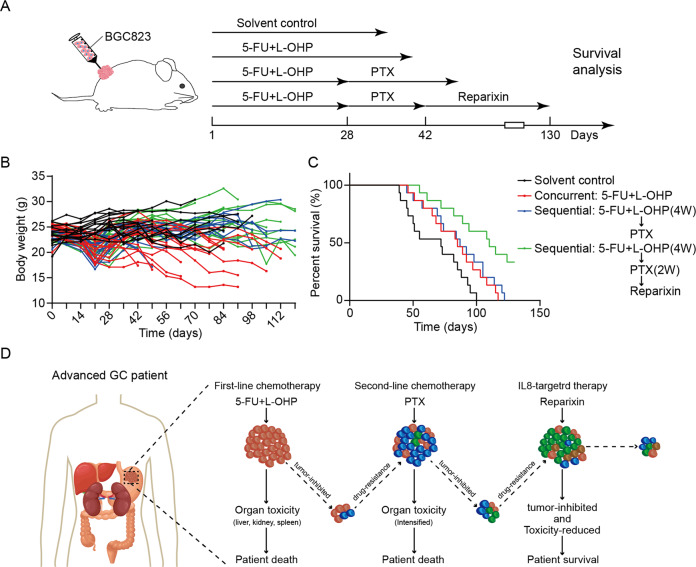
Systemic chemotherapy with multiple drug regimens is the main therapy option for advanced gastric cancer (GC) patients. However, many patients develop relapse soon. Here, we evaluated the therapeutic potential of targeting interleukin-8 (IL8) to overcome resistance to chemotherapy in advanced GC. RNA sequencing revealed crucial molecular changes after chemotherapy resistance, in which the expression of IL8 was significantly activated with the increase in drug resistance. Subsequently, the clinical significance of IL8 expression was determined in GC population specimens. IL8-targeted by RNA interference or reparixin reversed chemotherapy resistance with limited toxicity in vivo and vitro experiments. Sequential treatment with first-line, second-line chemotherapy and reparixin inhibited GC growth, reduced toxicity and prolonged survival. Collectively, our study provides a therapeutic strategy that targeting IL8 as a sequential therapy after chemotherapy resistance in advanced GC.
© 2022. The Author(s).
Conflict of interest statement
The authors declare no competing interests.
Figures
Similar articles
-
Targeting interleukin-6 as a strategy to overcome stroma-induced resistance to chemotherapy in gastric cancer.Mol Cancer. 2019 Mar 30;18(1):68. doi: 10.1186/s12943-019-0972-8. Mol Cancer. 2019. PMID: 30927911 Free PMC article.
-
Chemotherapy-Induced IL8 Upregulates MDR1/ABCB1 in Tumor Blood Vessels and Results in Unfavorable Outcome.Cancer Res. 2020 Jul 15;80(14):2996-3008. doi: 10.1158/0008-5472.CAN-19-3791. Epub 2020 Jun 14. Cancer Res. 2020. PMID: 32536602
-
Targeting PI3K/Akt/mTOR Pathway Identifies Differential Expression and Functional Role of IL8 in Liver Cancer Stem Cell Enrichment.Mol Cancer Ther. 2019 Nov;18(11):2146-2157. doi: 10.1158/1535-7163.MCT-19-0004. Epub 2019 Aug 22. Mol Cancer Ther. 2019. PMID: 31439713
-
Molecular Mechanism of Resistance to Chemotherapy in Gastric Cancers, the Role of Autophagy.Curr Drug Targets. 2020;21(7):713-721. doi: 10.2174/1389450120666191127113854. Curr Drug Targets. 2020. PMID: 31775598 Review.
-
Overview of resistance to systemic therapy in patients with breast cancer.Adv Exp Med Biol. 2007;608:1-22. doi: 10.1007/978-0-387-74039-3_1. Adv Exp Med Biol. 2007. PMID: 17993229 Review.
Cited by
-
Ballota hirsuta Benth Arrests the Cell Cycle, Induces Apoptosis and Inhibits the Invasion of MCF-7 and MDA-MB-231 Cell Lines in 2D and 3D Models.Int J Mol Sci. 2025 Jun 13;26(12):5672. doi: 10.3390/ijms26125672. Int J Mol Sci. 2025. PMID: 40565136 Free PMC article.
-
Interleukin-8/CXCR1 Signaling Contributes to the Progression of Pulmonary Adenocarcinoma Resulting in Malignant Pleural Effusion.Cells. 2024 Jun 3;13(11):968. doi: 10.3390/cells13110968. Cells. 2024. PMID: 38891100 Free PMC article.
-
Impacts of loading thymoquinone to gold or silver nanoparticles on the efficacy of anti-tumor treatments in breast cancer with or without chemotherapeutic cisplatin.BMC Biotechnol. 2025 Apr 10;25(1):26. doi: 10.1186/s12896-025-00958-6. BMC Biotechnol. 2025. PMID: 40211258 Free PMC article.
-
Tumor‑associated neutrophils: Critical regulators in cancer progression and therapeutic resistance (Review).Int J Oncol. 2025 Apr;66(4):28. doi: 10.3892/ijo.2025.5734. Epub 2025 Feb 28. Int J Oncol. 2025. PMID: 40017131 Free PMC article. Review.
-
Cytokine-mediated crosstalk between cancer stem cells and their inflammatory niche from the colorectal precancerous adenoma stage to the cancerous stage: Mechanisms and clinical implications.Front Immunol. 2022 Nov 17;13:1057181. doi: 10.3389/fimmu.2022.1057181. eCollection 2022. Front Immunol. 2022. PMID: 36466926 Free PMC article. Review.
References
-
- Kang YK, Chin K, Chung HC, Kadowaki S, Oh SC, Nakayama N, et al. S-1 plus leucovorin and oxaliplatin versus S-1 plus cisplatin as first-line therapy in patients with advanced gastric cancer (SOLAR): a randomised, open-label, phase 3 trial. Lancet Oncol. 2020;21:1045–56. doi: 10.1016/S1470-2045(20)30315-6. - DOI - PubMed
-
- Muro K, Van Cutsem E, Narita Y, Pentheroudakis G, Baba E, Li J, et al. Pan-Asian adapted ESMO Clinical Practice Guidelines for the management of patients with metastatic gastric cancer: a JSMO-ESMO initiative endorsed by CSCO, KSMO, MOS, SSO and TOS. Ann Oncol. 2019;30:19–33. doi: 10.1093/annonc/mdy502. - DOI - PubMed
LinkOut - more resources
Full Text Sources
Miscellaneous
