. 2022 Apr 29;13(1):2339.
doi: 10.1038/s41467-022-30033-z.

Reference-free cell type deconvolution of multi-cellular pixel-resolution spatially resolved transcriptomics data

Affiliations

Reference-free cell type deconvolution of multi-cellular pixel-resolution spatially resolved transcriptomics data

Brendan F Miller et al. Nat Commun. .

Abstract

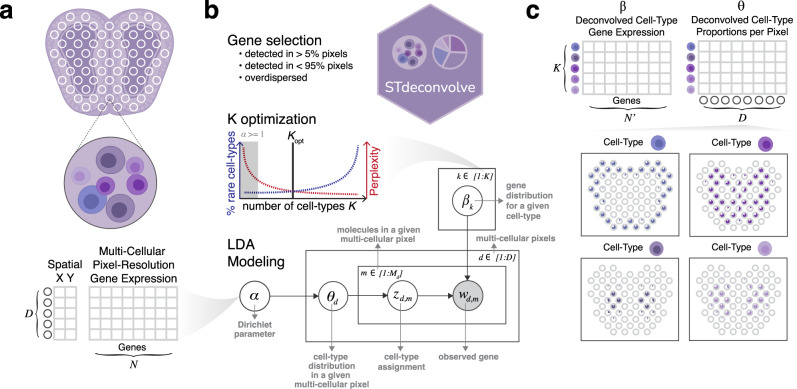
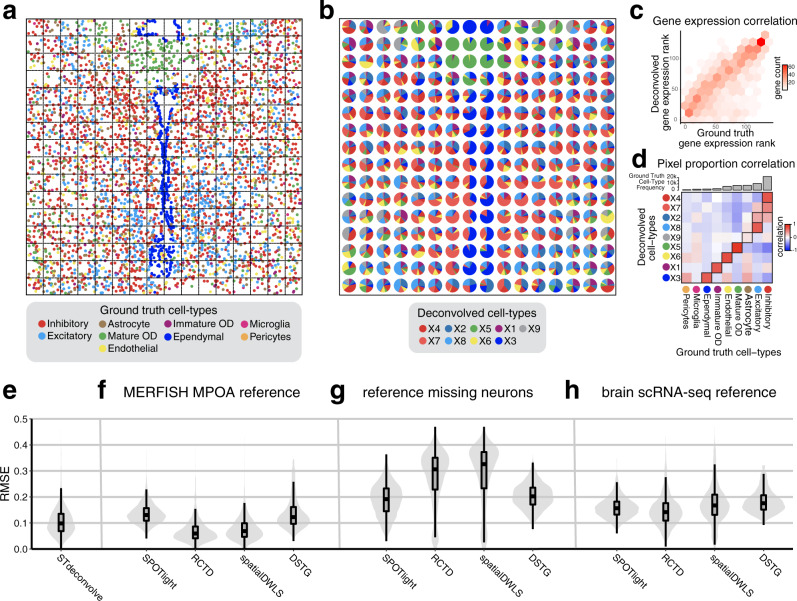
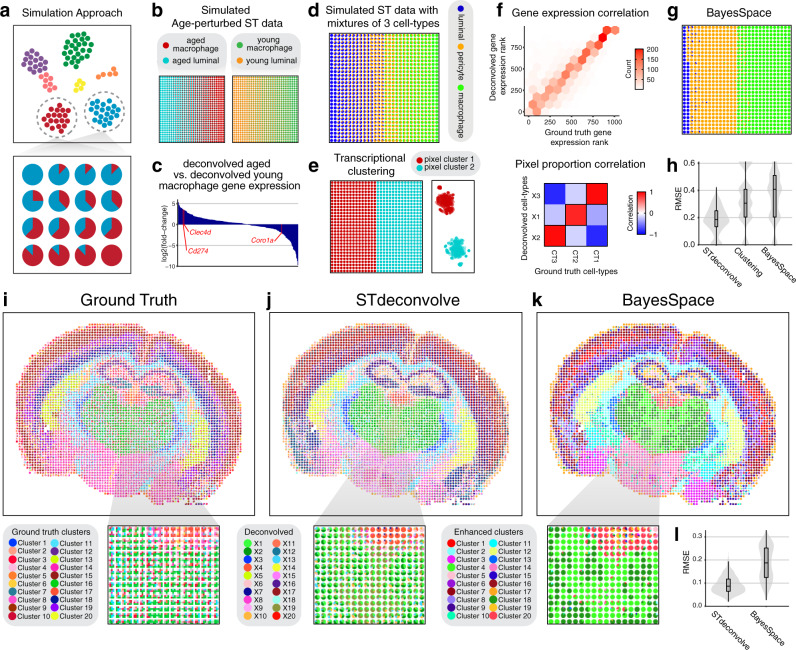
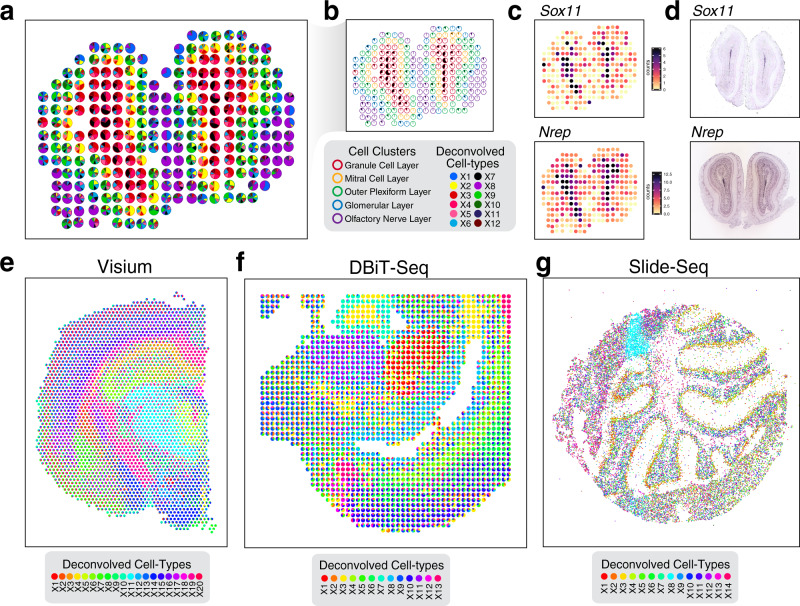
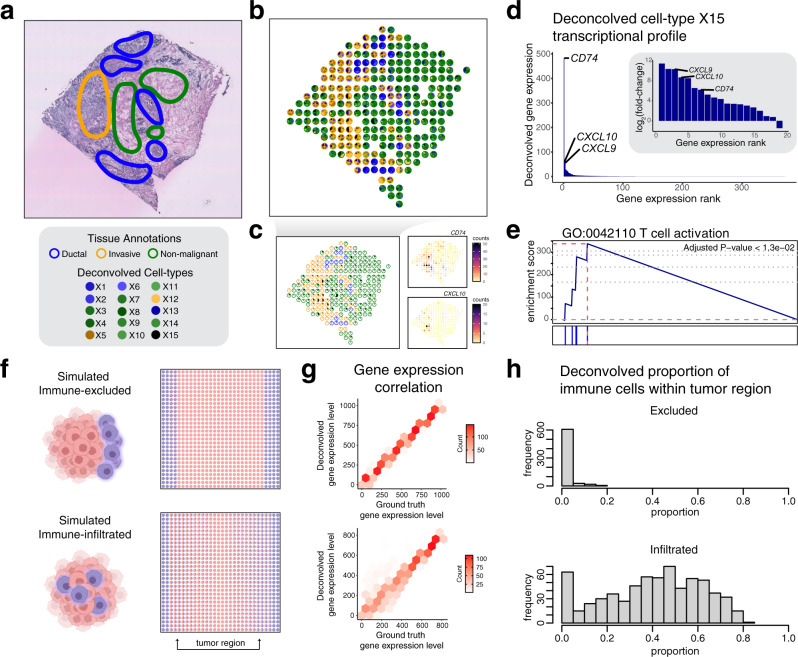
Recent technological advancements have enabled spatially resolved transcriptomic profiling but at multi-cellular pixel resolution, thereby hindering the identification of cell-type-specific spatial patterns and gene expression variation. To address this challenge, we develop STdeconvolve as a reference-free approach to deconvolve underlying cell types comprising such multi-cellular pixel resolution spatial transcriptomics (ST) datasets. Using simulated as well as real ST datasets from diverse spatial transcriptomics technologies comprising a variety of spatial resolutions such as Spatial Transcriptomics, 10X Visium, DBiT-seq, and Slide-seq, we show that STdeconvolve can effectively recover cell-type transcriptional profiles and their proportional representation within pixels without reliance on external single-cell transcriptomics references. STdeconvolve provides comparable performance to existing reference-based methods when suitable single-cell references are available, as well as potentially superior performance when suitable single-cell references are not available. STdeconvolve is available as an open-source R software package with the source code available at https://github.com/JEFworks-Lab/STdeconvolve .


Conflict of interest statement

The authors declare no competing interests.

Figures

Fig. 1
Fig. 1. Overview of STdeconvolve.
a STdeconvolve takes as input a spatial transcriptomics (ST) gene counts matrix of D pixels (rows) by N genes (columns). A matrix of spatial coordinates for each of the D pixels can also be used for visualization. b STdeconvolve first feature selects genes for deconvolution, such as genes with counts in more than 5% and less than 95% of the pixels, and overdispersed across the pixels. STdeconvolve then guides the selection of the optimal number of cell types to be deconvolved, K. STdeconvolve finally applies LDA modeling. A graph representation of LDA modeling and the parameters to be learned is shown. Shaded circle indicates observed variables and clear circles indicate latent variables. c STdeconvolve outputs two matrices: (1) β, the deconvolved transcriptional profile matrix of K cell types over N’ feature selected genes, and (2) θ, the proportions of K cell types across the D pixels. The proportions of deconvolved cell types can then be visualized across the pixels.
Fig. 2
Fig. 2. Deconvolution of simulated ST data.
a Ground truth single-cell resolution MERFISH data of one section of the MPOA partitioned into 100 µm2 pixels (black dashed squares). Each dot is a single cell colored by its ground truth cell type label. b Proportions of deconvolved cell types from STdeconvolve represented as pie charts for each simulated pixel. c The ranking of each gene based on its expression level in the deconvolved cell-type transcriptional profiles compared to its gene rank in the matched ground truth cell-type transcriptional profiles. d Heatmap of Pearson’s correlations between the deconvolved and ground truth cell type proportions across simulated pixels. Ground truth cell types are ordered by their frequencies in the ground truth dataset. Matched deconvolved and ground truth cell types are boxed. e Root-mean-square-error (RMSE) of the deconvolved cell-type proportions (n = 3072 pixels) compared to ground truth for STdeconvolve, f for supervised deconvolution approaches using the ideal single cell transcriptomics MERFISH MPOA reference, g for supervised deconvolution approaches using the single cell transcriptomics MERFISH MPOA reference with missing neurons, and h for supervised deconvolution approaches using a brain single-cell RNA-seq reference. Boxplots indicate median (middle line), 25th, 75th percentile (box) and 5th and 95th percentile (whiskers).
Fig. 3
Fig. 3. Comparing clustering versus deconvolution analysis for ST data.
a Overview of simulation approach. Starting from a single-cell RNA-seq clustering result visualized as a 2D t-SNE embedding with cells colored by cell type (top), gene expression counts from cells are combined to simulate cell-type mixtures, with the proportions of cell types are represented as pie charts for each arbitrary spatial pixel (bottom). b Simulated ST datasets of aged and young tissues using mixtures of aged macrophages with aged luminal cells and young macrophages with young luminal cells respectively represented as pie charts for each simulated ST pixel. c Bar chart of log2 fold-change for deconvolved aged macrophage versus deconvolved young macrophage gene expression. Select genes are highlighted in red. d Simulated ST dataset with 3 cell types represented as pie charts for each simulated ST pixel. e Clustering analysis results of simulated ST dataset with 3 cell types. Pie chart proportional representation (left) and t-SNE representation (right). f Deconvolution results for the simulated ST dataset with 3 cell types by STdeconvolve. The ranking of each gene based on its expression level in the deconvolved cell-type transcriptional profiles compared to its gene rank in the matched ground truth cell-type transcriptional profiles (top). Heatmap of Pearson’s correlations between the deconvolved cell types proportions and ground truth cell types proportions across simulated pixels (bottom). g BayesSpace enhanced resolution clustering results for the simulated ST dataset with 3 cell types represented as pie charts. h Root-mean-square-error (RMSE) of the deconvolved cell-type proportions (n = 900 pixels) compared to ground truth for the simulated ST dataset with three cell types. i Ground truth cell-type proportions derived from single-cell resolution MERFISH data of the mouse brain partitioned into 100 µm2 pixels. j Deconvolved cell-type proportions for the mouse brain by STdeconvolve. k Enhanced resolution clustering for the mouse brain by BayesSpace. Inset highlights an interior region corresponding approximately to the thalamus. l Root-mean-square-error (RMSE) of the deconvolved cell-type proportions (n = 716 pixels) compared to single-cell clustering for the MERFISH mouse brain data for the inset interior region corresponding approximately to the thalamus. Boxplots indicate median (middle line), 25th, 75th percentile (box) and 5th and 95th percentile (whiskers).
Fig. 4
Fig. 4. Deconvolution of ST data of varying resolution from multiple technologies by STdeconvolve.
a Deconvolved cell-type proportions for ST data of the MOB, represented as pie charts for each ST pixel. Pixels are outlined with colors based on the pixel transcriptional cluster assignment corresponding to MOB coarse cell layers. b Highlight of deconvolved cell-type X7. Pixel proportion of deconvolved cell-type X7 are indicated as black slices in pie charts. Pixels are outlined with colors as in (a). c Gene counts in each pixel of the MOB ST dataset for deconvolved cell-type X7’s select top marker genes Sox11 and Nrep. d Corresponding ISH images for Sox11 and Nrep from the Allen Brain Atlas. e Deconvolved cell-type proportions for Visium data of the mouse brain. f Deconvolved cell-type proportions for DBiT-seq data of the lower body of an E11 mouse embryo. g Deconvolved cell-type proportions for Slide-seq data of the mouse cerebellum.
Fig. 5
Fig. 5. STdeconvolve characterizes the spatial organization of immune cells in real and simulated breast cancer ST data.
a An H&E-stained image of the breast cancer tissue with pathological annotations adapted from Yoosuf et al.. b Deconvolved cell-type pixel proportions for ST data of a breast cancer tissue section, represented as pie charts. Pixels are outlined with colors based on the pixel transcriptional cluster assignment corresponding to 3 pathological annotations. c Highlight of deconvolved cell-type X15. Pixel proportion of deconvolved cell-type X15 are indicated as black slices in pie charts. Pixels are outlined with colors as in (b). Select genes corresponding cell-type X15’s select top marker genes are shown. d Barplot of the deconvolved transcriptional profile of cell-type X15 ordered by magnitude. Inset represents the log2 fold-change of the deconvolved transcriptional profile of cell-type X15 with respect to the mean expression of the other 14 deconvolved cell-type transcriptional profiles. Select highly expressed and high fold-change genes are labeled. e Gene set enrichment plot for significantly enriched GO term “T cell activation” for deconvolved cell-type X15. f Simulated ST datasets of an immune-excluded tumor sample (top) and immune-infiltrated tumor sample (bottom) using mixtures of single cells represented as pie charts for each simulated ST pixel. g Deconvolution results for the simulated ST data by STdeconvolve. The ranking of each gene based on its expression level in the deconvolved-cell-type transcriptional profiles compared to its gene rank in the matched ground truth cell-type transcriptional profiles for the simulated immune-excluded tumor sample (top) and immune-infiltrated tumor sample (bottom). h Histogram of the deconvolved proportion of immune cells in the tumor region defined in (f) for the simulated immune-excluded tumor sample (top) and immune-infiltrated tumor sample (bottom).

Similar articles

Cited by

References

    1. Zhuang X. Spatially resolved single-cell genomics and transcriptomics by imaging. Nat. Methods. 2021;18:18–22. doi: 10.1038/s41592-020-01037-8. - DOI - PMC - PubMed
    1. Larsson L, Frisen J, Lundeberg J. Spatially resolved transcriptomics adds a new dimension to genomics. Nat. Methods. 2021;18:15–18. doi: 10.1038/s41592-020-01038-7. - DOI - PubMed
    1. Elosua-Bayes M, Nieto P, Mereu E, Gut I, Heyn H. SPOTlight: seeded NMF regression to deconvolute spatial transcriptomics spots with single-cell transcriptomes. Nucleic Acids Res. 2021 doi: 10.1093/nar/gkab043. - DOI - PMC - PubMed
    1. Cable DM, et al. Robust decomposition of cell type mixtures in spatial transcriptomics. Nat. Biotechnol. 2021 doi: 10.1038/s41587-021-00830-w. - DOI - PMC - PubMed
    1. Dong R, Yuan GC. SpatialDWLS: accurate deconvolution of spatial transcriptomic data. Genome Biol. 2021;22:145. doi: 10.1186/s13059-021-02362-7. - DOI - PMC - PubMed

Publication types