. 2022 Apr 29;13(1):2342.
doi: 10.1038/s41467-022-30062-8.

Comprehensive profiling of 1015 patients' exomes reveals genomic-clinical associations in colorectal cancer

Affiliations

Comprehensive profiling of 1015 patients' exomes reveals genomic-clinical associations in colorectal cancer

Qi Zhao et al. Nat Commun. .

Abstract

The genetic basis of colorectal cancer (CRC) and its clinical associations remain poorly understood due to limited samples or targeted genes in current studies. Here, we perform ultradeep whole-exome sequencing on 1015 patients with CRC as part of the ChangKang Project. We identify 46 high-confident significantly mutated genes, 8 of which mutate in 14.9% of patients: LYST, DAPK1, CR2, KIF16B, NPIPB15, SYTL2, ZNF91, and KIAA0586. With an unsupervised clustering algorithm, we propose a subtyping strategy that classisfies CRC patients into four genomic subtypes with distinct clinical characteristics, including hypermutated, chromosome instability with high risk, chromosome instability with low risk, and genome stability. Analysis of immunogenicity uncover the association of immunogenicity reduction with genomic subtypes and poor prognosis in CRC. Moreover, we find that mitochondrial DNA copy number is an independent factor for predicting the survival outcome of CRCs. Overall, our results provide CRC-related molecular features for clinical practice and a valuable resource for translational research.


Conflict of interest statement

The authors declare no competing interests.

Figures
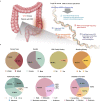
Fig. 1
Fig. 1. Schematic diagram of the ChangKang study.
a Sample collection workflow and core features of the sequencing platform; b Summarized characteristics of 1015 patients analyzed in this study.
Fig. 2
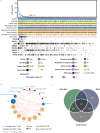
Fig. 2. Hypermutated phenotype of CRC and its associations with clinical features.
a Heatmap with multiple tracks presenting the different mutation profiles between the hypermutated and nonhypermutated groups. b Network plot presenting the correlation analysis of the clinical features and selected molecular events. The size of the node indicates the -log (P-value) calculated with the correlation test, while the circle in different colors represents the variable type (clinical or molecular event). c Overlap analysis of CRC with MSI-H, POLE mutations (nonsynonymous mutations), or the hypermutated phenotype (TMB > = 10).
Fig. 3
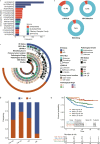
Fig. 3. Identification of HC-SMGs in CRC.
a Algorithms used to identify HC-SMGs; b Overlap analysis of the recurrent genes identified by each algorithm; c Significantly mutated genes identified in SYSUCC-CRC patients. Top: Bars represent the somatic mutation rate for CRC samples with different mutation types distinguished by color. Bottom left: Tools that were used to identify the significant genes. Bottom right: Mutation status of the significantly mutated genes in each CRC sample, identified by more than two tools, ranked by mutation frequency. d Lollipop plot show the distribution of identified hotspot in APC gene. The Venn diagram show the overlapped hotspot in APC between the current study and the TCGA cohort.
Fig. 4
Fig. 4. Alterations in oncogenic pathways in Chinese CRC patients.
a Variant status of oncogenic signaling pathways in Chinese CRC patients. Top: Gender, smoking status, cancer type, pathological stage, vessel invasion, nerve invasion, metastasis at diagnosis, primary tumor location, MSI status, and hypermutated status. Bottom right: Variant status of 10 oncogenic pathways among the CRC patients (oncogenic variants denoted by black, variants of unknown significance (VUS) denoted by gray, wild type (Wt) denoted by white). Bottom left: Variant frequency of each oncogenic pathway. Kaplan–Meier estimates of OS in the Chinese cohort comparing patients carrying oncogenic variants, variants of unknown significance, and no variant (wild type) in the cell cycle pathway (b) or the TGF-beta pathway (c). Core members and interactions in the cell cycle pathway (d) and TGF-beta pathway (e). Genes are altered at different frequencies by oncogenic activation and tumor suppressor inactivation. Oncoplot for core members in the cell cycle (f) and TGF-beta (g) pathways. Forrest plot showing multi-variable Cox regression analysis of the effect of alterations in the cell cycle pathway (h) or the TGF-beta pathway (i) on CRC patients after adjusting for TMB, pathological stage, and pathological grade.
Fig. 5
Fig. 5. SYSUCC-CRC subtypes from 1015 Chinese patients with colorectal cancer.
a Schematic diagram for the SYSUCC-CRC subtyping from genomic profile of CRCs. Tumor samples carrying hypermutation were first grouped as hypermutated (HM, black), and the remaining samples were grouped into three clusters using consensus NMF clustering: genomic stable (GS), chromosomal instability – low risk (CIN-LR), and chromosomal instability – high risk (CIN-HR) (see the main text, Methods and Supplementary Fig. 12). Four samples with no SCNV or mutational signature available were removed from the analysis. b Clinical features and molecular characteristics of the four subtypes. Top: Cancer type, gender, pathological stage, pathological grade, primary tumor location, metastasis at diagnosis, MSI status, POLE mutation status, mutational signature and subtype. Middle: The top 20 genes that were significantly differentially mutated in the nonhypermutated subtypes are ranked by the q value. Mutation color indicates the class of mutation. The percentage on the right side denotes the mutated frequency of each gene in each subtype. Bottom: The top 20 significant CNV lesions that were differentially altered in the nonhypermutated subtypes are ranked by the q value. Alteration color indicates the class of CNV. The percentage on the right side denotes the altered frequency of each lesion in each subtype. c Kaplan–Meier estimates of overall survival (OS) comparing the four CRC subtypes. d Distribution of pathological stage in the four subtypes. e Distribution of CMS subtypes across the four molecular subtypes in the TCGA-CRC cohort.
Fig. 6
Fig. 6. Immunogenicity reducing was associated with poor prognosis in CRC patients carrying low neo-antigen burden.
a Top 16 variant peptides with highest frequency in CRC patients from SYSUCC cohort. b Frequency of different ways for neo-antigen presentation deficiency in CRC patients (LOHHLA: loss of heterogeneity in human leukocyte antigen; NPG: neo-antigen presenting genes; IM-editing status: immunoediting status). c Heatmap depicting the relationship across the status of immunogenicity-reduced status, clinical features, and molecular cluster (IR: immunogenicity-reduced; nIR: non-immunogenicity-reduced). d The difference on the fraction of IR and nIR comparing different molecular subtypes. e Comparison on overall survival across CRC patients classified by neo-antigen burden and status of immunogenicity reduction.
Fig. 7
Fig. 7. Characteristics of the mitochondrial genome in Chinese CRC patients.
a Density distribution of the tumor mScore in all CRC samples, with the bottom 90% denoted by blue and the top 10% denoted by red. b Kaplan–Meier estimates of overall survival (OS) comparing CRC patients with a high tumor mScore (top 10%) and those with a low tumor mScore (bottom 90%). c Kaplan–Meier estimates of overall survival (OS) comparing CRC patients with a high tumor mScore and those with a low tumor mScore in qPCR-validating cohort. d Difference on the alterative frequency of TGF-beta pathway comparing patients with a high mScoreTumor and those with a low mScoreTumor. e Correlation between mutation signature and mScoreTumor (Non-Sig: non significantly; Sig-Neg: significantly negative correlation; Sig-Pos: significantly positive correlation).

References

    1. Sung H, et al. Global Cancer Statistics 2020: GLOBOCAN estimates of incidence and mortality worldwide for 36 cancers in 185 countries. CA Cancer J. Clin. 2021;71:209–249. doi: 10.3322/caac.21660. - DOI - PubMed
    1. Allison KH, Sledge GW. Heterogeneity and cancer. Oncology. 2014;28:772–778. - PubMed
    1. Kuipers EJ, et al. Colorectal cancer. Nat. Rev. Dis. Prim. 2015;1:15065. doi: 10.1038/nrdp.2015.65. - DOI - PMC - PubMed
    1. Keum N, Giovannucci E. Global burden of colorectal cancer: emerging trends, risk factors and prevention strategies. Nat. Rev. Gastroenterol. Hepatol. 2019;16:713–732. doi: 10.1038/s41575-019-0189-8. - DOI - PubMed
    1. Guinney J, et al. The consensus molecular subtypes of colorectal cancer. Nat. Med. 2015;21:1350–1356. doi: 10.1038/nm.3967. - DOI - PMC - PubMed

Publication types