. 2022 Apr 29;5(1):401.
doi: 10.1038/s42003-022-03353-5.

Incorporating local ancestry improves identification of ancestry-associated methylation signatures and meQTLs in African Americans

Affiliations

Incorporating local ancestry improves identification of ancestry-associated methylation signatures and meQTLs in African Americans

Boyang Li et al. Commun Biol. .

Abstract

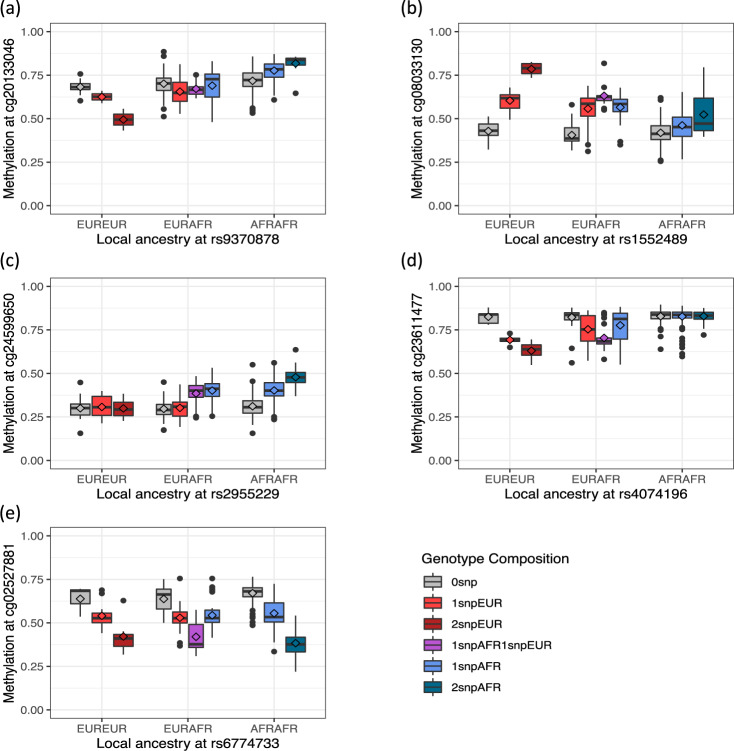
Here we report three epigenome-wide association studies (EWAS) of DNA methylation on self-reported race, global genetic ancestry, and local genetic ancestry in admixed Americans from three sets of samples, including internal and external replications (Ntotal = 1224). Our EWAS on local ancestry (LA) identified the largest number of ancestry-associated DNA methylation sites and also featured the highest replication rate. Furthermore, by incorporating ancestry origins of genetic variations, we identified 36 methylation quantitative trait loci (meQTL) clumps for LA-associated CpGs that cannot be captured by a model that assumes identical genetic effects across ancestry origins. Lead SNPs at 152 meQTL clumps had significantly different genetic effects in the context of an African or European ancestry background. Local ancestry information enables superior capture of ancestry-associated methylation signatures and identification of ancestry-specific genetic effects on DNA methylation. These findings highlight the importance of incorporating local ancestry for EWAS in admixed samples from multi-ancestry cohorts.


Conflict of interest statement

The authors declare no competing interests.

Figures

Fig. 1
Fig. 1. Global ancestry estimated using ADMIXTURE for African Americans and European Americans in the Veterans Aging Cohort Study (VACS) discovery group, VACS internal replication group, and the Women’s Interagency HIV Study (WIHS) external replication group.
Yoruba in Ibadan, Nigeria (YRI) and Utah Residents (CEPH) with Northern and Western European Ancestry (CEU) samples from the 1000 Genomes Project are used as the African and European reference panels.
Fig. 2
Fig. 2. Self-reported race, global ancestry, and local ancestry across 22 chromosomes for 3 self-reported African Americans in the Veterans Aging Cohort Study cohort.
Race was extracted from self-reported survey data. Global ancestry was estimated using ADMIXTURE. Local ancestry was estimated using RFMix. The horizontal axis represents genomic coordinates in centimorgans and the vertical axis represents 22 chromosomes, each has two strands, and the color indicates local ancestry designation inferred from RFMix. Yoruba in Ibadan, Nigeria (YRI) and Utah Residents (CEPH) with Northern and Western European Ancestry (CEU) samples from the 1000 Genomes Project are used as the African and European reference panels for global and local ancestry estimations.
Fig. 3
Fig. 3. Manhattan and QQ plots for epigenome-wide association study (EWAS) of ancestry variables in the Veterans Aging Cohort Study (VACS) discovery group.
The EWAS identified (a) 708 CpGs (genomic inflation λ = 1.18) significantly associated with self-reported race (N = 527), (b) 30 CpGs (genomic inflation λ = 1.02) significantly associated with global ancestry (N = 478), and (c) 1,284 CpGs (genomic inflation λ = 1.14) significantly associated with local ancestry (N = 478), respectively. Self-reported race was extracted from self-reported survey data. Global ancestry was estimated with ADMIXTURE. Local ancestry was estimated using RFMix. Yoruba in Ibadan, Nigeria (YRI) and Utah Residents (CEPH) with Northern and Western European Ancestry (CEU) samples from the 1000 Genomes Project are used as African and European reference panels for global and local ancestry estimations. The vertical axes across three panels are made on the same scale for comparison.
Fig. 4
Fig. 4. Downstream characterization of the local ancestry-associated DNA methylation.
a The enrichment or depletion of genomic annotations for the DNA methylation identified in the epigenome-wide association studies (EWAS) of local ancestry. Asterisks (*) indicate significant enrichments or depletions with FDR adjusted p-values less than 0.05. b The SNP-based heritability estimates of local ancestry associated DNA methylation (mean h2 = 0.45, median h2 = 0.43) are considerably higher than the overall heritability (mean h2 = 0.06, median h2 = 0.01) estimated from all methylation sites. The SNP-based heritability for each methylation site is estimated using all SNPs in a flanking region of 1 mega basepairs. The source data are provided in Table 2 and Supplementary Data 4.
Fig. 5
Fig. 5. An illustration of four representative patterns of genetic effects by ancestry for the meQTLs identified by the ancestral model.
In each panel, the set of boxplots show the distribution of methylation (beta-value) by genotype composition. The lozenge indicates mean of methylation beta-value. a The genetic effects on the methylations are opposite for the African and European ancestry. b The genetic effects from the two ancestries contribute to the methylation in the same direction but with different effect sizes. c The African alleles are associated with differential methylations while the European alleles are not. d The European alleles are associated with differential methylations while the African alleles are not. e The genetic effects are comparable between ancestries. The box denotes interquartile range (IQR, 25th to 75th percentile) where the central line in the box denotes the median value (50th percentile) and the lozenge denotes the mean value. The upper and lower whisker denotes the largest value within 1.5 times IQR above the 75th percentile and the smallest value within 1.5 times IQR below the 25th percentile, respectively. Values outside of the whisker range are denoted as dots. The source data are provided in Supplementary Data 9–13.

Comment in

References

    1. Adkins RM, Krushkal J, Tylavsky FA, Thomas F. Racial differences in gene-specific DNA methylation levels are present at birth. Birth Defects Res A Clin. Mol. Teratol. 2011;91:728–736. doi: 10.1002/bdra.20770. - DOI - PMC - PubMed
    1. Fraser HB, Lam LL, Neumann SM, Kobor MS. Population-specificity of human DNA methylation. Genome Biol. 2012;13:R8–R8. doi: 10.1186/gb-2012-13-2-r8. - DOI - PMC - PubMed
    1. Xia Y-Y, et al. Racial/ethnic disparities in human DNA methylation. Biochimica Biophysica Acta. 2014;1846:258–262. - PubMed
    1. Mehrotra J, et al. Estrogen receptor/progesterone receptor-negative breast cancers of young African-American women have a higher frequency of methylation of multiple genes than those of caucasian women<sup>1</sup&gt. Clin. Cancer Res. 2004;10:2052. doi: 10.1158/1078-0432.CCR-03-0514. - DOI - PubMed
    1. Toyooka S, et al. Smoke exposure, histologic type and geography-related differences in the methylation profiles of non-small cell lung cancer. Int. J. Cancer. 2003;103:153–160. doi: 10.1002/ijc.10787. - DOI - PubMed

Publication types