. 2022 Apr 29;14(1):45.
doi: 10.1186/s13073-022-01050-w.

Integrated analysis of single-cell and bulk RNA sequencing data reveals a pan-cancer stemness signature predicting immunotherapy response

Affiliations

Integrated analysis of single-cell and bulk RNA sequencing data reveals a pan-cancer stemness signature predicting immunotherapy response

Zhen Zhang et al. Genome Med. .

Abstract

Background: Although immune checkpoint inhibitor (ICI) is regarded as a breakthrough in cancer therapy, only a limited fraction of patients benefit from it. Cancer stemness can be the potential culprit in ICI resistance, but direct clinical evidence is lacking.

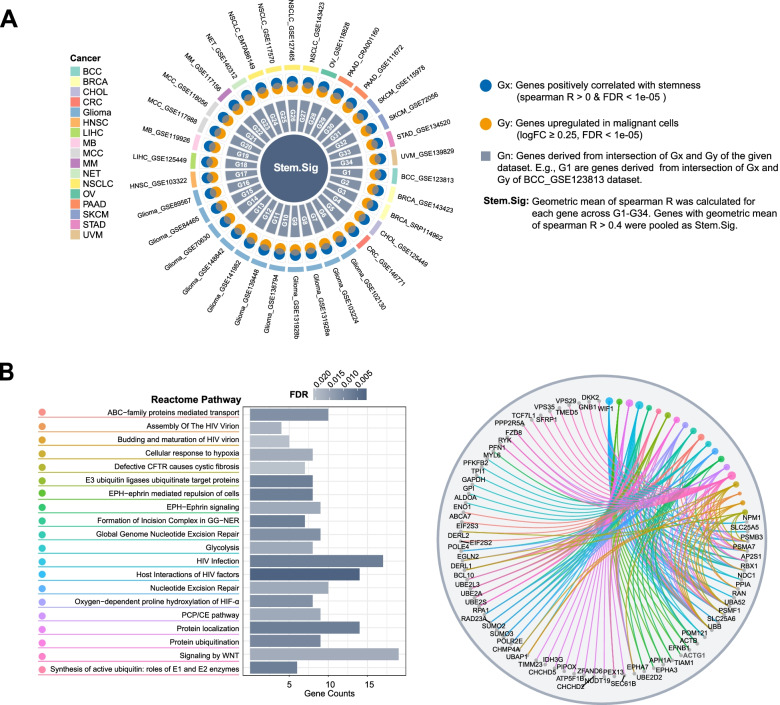
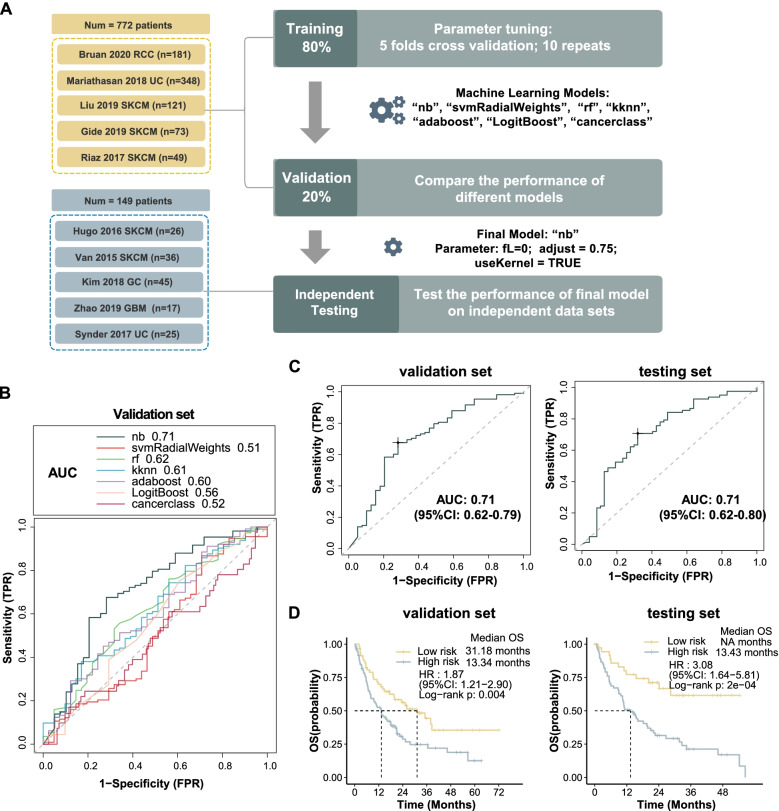
Methods: Publicly available scRNA-Seq datasets derived from ICI-treated patients were collected and analyzed to elucidate the association between cancer stemness and ICI response. A novel stemness signature (Stem.Sig) was developed and validated using large-scale pan-cancer data, including 34 scRNA-Seq datasets, The Cancer Genome Atlas (TCGA) pan-cancer cohort, and 10 ICI transcriptomic cohorts. The therapeutic value of Stem.Sig genes was further explored using 17 CRISPR datasets that screened potential immunotherapy targets.

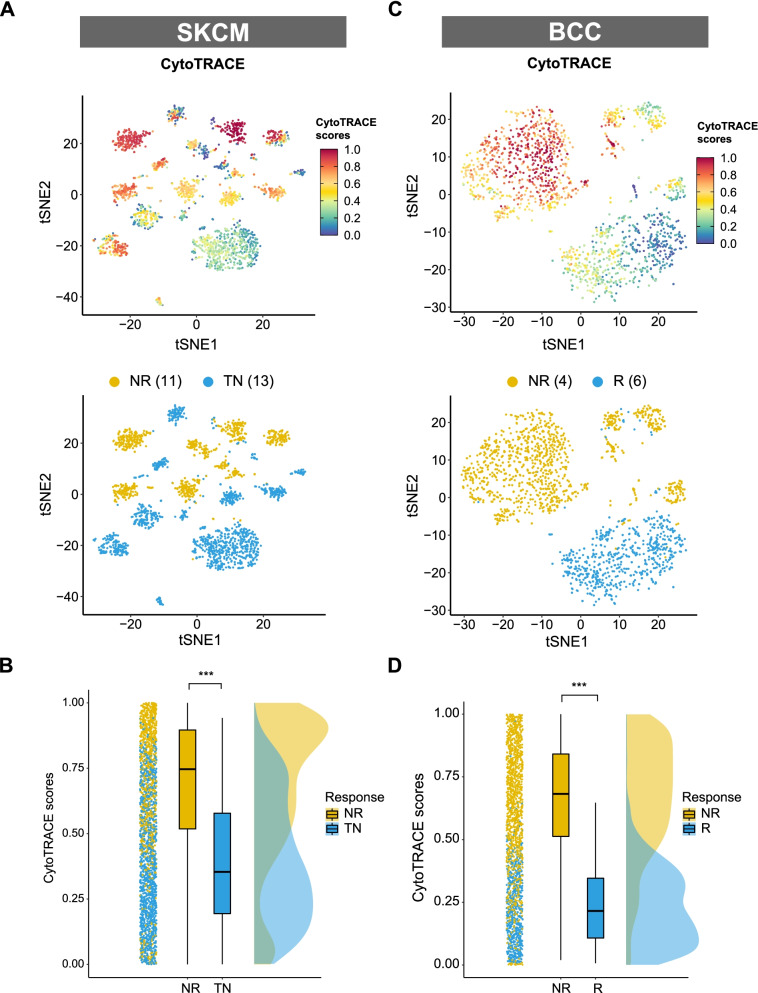
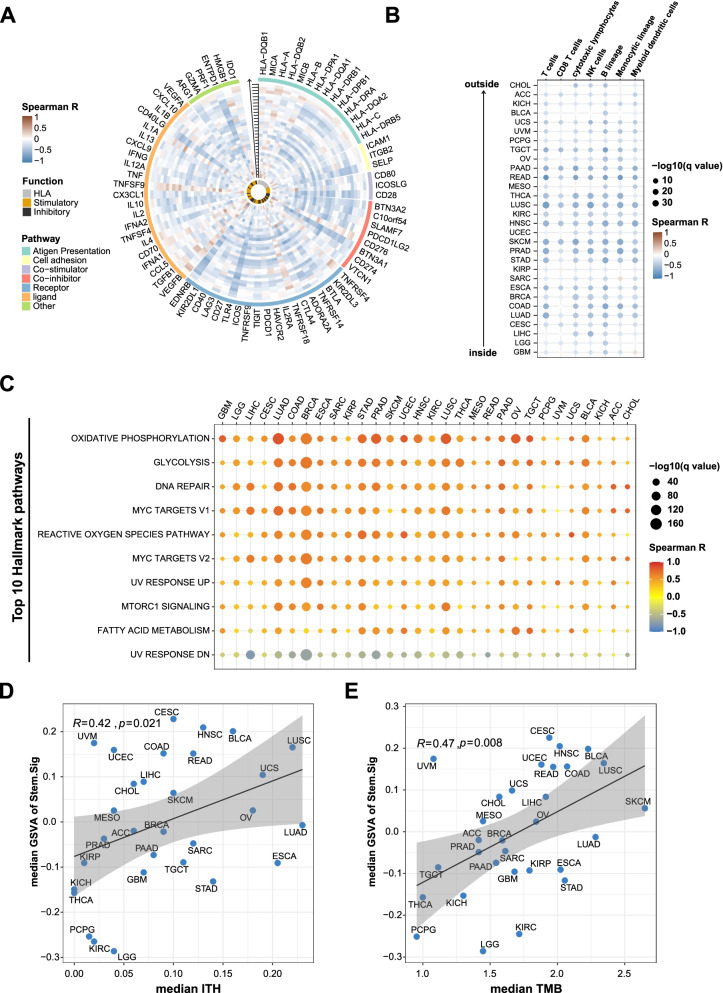
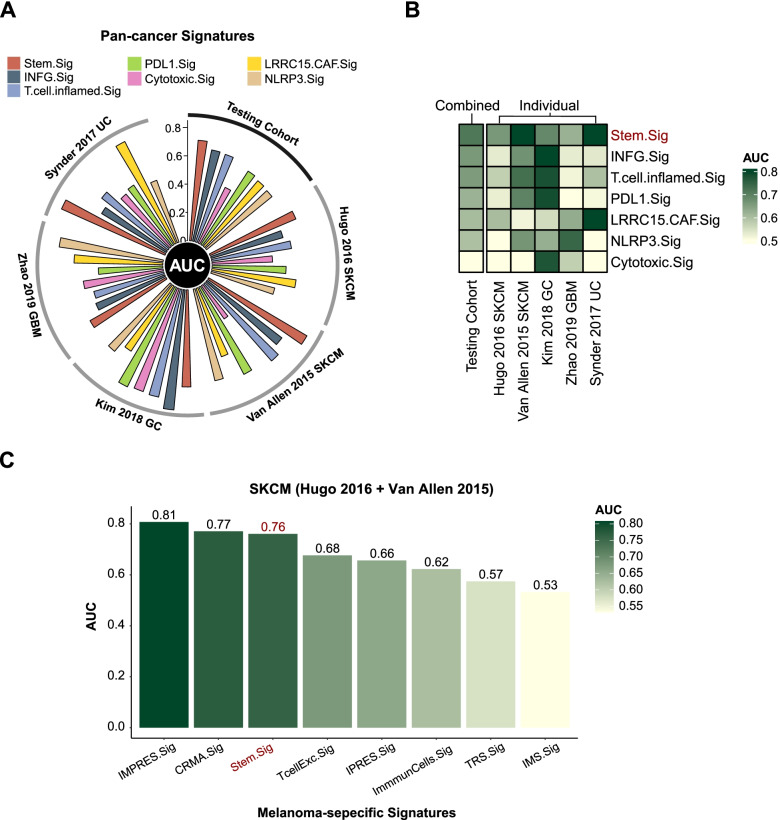
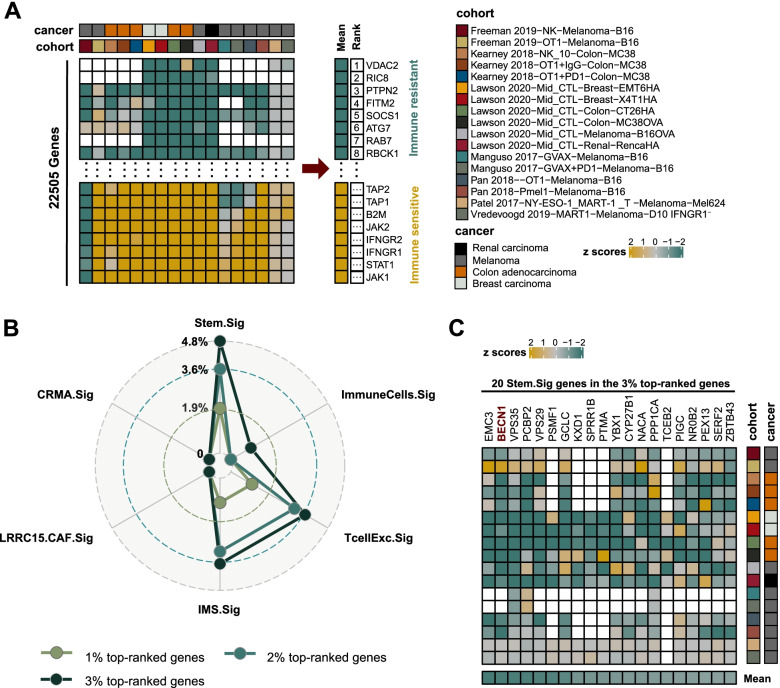
Results: Cancer stemness, as evaluated by CytoTRACE, was found to be significantly associated with ICI resistance in melanoma and basal cell carcinoma (both P < 0.001). Significantly negative association was found between Stem.Sig and anti-tumor immunity, while positive correlations were detected between Stem.Sig and intra-tumoral heterogenicity (ITH) / total mutational burden (TMB). Based on this signature, machine learning model predicted ICI response with an AUC of 0.71 in both validation and testing set. Remarkably, compared with previous well-established signatures, Stem.Sig achieved better predictive performance across multiple cancers. Moreover, we generated a gene list ranked by the average effect of each gene to enhance tumor immune response after genetic knockout across different CRISPR datasets. Then we matched Stem.Sig to this gene list and found Stem.Sig significantly enriched 3% top-ranked genes from the list (P = 0.03), including EMC3, BECN1, VPS35, PCBP2, VPS29, PSMF1, GCLC, KXD1, SPRR1B, PTMA, YBX1, CYP27B1, NACA, PPP1CA, TCEB2, PIGC, NR0B2, PEX13, SERF2, and ZBTB43, which were potential therapeutic targets.

Conclusions: We revealed a robust link between cancer stemness and immunotherapy resistance and developed a promising signature, Stem.Sig, which showed increased performance in comparison to other signatures regarding ICI response prediction. This signature could serve as a competitive tool for patient selection of immunotherapy. Meanwhile, our study potentially paves the way for overcoming immune resistance by targeting stemness-associated genes.

Keywords: Big data analysis; Immune checkpoint therapy; Pan-cancer; Single-cell sequencing; Stemness.


Conflict of interest statement

The authors declare that they have no competing interests.

Figures

Fig. 1
Fig. 1
Identification and validation of a negative association between cancer cell stemness and ICI outcomes. A, C t-Distributed Stochastic Neighbor Embedding (tSNE) plot of malignant cells from SKCM or BCC. Top tSNE plots depicting the distribution of CytoTRACE scores among malignant cells. Dark-green indicates lower scores (low stemness) while dark-red indicates higher scores (high stemness). Bottom tSNE plots label the malignant cells by response phenotype. B, D raincloud plot of CytoTRACE scores by response phenotype (NR vs. TN) in SKCM cohort or by response phenotype (NR vs. R) in BCC cohort. The center of the box plot are median values, the bounds of the box are 25% and 75% quantiles (Wilcoxon test; *** P < 0.001). Abbreviation: NR, non-responders; R, responders; TN, treatment naïve patients.
Fig. 2
Fig. 2
Development and description of stemness signature. A Circos plot depicting the development of Stem.Sig. B Pathway enrichment analysis of genes in Stem.Sig. The bar plot showed the top 20 enriched Reactome pathways. The cnetplot presented the network of specific genes from these pathways. Colored points referred to the corresponding pathways. Abbreviation: CFTR, cystic fibrosis transmembrane conductance regulator; GG-NER, global genomic nucleotide excision repair; HIF, hypoxia-inducible factor; PCP, planar cell polarity; CE, convergent extension
Fig. 3
Fig. 3
Analysis of the potential links between Stem.Sig and immune resistance using pan-cancer TCGA cohort. A Circos plot depicting the correlation between Stem.Sig and the expression level of immune-related genes across multiple cancer types. From inside to outside of the circos plot, the vertical axis with a black arrow indicated different cancer types, which were annotated by the y axis of plot B. B Heatmap depicting the correlation between Stem.Sig and the infiltration of immune cells across multiple cancer types. C Heatmap depicting the correlation between Stem.Sig and the Top 10 Hallmark pathways. D Correlation of median Stem.Sig and median TMB of each cancer type. E Correlation of median Stem.Sig and median ITH of each cancer type. GSVA scores were calculated to estimate the expression level of Stem.Sig for each sample
Fig. 4
Fig. 4
Prediction of ICI outcomes using Stem.Sig. A Flow chart of training, validating, and testing the Stem.Sig model constructed using machine learning process. In the training set, we applied 10-time repeated 5-fold cross-validation for parameters tuning of different machine learning algorithms. In the validation set, Naïve Bayes algorithm with best AUC was kept as the final Stem.Sig model. (parameter: fL=0; adjust = 0.75; useKernel = TRUE). B Comparison of multiple ROC plot depicting the performance of different machine learning algorithms in the validation set. C ROC plot depicting the performance of the final Stem.Sig model in validation and testing cohort. D Kaplan-Meier curves comparing OS between High-risk and Low-risk patients in validation and testing set. “NR” and “R” predicted by the final Stem.Sig Model was defined as “High-risk” and “Low-risk” patients respectively. HR were calculated by Cox proportional hazards regression analysis. Abbreviation: TPR, true positive rate; FPR, false positive rate; AUC, area under the curve; HR, hazard ratio; CI, confidence intervals
Fig. 5
Fig. 5
Comparing AUC of Stem.Sig with other predictive gene signatures. A Circos plot depicting the performance of pan-cancer signatures in the testing set. The vertical axis indicated AUC values. Testing set comprises five different cohorts, including Hugo 2020 SKCM, Van Allen 2015 SKCM, Kim 2018 GC, Zhao 2019 GBM, Synder 2017 UC. B Heatmap comparing the predictive value of Stem.Sig and other pan-cancer signatures. Different signature rows were ordered by their AUC in the testing set. From top to bottom, Stem.Sig ranked first while Cytotoxic.Sig ranked last. C Bar plot depicting the AUC values of Stem.Sig and other melanoma-specific signatures in the SKCM cohort (Hugo 2016 + Van Allen 2015).
Fig. 6
Fig. 6
Exploration of potential treatment targets from Stem.Sig using CRISPR screening data. A Ranking of genes based on their knockout effects on anti-tumor immunity across 17 CRISPR datasets. Negative (positive) z scores indicated better (worse) immune response after knockout of a specific gene. Genes were ranked according to their mean z scores. Top-ranking genes were associated with immune resistance. Blank squares in the heatmap referred to missing values of gene data from the corresponding cohort. B Radar plot comparing the percentage of top-ranked genes for Stem.Sig and other predictive signatures. C Heatmap depicting z scores of 20 Stem.Sig genes in the 3% top-ranked genes across different CRISPR datasets

References

    1. Wang Y, Wang M, Wu H, Xu R. Advancing to the era of cancer immunotherapy. Cancer Commun. 2021:cac2.12178. 10.1002/cac2.12178. - PMC - PubMed
    1. Sharma P, Siddiqui BA, Anandhan S, Yadav SS, Subudhi SK, Gao J, et al. The Next Decade of Immune Checkpoint Therapy. Cancer Discov. 2021;11:838–857. doi: 10.1158/2159-8290.CD-20-1680. - DOI - PubMed
    1. Davoli T, Uno H, Wooten EC, Elledge SJ. Tumor aneuploidy correlates with markers of immune evasion and with reduced response to immunotherapy. Science. 2017;355:eaaf8399. doi: 10.1126/science.aaf8399. - DOI - PMC - PubMed
    1. Hakimi AA, Voss MH, Kuo F, Sanchez A, Liu M, Nixon BG, et al. Transcriptomic Profiling of the Tumor Microenvironment Reveals Distinct Subgroups of Clear Cell Renal Cell Cancer: Data from a Randomized Phase III Trial. Cancer Discov. 2019;9:510–525. doi: 10.1158/2159-8290.CD-18-0957. - DOI - PMC - PubMed
    1. Ott PA, Bang Y-J, Piha-Paul SA, Razak ARA, Bennouna J, Soria J-C, et al. T-Cell–Inflamed Gene-Expression Profile, Programmed Death Ligand 1 Expression, and Tumor Mutational Burden Predict Efficacy in Patients Treated With Pembrolizumab Across 20 Cancers: KEYNOTE-028. J Clin Oncol. 2019;37:318–327. doi: 10.1200/JCO.2018.78.2276. - DOI - PubMed

Publication types