. 2022 Apr 29;14(1):58.
doi: 10.1186/s13148-022-01277-9.

Batch-effect detection, correction and characterisation in Illumina HumanMethylation450 and MethylationEPIC BeadChip array data

Affiliations

Batch-effect detection, correction and characterisation in Illumina HumanMethylation450 and MethylationEPIC BeadChip array data

Jason P Ross et al. Clin Epigenetics. .

Abstract

Background: Genomic technologies can be subject to significant batch-effects which are known to reduce experimental power and to potentially create false positive results. The Illumina Infinium Methylation BeadChip is a popular technology choice for epigenome-wide association studies (EWAS), but presently, little is known about the nature of batch-effects on these designs. Given the subtlety of biological phenotypes in many EWAS, control for batch-effects should be a consideration.

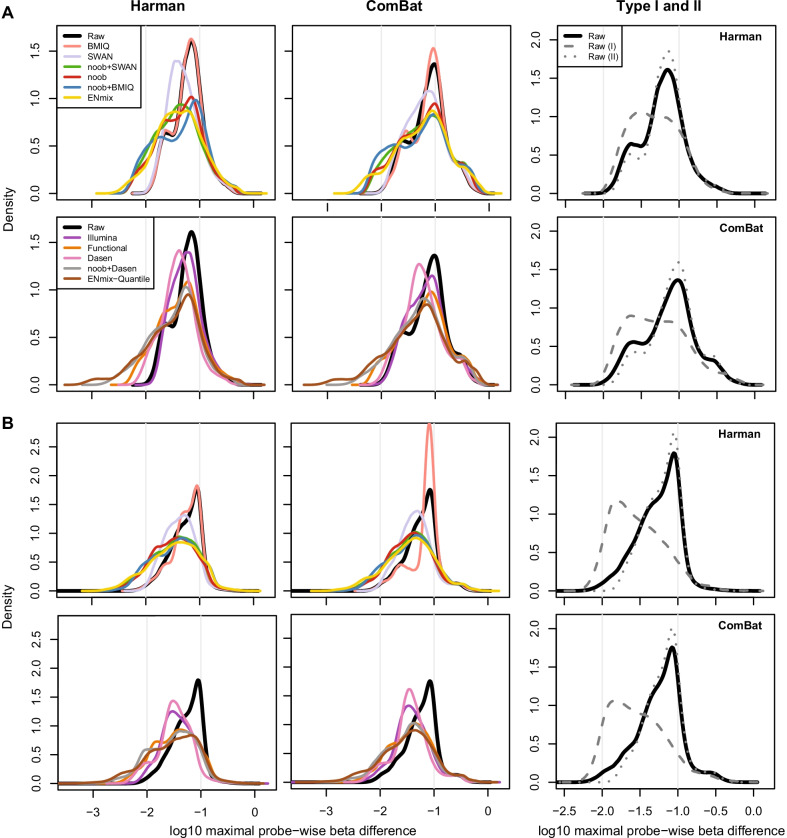
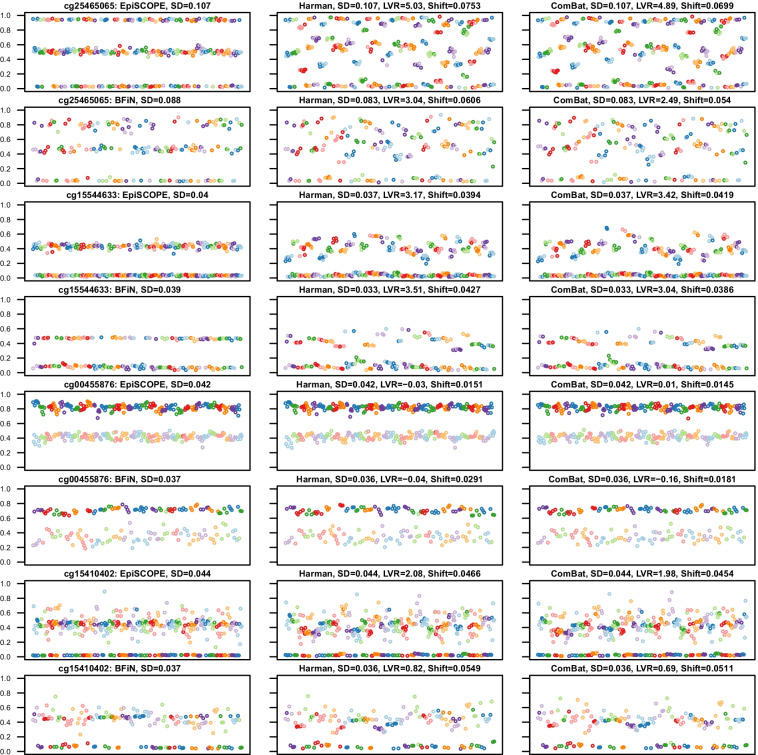
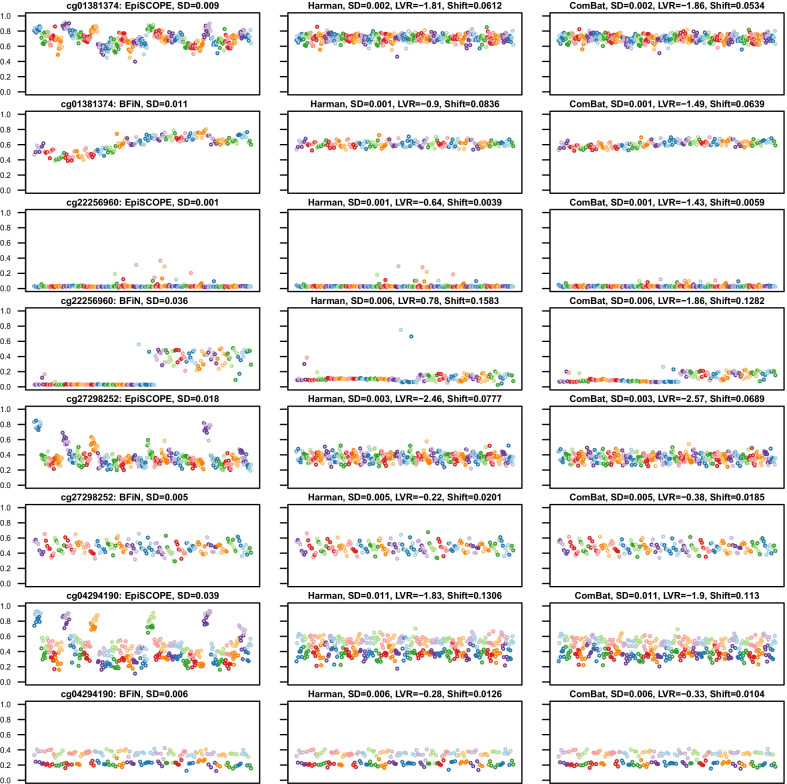
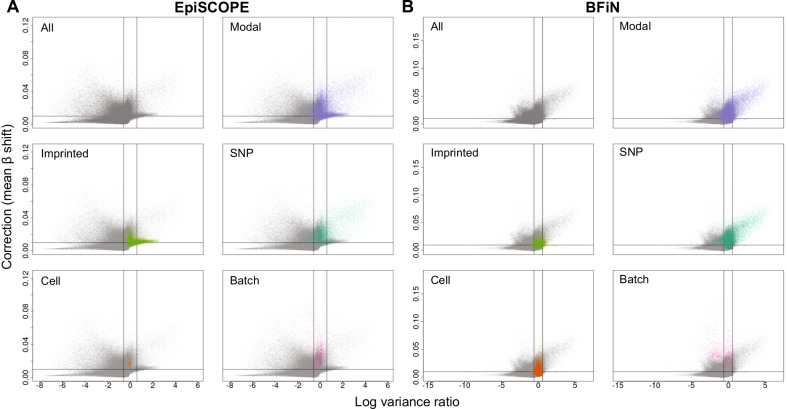
Results: Using the batch-effect removal approaches in the ComBat and Harman software, we examined two in-house datasets and compared results with three large publicly available datasets, (1214 HumanMethylation450 and 1094 MethylationEPIC BeadChips in total), and find that despite various forms of preprocessing, some batch-effects persist. This residual batch-effect is associated with the day of processing, the individual glass slide and the position of the array on the slide. Consistently across all datasets, 4649 probes required high amounts of correction. To understand the impact of this set to EWAS studies, we explored the literature and found three instances where persistently batch-effect prone probes have been reported in abstracts as key sites of differential methylation. As well as batch-effect susceptible probes, we also discover a set of probes which are erroneously corrected. We provide batch-effect workflows for Infinium Methylation data and provide reference matrices of batch-effect prone and erroneously corrected features across the five datasets spanning regionally diverse populations and three commonly collected biosamples (blood, buccal and saliva).

Conclusions: Batch-effects are ever present, even in high-quality data, and a strategy to deal with them should be part of experimental design, particularly for EWAS. Batch-effect removal tools are useful to reduce technical variance in Infinium Methylation data, but they need to be applied with care and make use of post hoc diagnostic measures.

Keywords: Batch-effect; Clustering; ComBat; EWAS; False positives; Harman; Infinium; Methylation; SNP.


Conflict of interest statement

The authors declare that they have no competing interests.

Figures

Fig. 1
Fig. 1
Infinium Methylation Assay scheme. a Infinium I assay. Two bead types correspond to each CpG locus: one bead type—to methylated (C), another bead type—to unmethylated (T) state of the CpG site. Probe design assumes same methylation status for adjacent CpG sites. Both bead types for the same CpG locus will incorporate the same type of labelled nucleotide, determined by the base preceding the interrogated ‘C’ in the CpG locus, and therefore will be detected in the same colour channel. b Infinium II assay. One bead type corresponds to each CpG locus. Probe can contain up to 3 underlying CpG sites, with degenerate R base corresponding to C in the CpG position. Methylation state is detected by single-base extension. Each locus will be detected in two colours. In the current version of the Infinium II methylation assay design, labelled ‘A’ is always incorporated at unmethylated query site (‘T’), and ‘G’ is incorporated at methylated query site (‘C’). Reproduced with permission from Bibikova et al. [8]
Fig. 2
Fig. 2
Selected Infinium control probes. Across the EpiSCOPE study data, outlier slides were observed for the staining (a), target removal (b), and c extension control probes. For the BFiN study data, the Type I (d) and Type II (e) bisulphite conversion control probes showed evidence of reduced bisulphite conversion efficiency for slides 13–22
Fig. 3
Fig. 3
Correlation of processing run with signal intensity and positively detected probes. Green and red channel intensities and positively detected probes grouped by slide and processing order are presented for the EpiSCOPE and BFiN studies. The EpiSCOPE study was composed of 31 slides processed in six processing runs (superbatches A–F). The BFiN study was composed of 22 slides processed in two processing runs (superbatches A–B). Slides highlighted in gold illustrate the variation observed across superbatches. The first slide of the day for the EpiSCOPE study (slides 1, 5, 9, 13, 17, 25) and superbatch B for the BFiN study (slides 13–22)
Fig. 4
Fig. 4
EpiSCOPE fluorescence intensity slide positional effect is reduced with preprocessing methods. Infinium green (Cy3 dye) and red (Cy5 dye) fluorescent intensities are formulated into methylated (meth) and unmethylated (unmeth) signals. These meth and unmeth signals are used to calculate β and M values. If the 369 BeadChips in the EpiSCOPE set are grouped by row (R) and column (C) position on the glass slide, there is evidence that the distribution of fluorescent intensities is associated with this position. The position effect diminishes with preprocessing methods. For some between-array methods no variation in mean is observed, as all the BeadChips have had mean fluorescent intensities moderated to be the same
Fig. 5
Fig. 5
Principal component analysis of the EpiSCOPE and BFiN data. PCA was conducted on the original raw preprocessed M values and again after correction via Harman or ComBat. The data are presented with the number and colour signifying BeadChip slide identifier and the bold and pastel shading signifying male and female gender, respectively. PCA was also conducted on noob preprocessed data and coloured by slides of note across processing runs (those slides highlighted in gold in Fig. 3), or estimated cellular fraction. For the EpiSCOPE data (a), dimensions 1 and 2 of the PCA plots show the data to separate by slide. This was particularly evident in slides 1 and 25 and less so for slides 9 and 17. Arrays from slide 5 separated out discretely on dimension 4. The PCA plots of Harman or ComBat corrected data show the absence of data separation by slide; instead the corrected data show a strong separation by gender in principal dimensions 3 and 4, despite the data being limited to autosomal probes only. Separation of the data by DHA supplementation (experimental treatment) was not apparent in the principal components examined. b Consistent with the control probe findings, the 450K slides with high technical variation (slides 1, 5, 9, 17, 25) are the first arrays processed in each processing run. c Some separation of the data on the fourth dimension by the estimated proportion of neutrophils in the blood sample was observed. In the BFiN data PCA analysis (d), there was not obvious separation of the raw preprocessed data by slide identifier on dimensions 1 and 2. However, slide 3 clearly separated out on dimension 4. Batch correction via Harman or ComBat was sufficient to remove the separation of slide 3. The PCA plots of noob preprocessed data illustrate the two largest factors influencing the autosomal probes; e the eigenvalues for dimension 2 showed two clouds of samples—one for slides 1–12 and the other, slides 13–22 and f cellular composition—with saliva samples containing a higher immune cell component separating out on dimension 1. Within each of these two clouds there was further structure, with samples from some slides clustering together. For the BFiN data, the technical (batch) variation is largely due to processing run (superbatch) and less so, the individual slides
Fig. 6
Fig. 6
A global analysis of batch-effect corrections made after various preprocessing. Across each probe in the EpiSCOPE (a) and BFiN study (b), the maximal probe-wise beta difference after batch-effect correction was determined and a density plot constructed. The area under the curve illustrates the maximal level of adjustment across the probe distribution. The two vertical lines highlight probes with 10% and 1% maximal probe-wise beta difference (− 1 and − 2, respectively, in log scale). This is consistent with the segmentation used in Table 1. The rightmost column illustrates that if raw preprocessed data are subset into Type I (grey dashes) and Type II (grey dots) probes, many of the Type I probes had less batch-effect correction adjustment
Fig. 7
Fig. 7
Biologically meaningful methylation clustering. Some probes with biologically meaningful methylation were erroneously corrected. Four example probes are illustrated. Each scatter plot compares methylation across slides (X axis) with the methylation β value (Y-axis). The datapoints are from each of the 369 Beadchip arrays, with the data sorted and coloured by slide number. The panel is ordered column-wise from left to right as original, Harman-corrected and ComBat-corrected data. It was observed that the standard deviation (SD) of the data remained the same or less; however, the log-variance ratio (LVR) was elevated considerably above 0. The mean β shift (Shift) is the mean change in β across all the 369 arrays induced by erroneous batch correction. The mapping of common SNPs falling within CpG sites can be used to identify CpG sites which should not be batch corrected. An example of this the probe cg25465065, which has the common C/T SNP rs3768276 positioned at the cytosine and as expected, the frequencies in each cluster are consistent with expectations of the Hardy–Weinberg equilibrium. However, the methylation as measured by probe cg15544633 on chromosome 2 is clustered to two groups: intermediate methylation and no methylation. This clustering is not in Hardy Weinberg equilibrium (p = 9.520 × 10−9), yet the clustering is likely influenced by genetics as the common SNP rs2516834 is immediately adjacent to the assayed CpG site. In the example with the Y chromosomal probe cg00455876, there is clearly a higher methylation state in males and this is clustering is still apparent after batch correction as gender was declared as biological variance to preserve. However, more complex gender associations may arise, in which batch-effect correction performs poorly. One of the alleles for the X chromosomal cg15410402 probe is inactivated in females, but the methylation state in males is complex, with almost half of the males having intermediate methylation and half no methylation. This may well be due to an interaction between gender and genetics, likely due to the influence of the commonly deleted sequence 5’-GGAGCTAGGCCG (rs66532084) 12 bp upstream from the measured CpG site
Fig. 8
Fig. 8
Examples of probes exhibiting obvious batch-effect. In some instances, probes had clear batch-effects which were corrected by application of Harman or ComBat. The panel layout is consistent with that in Fig. 7, with four examples of batch-effect prone probes illustrated. After batch correction, the SD was typically reduced and the computed LVR was considerably less than 0. Typically, as is the case with cg01381374, the particular influence of these probes on the data was idiosyncratic to the dataset. In other instances, there was high technical variance in one dataset but not the other. In the case of cg22256960, the batch-effect is limited to the EPIC superbatch 2 data. The example of cg27298252 highlights that batch-effect can be found both across arrays and by the position in the array. In particular, the EPIC data illustrate clear positional bias. The cg04294190 probe demonstrates that both technical and biological factors can contribute to methylation clustering. In this case, the data are clustered both by gender and within the 450K data, by slide number
Fig. 9
Fig. 9
Isolating erroneously corrected and batch-effect susceptible probes via Log-variance ratio and mean β shift. For all probes in the a EpiSCOPE and b BFiN datasets, the change in variance after batch correction (expressed as log-variance ratio) relative to the degree of batch correction (expressed as mean β shift) was plotted. The same data were then highlighted for clustered probes which were modal in distribution. These modal probes were in turn subdivided into probes which were modal and associated with imprinting, a single nucleotide polymorphism at the measured CpG site, cellular component and batch-effect. The vertical lines are plotted at LVR of 0.584 and − 0.584 and the horizontal line at a mean β shift of 0.01
Fig. 10
Fig. 10
The influence of probe melting temperatures on batch-effect. For each of the five studies and two probe types (I and II), the relationship between probe oligonucleotide melting temperature (Tm) and batch correction (mean β shift) was examined. A subset of Type II probes in the EpiSCOPE and NOVI study data were observed to require more batch correction when the probe Tm is low

References

    1. Leek JT, Scharpf RB, Bravo HC, Simcha D, Langmead B, Johnson WE, Geman D, Baggerly K, Irizarry RA. Tackling the widespread and critical impact of batch effects in high-throughput data. Nat Rev Genet. 2010;11:733–739. doi: 10.1038/nrg2825. - DOI - PMC - PubMed
    1. Luo J, Schumacher M, Scherer A, Sanoudou D, Megherbi D, Davison T, Shi T, Tong W, Shi L, Hong H, et al. A comparison of batch effect removal methods for enhancement of prediction performance using MAQC-II microarray gene expression data. Pharmacogenomics J. 2010;10:278–291. doi: 10.1038/tpj.2010.57. - DOI - PMC - PubMed
    1. von der Haar M, Preuss JA, von der Haar K, Lindner P, Scheper T, Stahl F. The impact of photobleaching on microarray analysis. Biology (Basel) 2015;4:556–572. - PMC - PubMed
    1. Fare TL, Coffey EM, Dai H, He YD, Kessler DA, Kilian KA, Koch JE, LeProust E, Marton MJ, Meyer MR, et al. Effects of atmospheric ozone on microarray data quality. Anal Chem. 2003;75:4672–4675. doi: 10.1021/ac034241b. - DOI - PubMed
    1. Branham WS, Melvin CD, Han T, Desai VG, Moland CL, Scully AT, Fuscoe JC. Elimination of laboratory ozone leads to a dramatic improvement in the reproducibility of microarray gene expression measurements. BMC Biotechnol. 2007;7:8. doi: 10.1186/1472-6750-7-8. - DOI - PMC - PubMed

Publication types