Controlled Clinical Trial
. 2022 Apr 29;26(1):118.
doi: 10.1186/s13054-022-03937-x.

Early prolonged prone position in noninvasively ventilated patients with SARS-CoV-2-related moderate-to-severe hypoxemic respiratory failure: clinical outcomes and mechanisms for treatment response in the PRO-NIV study

Affiliations
Controlled Clinical Trial

Early prolonged prone position in noninvasively ventilated patients with SARS-CoV-2-related moderate-to-severe hypoxemic respiratory failure: clinical outcomes and mechanisms for treatment response in the PRO-NIV study

Giovanni Musso et al. Crit Care. .

Abstract

Background: Whether prone position (PP) improves clinical outcomes in COVID-19 pneumonia treated with noninvasive ventilation (NIV) is unknown. We evaluated the effect of early PP on 28-day NIV failure, intubation and death in noninvasively ventilated patients with moderate-to-severe acute hypoxemic respiratory failure due to COVID-19 pneumonia and explored physiological mechanisms underlying treatment response.

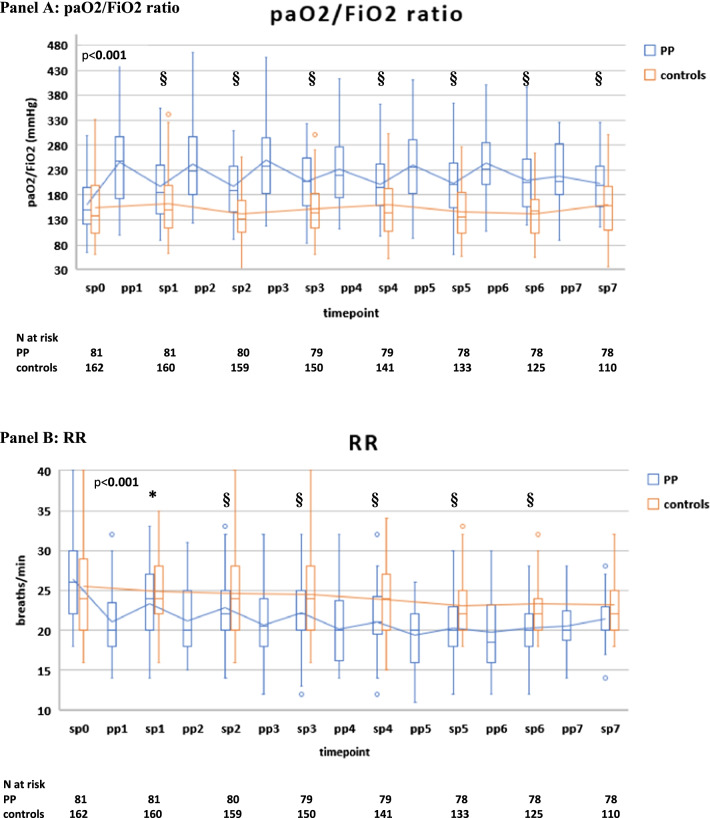
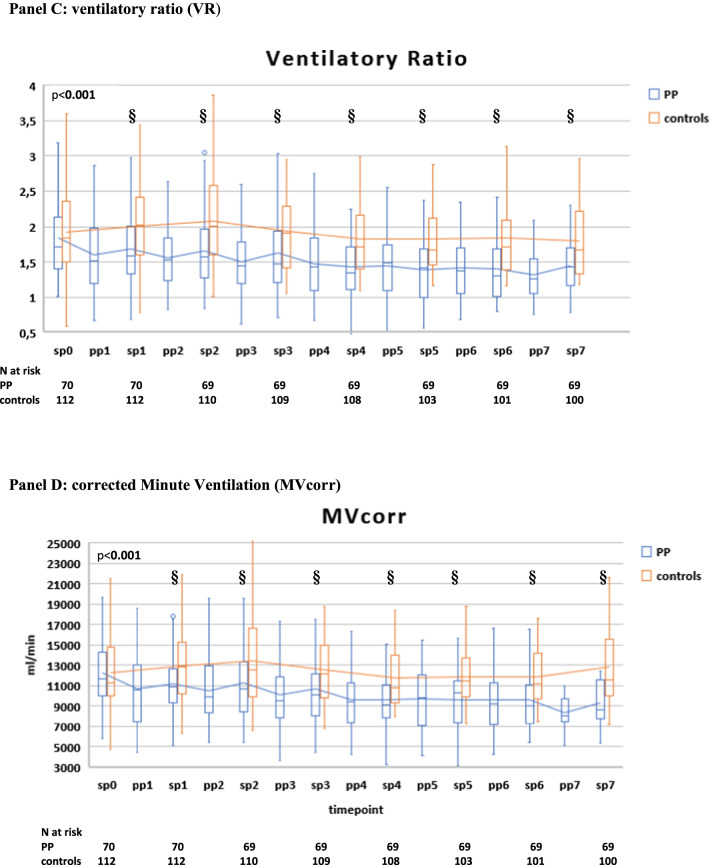
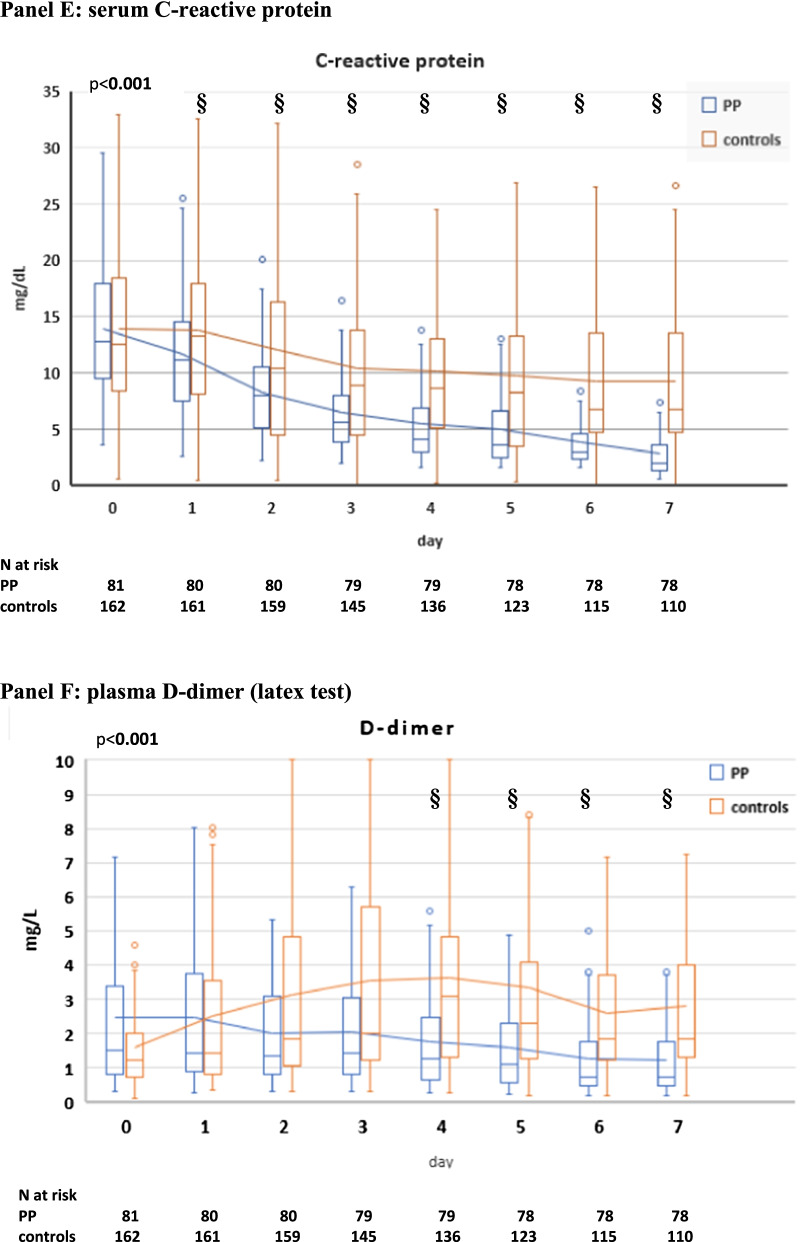
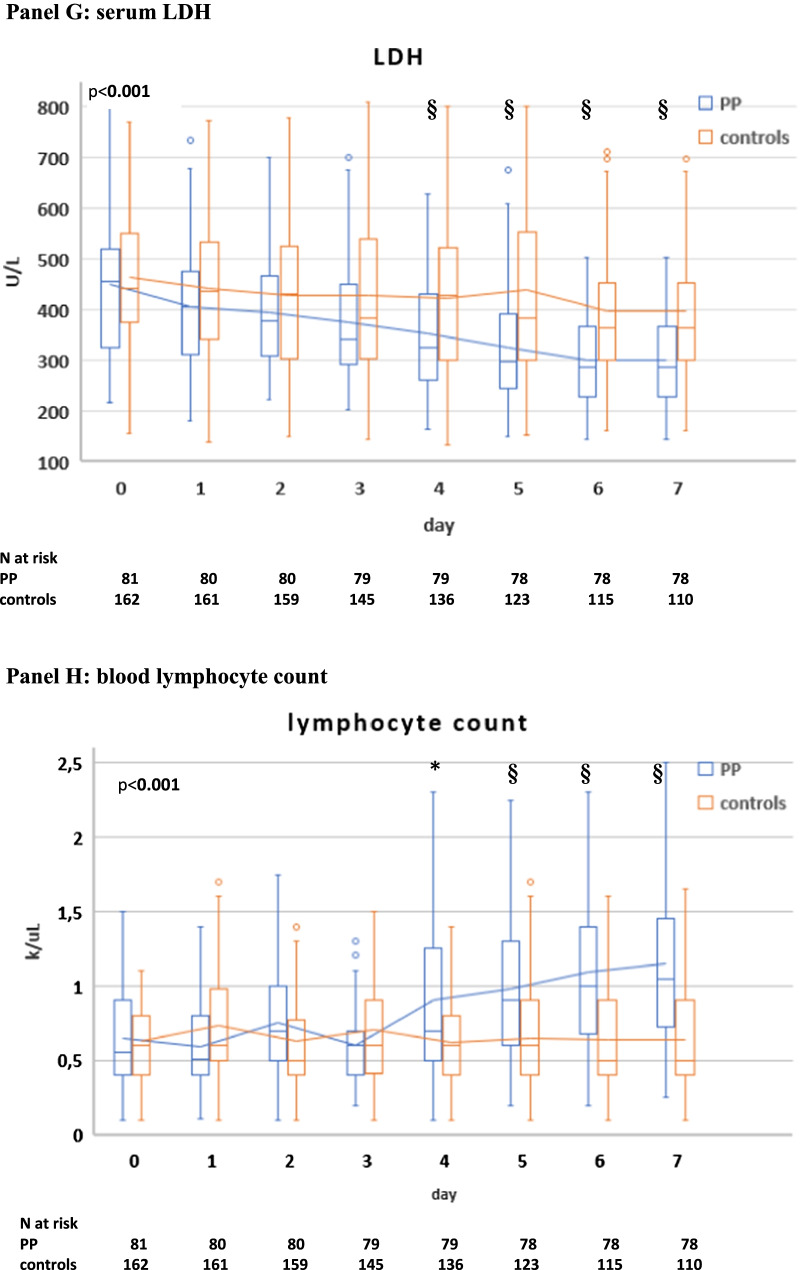
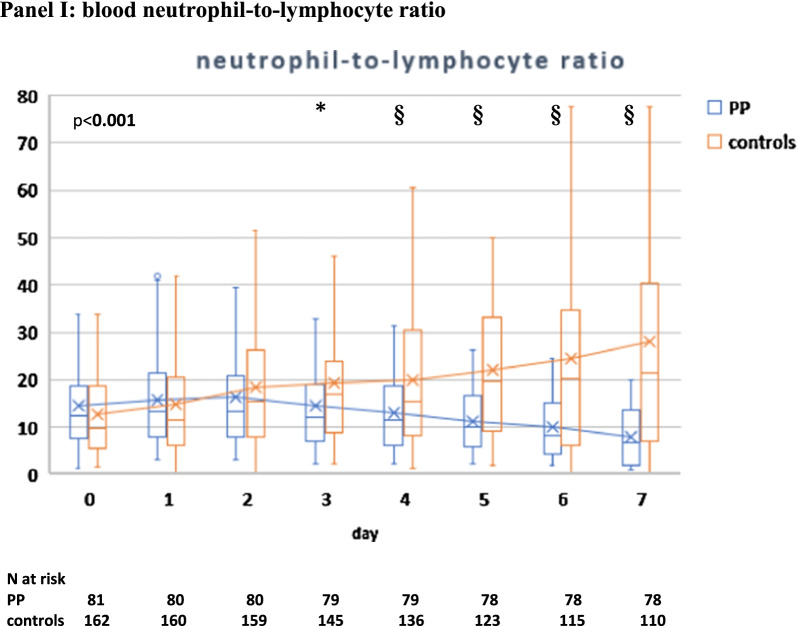
Methods: In this controlled non-randomized trial, 81 consecutive prospectively enrolled patients with COVID-19 pneumonia and moderate-to-severe (paO2/FiO2 ratio < 200) acute hypoxemic respiratory failure treated with early PP + NIV during Dec 2020-May 2021were compared with 162 consecutive patients with COVID-19 pneumonia matched for age, mortality risk, severity of illness and paO2/FiO2 ratio at admission, treated with conventional (supine) NIV during Apr 2020-Dec 2020 at HUMANITAS Gradenigo Subintensive Care Unit, after propensity score adjustment for multiple baseline and treatment-related variables to limit confounding. Lung ultrasonography (LUS) was performed at baseline and at day 5. Ventilatory parameters, physiological dead space indices (DSIs) and circulating inflammatory and procoagulative biomarkers were monitored during the initial 7 days.

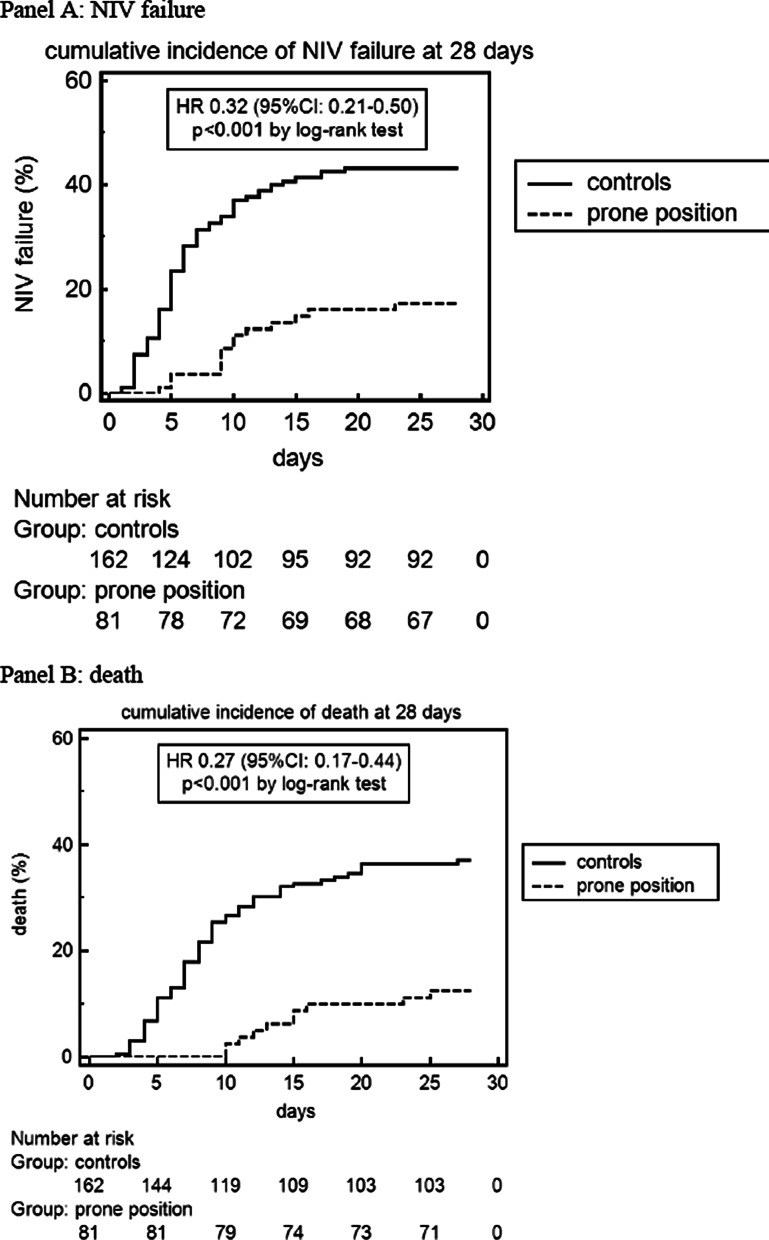
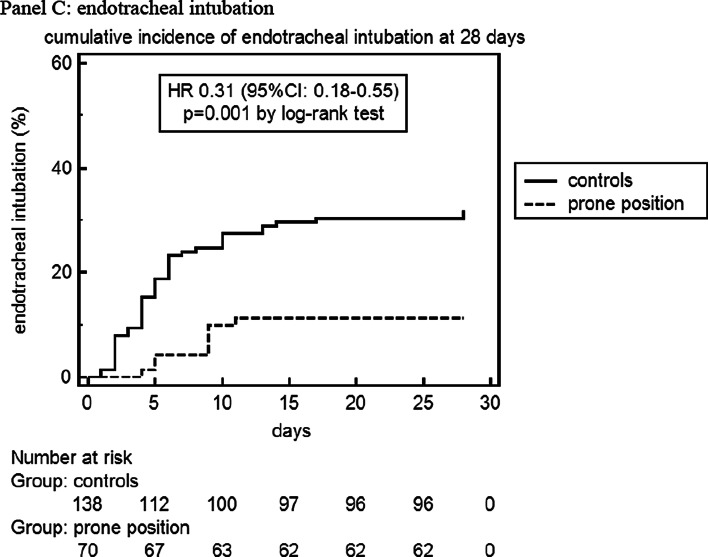
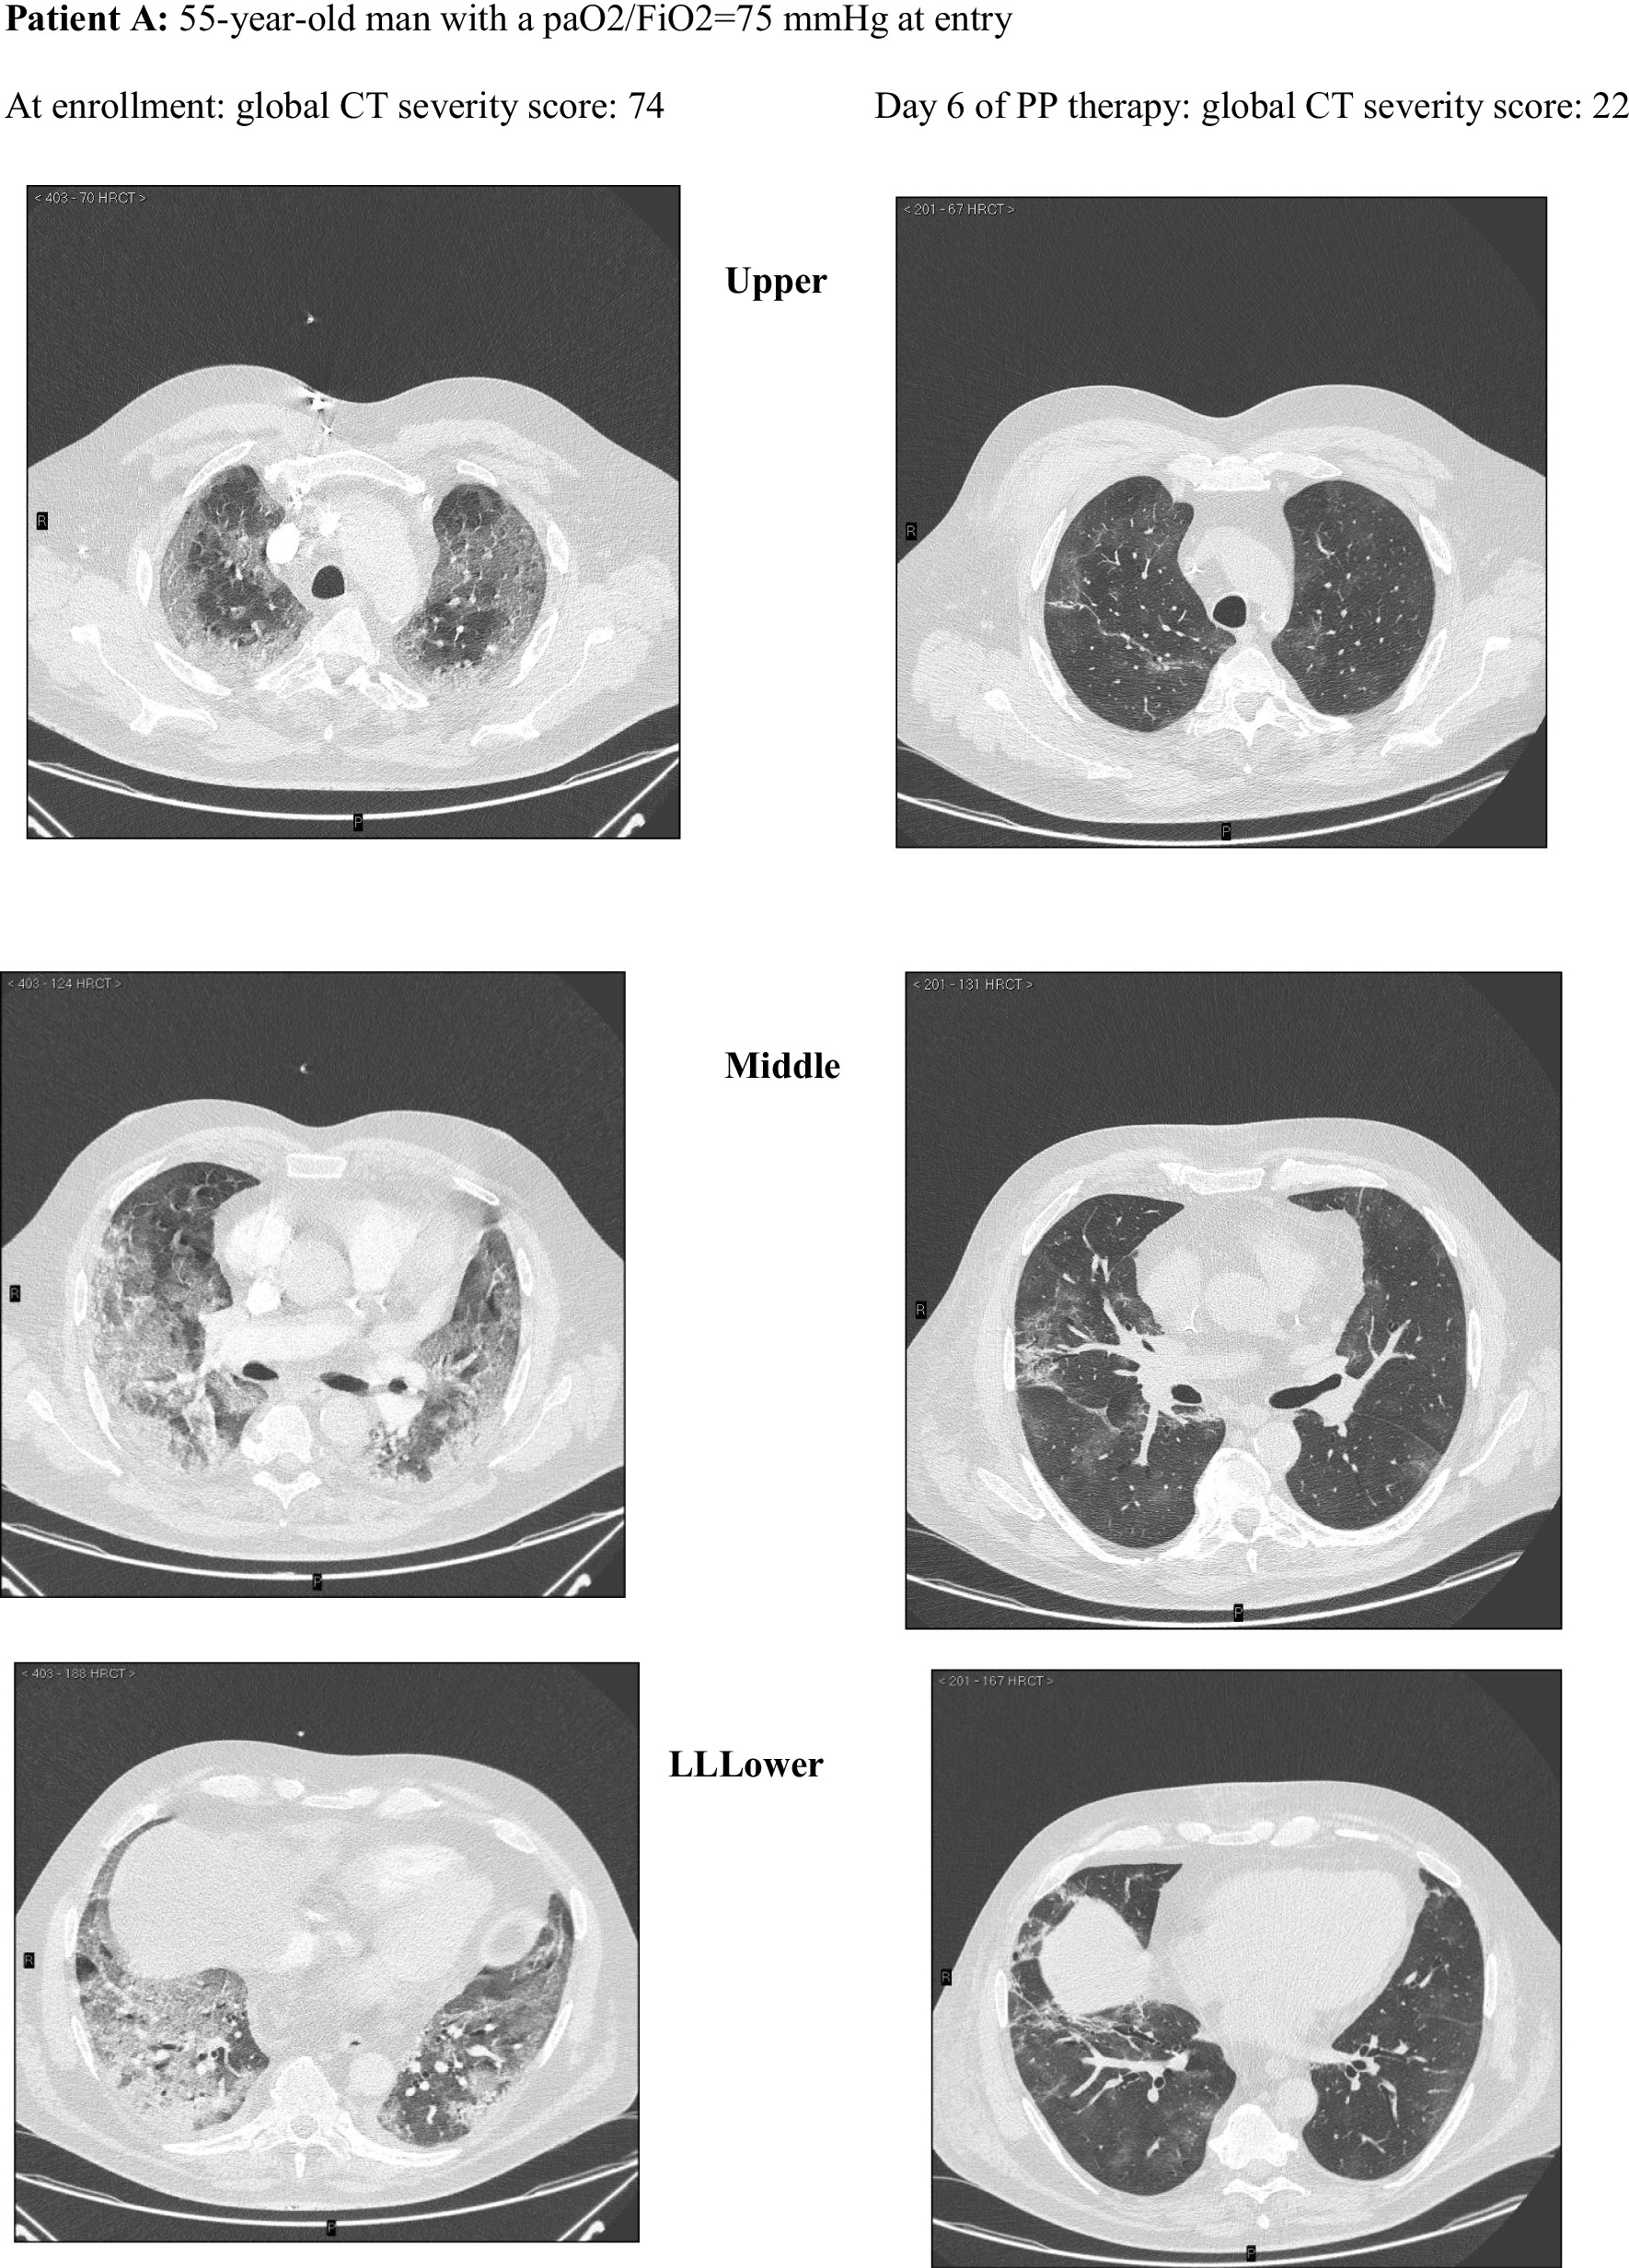
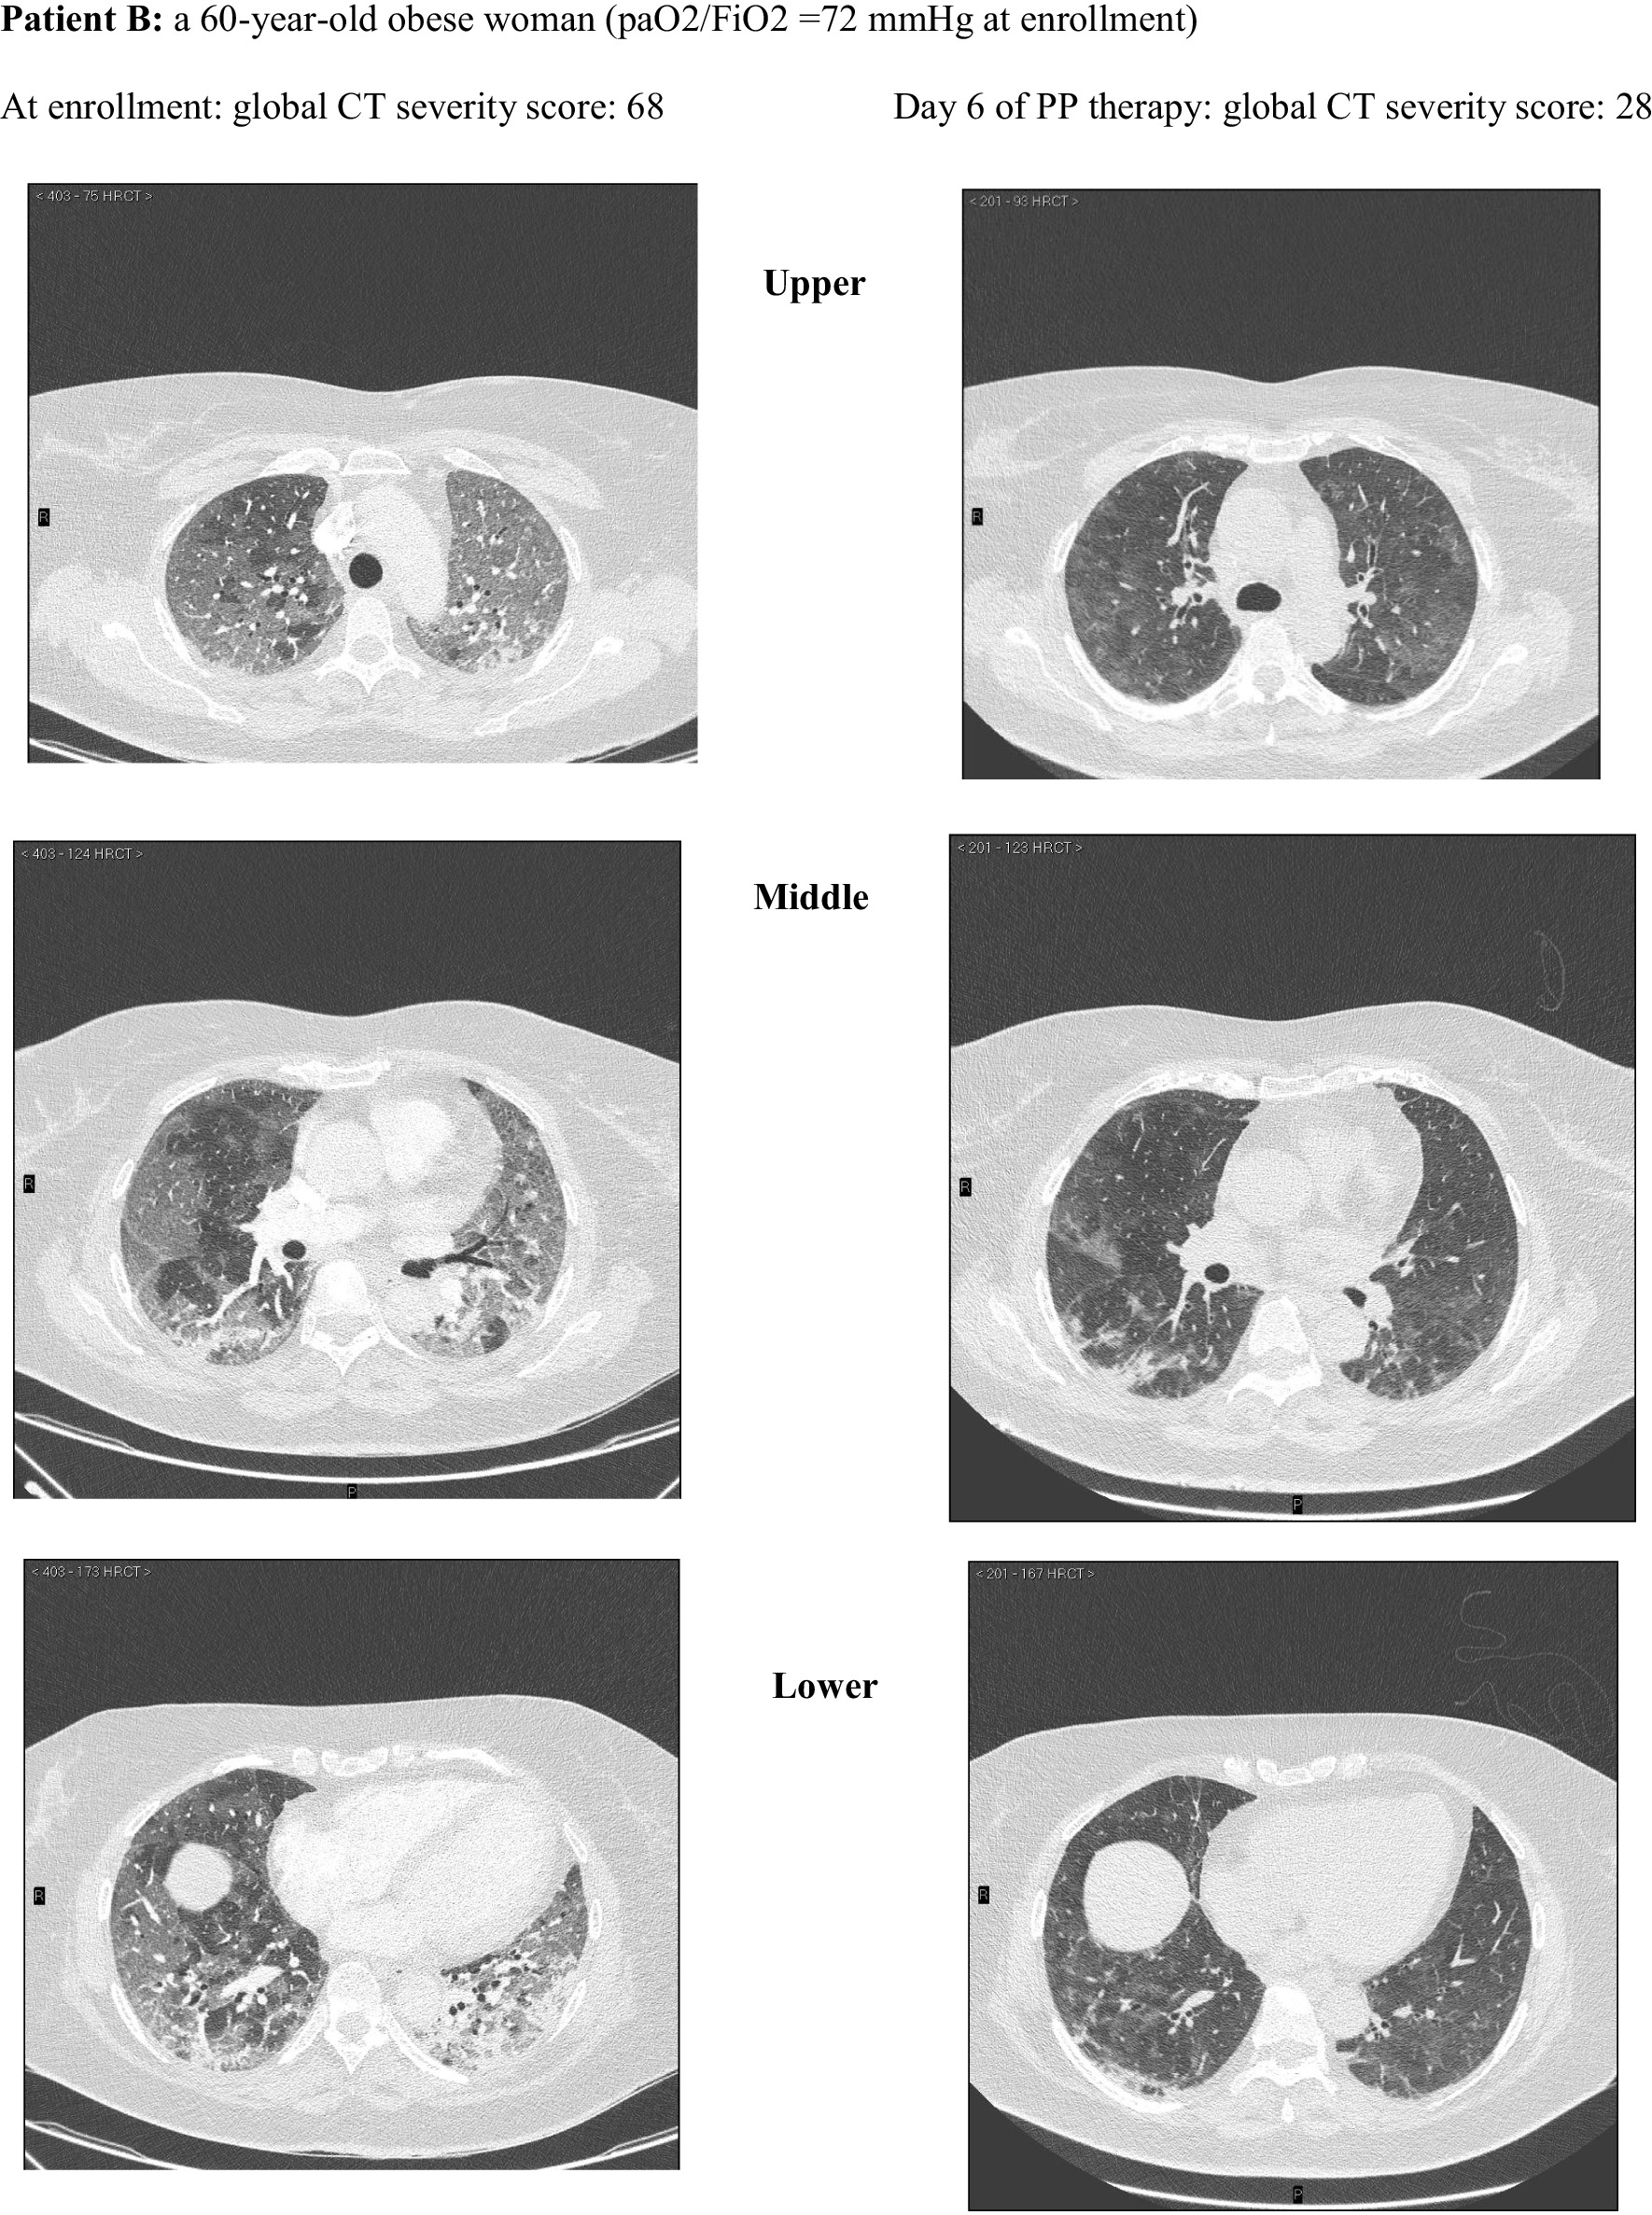
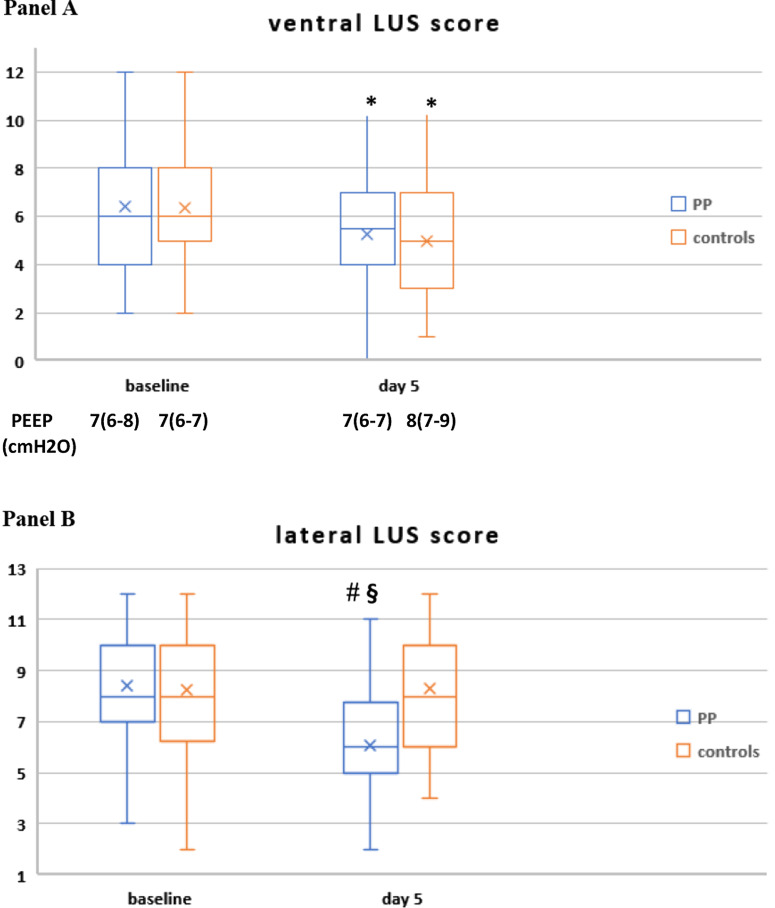
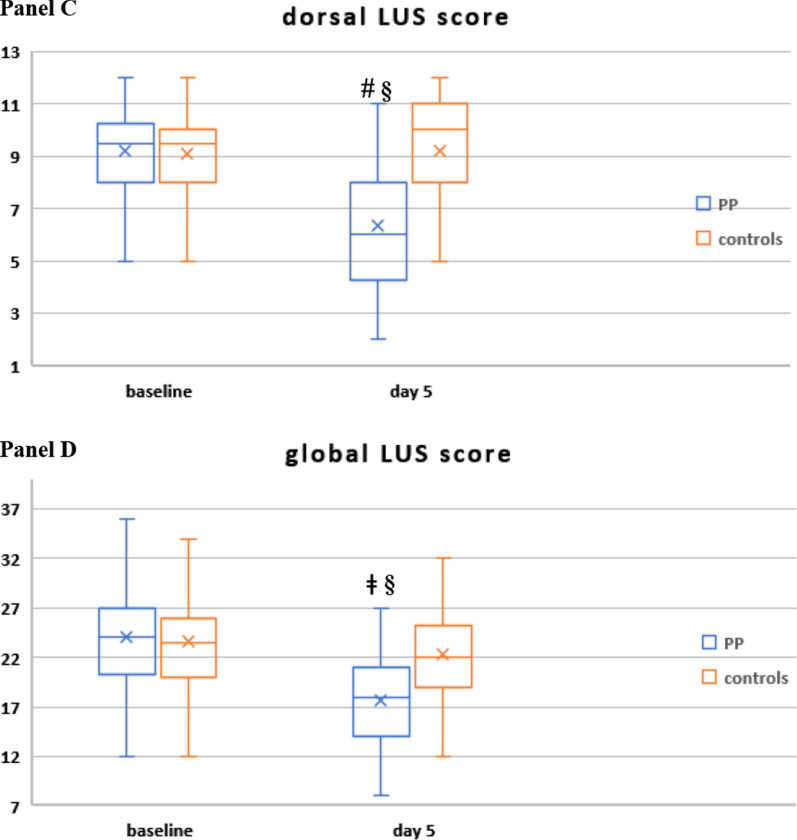
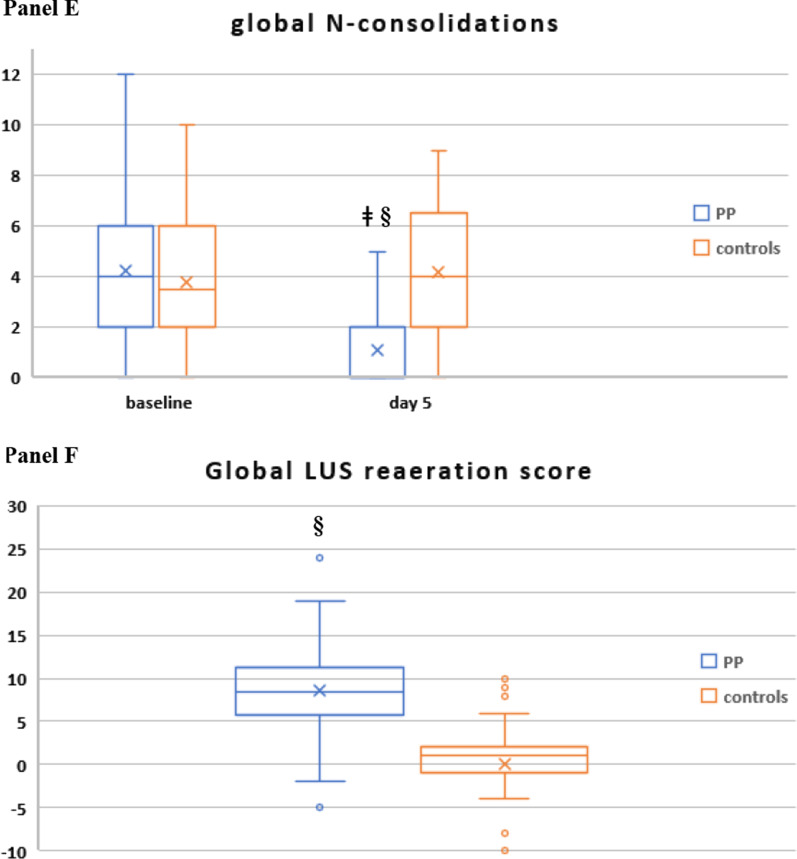
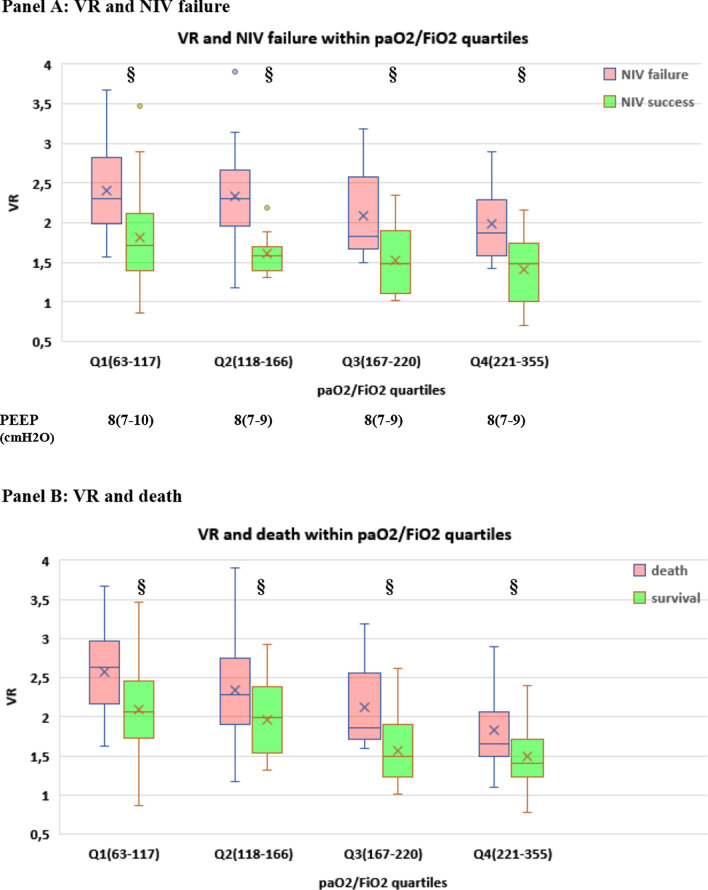
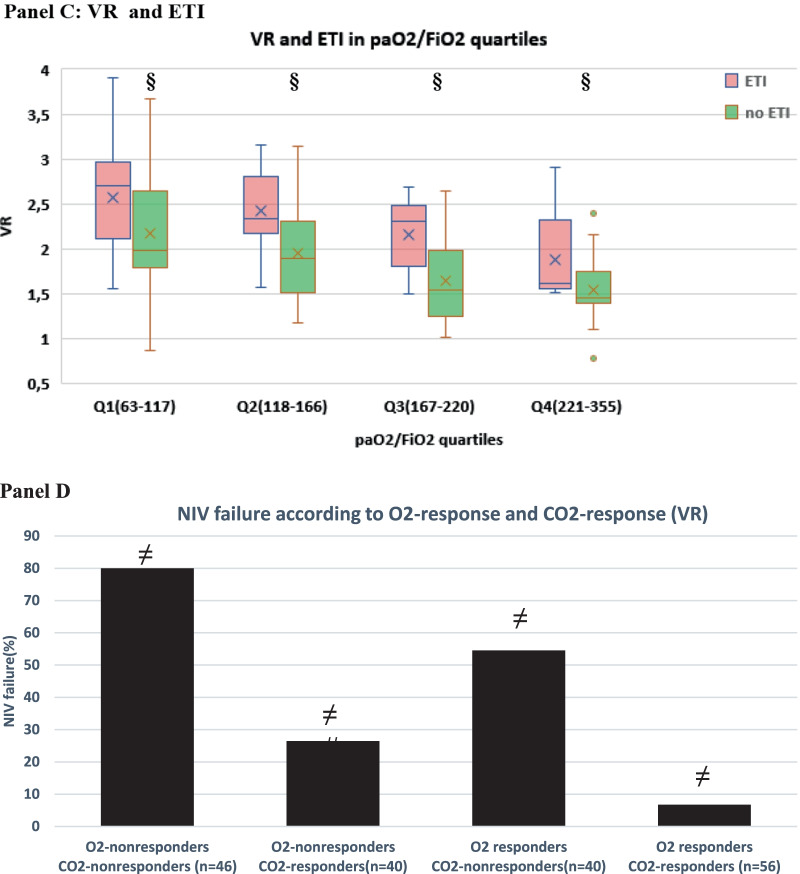
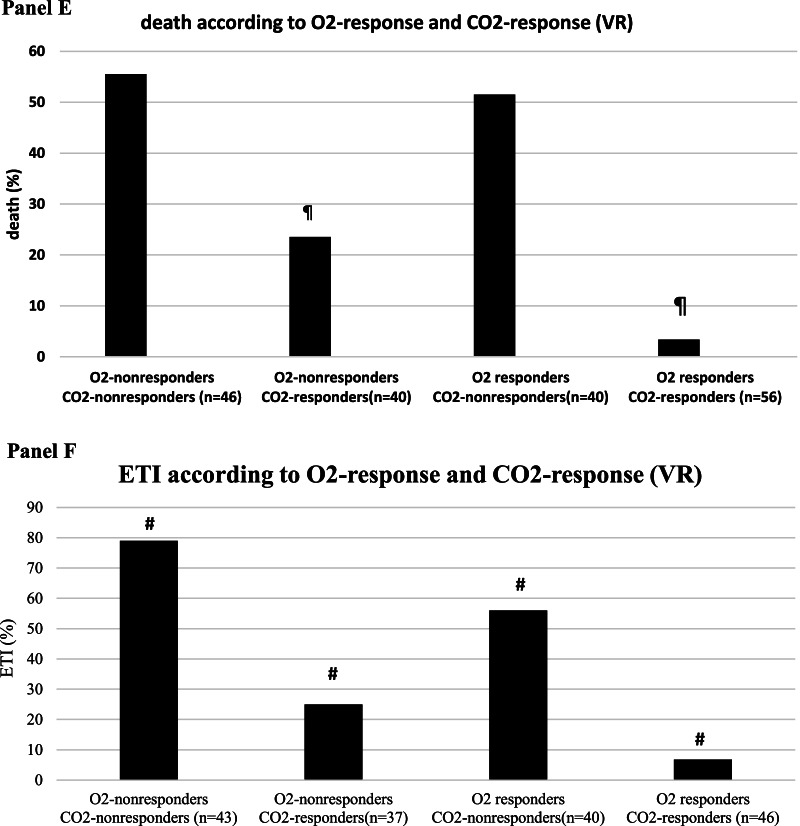
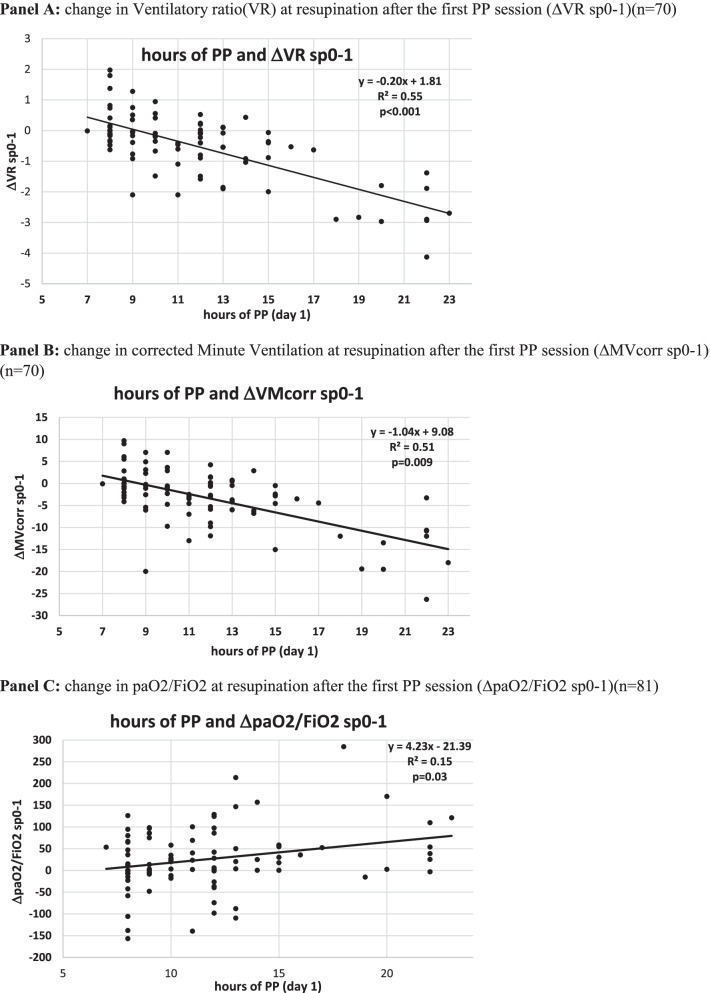
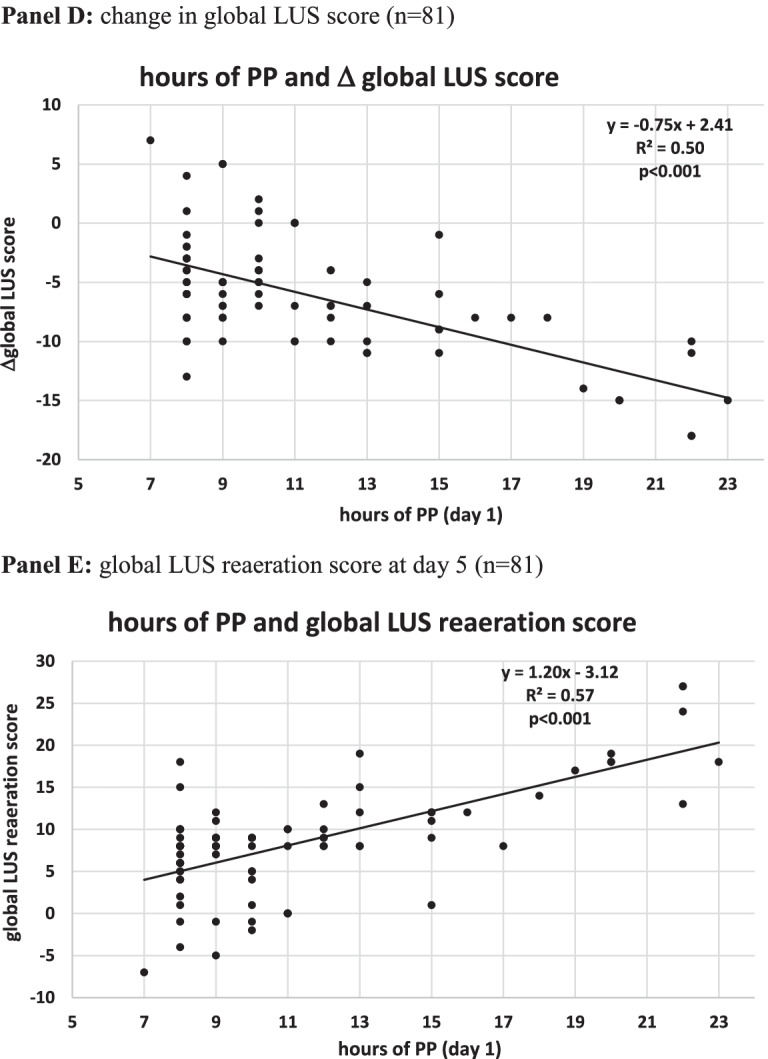
Results: In the intention-to-treat analysis. NIV failure occurred in 14 (17%) of PP patients versus 70 (43%) of controls [HR = 0.32, 95% CI 0.21-0.50; p < 0.0001]; intubation in 8 (11%) of PP patients versus 44 (30%) of controls [HR = 0.31, 95% CI 0.18-0.55; p = 0.0012], death in 10 (12%) of PP patients versus 59 (36%) of controls [HR = 0.27, 95% CI 0.17-0.44; p < 0.0001]. The effect remained significant within different categories of severity of hypoxemia (paO2/FiO2 < 100 or paO2/FiO2 100-199 at admission). Adverse events were rare and evenly distributed. Compared with controls, PP therapy was associated with improved oxygenation and DSIs, reduced global LUS severity indices largely through enhanced reaeration of dorso-lateral lung regions, and an earlier decline in inflammatory markers and D-dimer. In multivariate analysis, day 1 CO2 response outperformed O2 response as a predictor of LUS changes, NIV failure, intubation and death.

Conclusion: Early prolonged PP is safe and is associated with lower NIV failure, intubation and death rates in noninvasively ventilated patients with COVID-19-related moderate-to-severe hypoxemic respiratory failure. Early dead space reduction and reaeration of dorso-lateral lung regions predicted clinical outcomes in our study population.

Clinical trial registration: ISRCTN23016116 . Retrospectively registered on May 1, 2021.

Keywords: Corrected minute ventilation; Dead space; Lung ultrasound; Noninvasive ventilation; Ventilatory ratio.


Conflict of interest statement

No author has any present or past conflict of interest or financial interest to disclose.

Figures

Fig. 1
Fig. 1
Cumulative incidence of noninvasive ventilation (NIV) failure (A), death (B) and endotracheal intubation (C) in the prone position and control group at 28 days after enrollment. In the endotracheal intubation group, patients with a Do-Not-Intubate (DNI) disposition were excluded
Fig. 1
Fig. 1
Cumulative incidence of noninvasive ventilation (NIV) failure (A), death (B) and endotracheal intubation (C) in the prone position and control group at 28 days after enrollment. In the endotracheal intubation group, patients with a Do-Not-Intubate (DNI) disposition were excluded
Fig. 2
Fig. 2
Extent and nature of lung parenchymal involvement at three levels (upper, middle, lower) were quantified according to the score validated by Salaffi et al. (score range 0–96). Two cases with pre/post-treatment CT scans are provided below
Fig. 2
Fig. 2
Extent and nature of lung parenchymal involvement at three levels (upper, middle, lower) were quantified according to the score validated by Salaffi et al. (score range 0–96). Two cases with pre/post-treatment CT scans are provided below
Fig. 3
Fig. 3
Change in regional and global LUS score (AD), change in global number of regions with consolidated areas (N-consolidations; E) and global LUS reaeration score at day 5 (F) in study population (n = 187). In the box plots the middle line represents the median observed value, boxes represent the interquartile range (IQR), whiskers extend to the most extreme observed values with 1.5 times the interquartile range of the nearer quartile, and dots represent observed values outside that range. The cross represents the mean value within each box plot
Fig. 3
Fig. 3
Change in regional and global LUS score (AD), change in global number of regions with consolidated areas (N-consolidations; E) and global LUS reaeration score at day 5 (F) in study population (n = 187). In the box plots the middle line represents the median observed value, boxes represent the interquartile range (IQR), whiskers extend to the most extreme observed values with 1.5 times the interquartile range of the nearer quartile, and dots represent observed values outside that range. The cross represents the mean value within each box plot
Fig. 4
Fig. 4
Gas exchange, respiratory rate (RR) and blood biomarker responses during NIV in the PP group and controls. The following parameters are represented: paO2/FiO2 ratio (A), RR (B), ventilatory ratio (VR) (C), corrected Minute Ventilation (MVcorr) (D), serum C-reactive protein (E), plasma D-dimer (latex test, F), serum LDH (G). Blood lymphocyte count (H), neutrophil-to-lymphocyte ratio (I). Patients were censored from the analysis after NIV failure or success. In the box plots, the middle line represents the median observed value, boxes represent the interquartile range (IQR), whiskers extend to the most extreme observed values with 1.5 times the interquartile range of the nearer quartile, and dots represent observed values outside that range. The connecting line connects the mean values within each box plot at different time points. The PP group had a mandatory night PP session of at least 8 h; this session could be extended though the daytime or additional daytime sessions could be delivered according to clinical status and patient compliance. All ABGs were drawn during NIV, at least 1 h after assuming PP or supine position. ABG, arterial blood gas analysis; BC, blood chemistry; LUS, lung ultrasound; PP, prone position; SUP, supine position. The timepoints are indicated as follows: sp0: supine position timepoint 0 (baseline, after NIV initiation), pp1: during the first PP session in the PP group; sp1: supine position timepoint 1 (after the initial 24 h of NIV; in the PP group this also corresponded to the resupination after the first PP session) on day 1, pp2: during the second PP session, sp2: supine position timepoint 2 (after the second day of NIV, in the PP group this also corresponded to the resupination after the second PP session on day 2. pp3 during the third PP session, sp3 supine position timepoint 3 (after the third day of NIV, in the PP group this also corresponded to the resupination after the third PP session on day 3. pp4 during the fourth PP session, sp4 supine position timepoint 4 (after the 4th day of NIV, in the PP group this also corresponded to the resupination after the fourth PP session on day 4. pp5 during the fifth PP session, sp5 supine position timepoint 5 (after the fifth day of NIV, in the PP group this also corresponded to the resupination after the fifth PP session on day 5. pp6 during the sixth PP session, sp6 supine position timepoint 6 (after the sixth day of NIV, in the PP group this also corresponded to the resupination after the sixth PP session on day 6. pp7 during the seventh PP session, sp7 supine position timepoint 7 (after the seventh day of NIV, in the PP group this also corresponded to the resupination after the seventh PP session on day 7
Fig. 4
Fig. 4
Gas exchange, respiratory rate (RR) and blood biomarker responses during NIV in the PP group and controls. The following parameters are represented: paO2/FiO2 ratio (A), RR (B), ventilatory ratio (VR) (C), corrected Minute Ventilation (MVcorr) (D), serum C-reactive protein (E), plasma D-dimer (latex test, F), serum LDH (G). Blood lymphocyte count (H), neutrophil-to-lymphocyte ratio (I). Patients were censored from the analysis after NIV failure or success. In the box plots, the middle line represents the median observed value, boxes represent the interquartile range (IQR), whiskers extend to the most extreme observed values with 1.5 times the interquartile range of the nearer quartile, and dots represent observed values outside that range. The connecting line connects the mean values within each box plot at different time points. The PP group had a mandatory night PP session of at least 8 h; this session could be extended though the daytime or additional daytime sessions could be delivered according to clinical status and patient compliance. All ABGs were drawn during NIV, at least 1 h after assuming PP or supine position. ABG, arterial blood gas analysis; BC, blood chemistry; LUS, lung ultrasound; PP, prone position; SUP, supine position. The timepoints are indicated as follows: sp0: supine position timepoint 0 (baseline, after NIV initiation), pp1: during the first PP session in the PP group; sp1: supine position timepoint 1 (after the initial 24 h of NIV; in the PP group this also corresponded to the resupination after the first PP session) on day 1, pp2: during the second PP session, sp2: supine position timepoint 2 (after the second day of NIV, in the PP group this also corresponded to the resupination after the second PP session on day 2. pp3 during the third PP session, sp3 supine position timepoint 3 (after the third day of NIV, in the PP group this also corresponded to the resupination after the third PP session on day 3. pp4 during the fourth PP session, sp4 supine position timepoint 4 (after the 4th day of NIV, in the PP group this also corresponded to the resupination after the fourth PP session on day 4. pp5 during the fifth PP session, sp5 supine position timepoint 5 (after the fifth day of NIV, in the PP group this also corresponded to the resupination after the fifth PP session on day 5. pp6 during the sixth PP session, sp6 supine position timepoint 6 (after the sixth day of NIV, in the PP group this also corresponded to the resupination after the sixth PP session on day 6. pp7 during the seventh PP session, sp7 supine position timepoint 7 (after the seventh day of NIV, in the PP group this also corresponded to the resupination after the seventh PP session on day 7
Fig. 5
Fig. 5
Relationship between gas exchange parameters at day 1 and clinical outcomes (NIV failure, death, endotracheal intubation, ETI) (n = 182). A–C Relationship between dead space index Ventilatory Ratio (VR) and NIV failure, death and ETI within each paO2/FiO2 quartile at timepoint sp1 (i.e., supine position at day 1, corresponding in the PP group to resupination after the first 8-h overnight PP session). paO2/FiO2 range within each quartile and PEEP (median, IQR) at which measurements were made are reported at the bottom of the panels. §p < 0.001 versus treatment failure within quartile. D–F Simultaneous impact of O2 response and CO2 response on NIV failure, death and ETI. CO2 response was assessed via ventilatory ratio (VR). *p < 0.05 versus other groups #p < 0.01 versus other groups ¶p < 0.001 versus other groups
Fig. 5
Fig. 5
Relationship between gas exchange parameters at day 1 and clinical outcomes (NIV failure, death, endotracheal intubation, ETI) (n = 182). A–C Relationship between dead space index Ventilatory Ratio (VR) and NIV failure, death and ETI within each paO2/FiO2 quartile at timepoint sp1 (i.e., supine position at day 1, corresponding in the PP group to resupination after the first 8-h overnight PP session). paO2/FiO2 range within each quartile and PEEP (median, IQR) at which measurements were made are reported at the bottom of the panels. §p < 0.001 versus treatment failure within quartile. D–F Simultaneous impact of O2 response and CO2 response on NIV failure, death and ETI. CO2 response was assessed via ventilatory ratio (VR). *p < 0.05 versus other groups #p < 0.01 versus other groups ¶p < 0.001 versus other groups
Fig. 6
Fig. 6
Dose–response relationship between hours of individual PP sessions (day 1) and changes in gas exchange and ultrasonographic indices in PP patients. A Change in ventilatory ratio (VR) at resupination after the first PP session (VR sp0-1) (n = 70). B Change in corrected minute ventilation at resupination after the first PP session (MVcorr sp0-1) (n = 70). C Change in paO2/FiO2 at resupination after the first PP session (paO2/FiO2 sp0-1) (n = 81). D Change in global LUS score (n = 81). E Global LUS reaeration score at day 5 (n = 81). ABG, arterial blood gas analysis; BC, blood chemistry; LUS, lung ultrasound; PP, prone position; pp1: during the first PP session in the PP group; pp2: during the second PP session; SUP: supine position: sp0: supine position timepoint 0 (baseline, after NIV initiation). sp1: supine position timepoint 1 (after the initial 24 h of NIV; in the PP group this also corresponded to the resupination after the first PP session on day 1); sp2: supine position timepoint 2
Fig. 6
Fig. 6
Dose–response relationship between hours of individual PP sessions (day 1) and changes in gas exchange and ultrasonographic indices in PP patients. A Change in ventilatory ratio (VR) at resupination after the first PP session (VR sp0-1) (n = 70). B Change in corrected minute ventilation at resupination after the first PP session (MVcorr sp0-1) (n = 70). C Change in paO2/FiO2 at resupination after the first PP session (paO2/FiO2 sp0-1) (n = 81). D Change in global LUS score (n = 81). E Global LUS reaeration score at day 5 (n = 81). ABG, arterial blood gas analysis; BC, blood chemistry; LUS, lung ultrasound; PP, prone position; pp1: during the first PP session in the PP group; pp2: during the second PP session; SUP: supine position: sp0: supine position timepoint 0 (baseline, after NIV initiation). sp1: supine position timepoint 1 (after the initial 24 h of NIV; in the PP group this also corresponded to the resupination after the first PP session on day 1); sp2: supine position timepoint 2

References

    1. Xu J, Yang X, Yang L, Zou X, Wang Y, Wu Y, et al. Clinical course and predictors of 60-day mortality in 239 critically ill patients with COVID-19: a multicenter retrospective study from Wuhan, China. Crit Care. 2020;24:394. - PMC - PubMed
    1. Lim ZJ, Subramaniam A, Ponnapa Reddy M, Blecher G, Kadam U, Afroz A, et al. Case fatality rates for patients with COVID-19 requiring invasive mechanical ventilation. A meta-analysis. Am J Respir Crit Care Med. 2021;203:54–66. - PMC - PubMed
    1. Tu Y, Yang P, Zhou Y, Wen X, Li Q, Zhou J, et al. Risk factors for mortality of critically ill patients with COVID-19 receiving invasive ventilation. Int J Med Sci. 2021;18:1198–1206. - PMC - PubMed
    1. Vaschetto R, Barone-Adesi F, Racca F, Pissaia C, Maestrone C, Colombo D, et al. Outcomes of COVID-19 patients treated with continuous positive airway pressure outside the intensive care unit. ERJ Open Res. 2021;7:00541–2020. - PMC - PubMed
    1. Siempos II, Xourgia E, Ntaidou TK, Zervakis D, Magira EE, Kotanidou A, et al. Effect of early vs. delayed or no intubation on clinical outcomes of patients with COVID-19: an observational study. Front Med (Lausanne) 2020;7:614152. - PMC - PubMed

Publication types