. 2022 Sep;43(13):3923-3943.
doi: 10.1002/hbm.25893. Epub 2022 Apr 30.

Spindle-slow oscillation coupling correlates with memory performance and connectivity changes in a hippocampal network after sleep

Affiliations

Spindle-slow oscillation coupling correlates with memory performance and connectivity changes in a hippocampal network after sleep

Lisa Bastian et al. Hum Brain Mapp. 2022 Sep.

Abstract

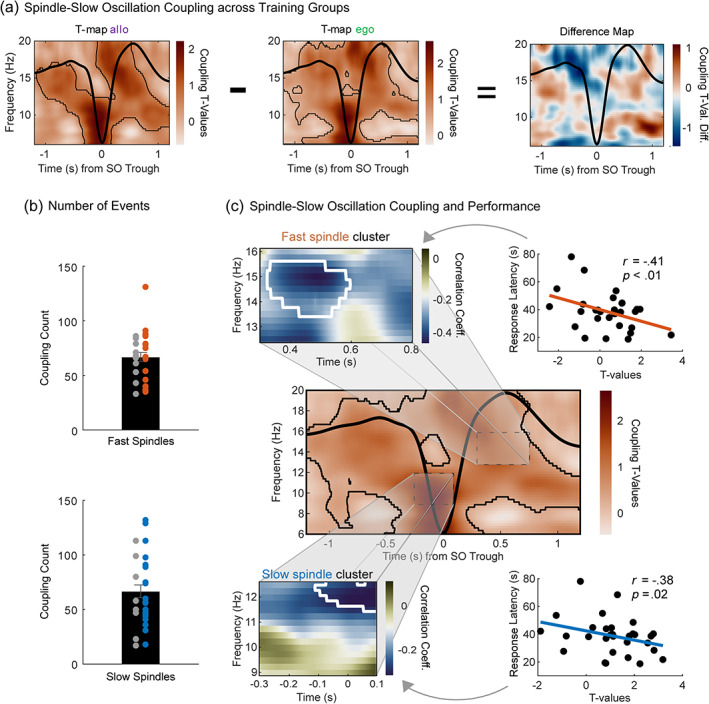
After experiences are encoded, post-encoding reactivations during sleep have been proposed to mediate long-term memory consolidation. Spindle-slow oscillation coupling during NREM sleep is a candidate mechanism through which a hippocampal-cortical dialogue may strengthen a newly formed memory engram. Here, we investigated the role of fast spindle- and slow spindle-slow oscillation coupling in the consolidation of spatial memory in humans with a virtual watermaze task involving allocentric and egocentric learning strategies. Furthermore, we analyzed how resting-state functional connectivity evolved across learning, consolidation, and retrieval of this task using a data-driven approach. Our results show task-related connectivity changes in the executive control network, the default mode network, and the hippocampal network at post-task rest. The hippocampal network could further be divided into two subnetworks of which only one showed modulation by sleep. Decreased functional connectivity in this subnetwork was associated with higher spindle-slow oscillation coupling power, which was also related to better memory performance at test. Overall, this study contributes to a more holistic understanding of the functional resting-state networks and the mechanisms during sleep associated to spatial memory consolidation.

Keywords: memory consolidation; resting-state networks; sleep; slow oscillations; spindles.


Figures

FIGURE 1
FIGURE 1
Experimental procedure, task design and memory performance. (a) A 2 × 2 full‐factorial design with four groups: Sleep–allocentric (n = 15), sleep–egocentric (n = 15), wake–allocentric (n = 15), wake–egocentric (n = 18). Subjects participated in two fMRI sessions in which they learned and retrieved a spatial memory task, either in the egocentric or allocentric condition. In both sessions, resting‐state fMRI was measured for 9 min before and after task performance. In between the learning and retrieval session, participants were further divided into the sleep or wake control condition, in which they took a nap or watched a movie for 90 min. These measurements were acquired on the same day. Participants who were in the sleep condition returned for a nap control session of 90 min after ~14 days. (b) Learning‐retrieval task configuration. Green arrows indicate the starting locations on different trials. In the egocentric condition participants started from the same island locations on every learning trial. In contrast, in the allocentric condition, the starting location changed for every learning trial. The target location was marked with a treasure box during the learning period but the box was absent in the retrieval session. (c) Behavioral results obtained at test. Participants in the egocentric condition (purple bar contours) showed a significantly better memory performance compared with participants in the allocentric condition (green bar contours). Lower latency scores indicate better performance. Participants who took a nap (black bar fillings) performed significantly better compared with those that stayed awake (white bar fillings). Error bars = SEM.
FIGURE 2
FIGURE 2
Spindle–slow oscillation coupling across sleep test and control sessions. SO, Slow oscillation; sSP, Slow spindle; fSP, Fast spindle; test, Sleep test session; control, Sleep control session. (a) %‐coupling of spindles to slow oscillations and vice versa. Fast and slow spindles coincide with slow oscillations in both sleep sessions. About onefourth of all fast spindles (orange) and slow spindles (blue) occur within an interval of ±1.2 s around the slow oscillation trough. Approximately an equal amount of slow oscillations is coupled to the occurrence of spindles (grey) in the same interval. Violin plots show the median (white dot), mean (dotted line), IQR and sample distributions. c.t., “coupled to.” (b) Specific time and phase relationship between spindles and slow oscillations. PETHs of slow and fast spindles co‐occurring with frontal slow oscillations are depicted for both sleep sessions. The reference distribution obtained after randomization of the data is shown by horizontal dashed line. Asterisks indicate significantly increased spindle occurrence contrasted with the reference distribution (cluster‐based permutation test, cluster α < 0.05, positive clusters only). Vertical dashed lines mark the slow oscillation trough. Average slow‐oscillation ERPs are shown for each session. In both sessions, frontal slow spindles peak at the up‐ to down‐state transition before the trough (significant positive cluster: −300 to 100 ms). Central fast spindles prominently peak during the slow oscillation peak (test: significant positive cluster: 400–700 ms, control: significant positive cluster: 500–800 ms). Error bars of 100‐ms time bins = SEM. Polar plots show spindle–slow oscillation coupling for one example subject (top) and group level results (bottom). Top: Polar histograms display maximum spindle amplitude per slow oscillation phase. Note the peak in the right lower quadrant for fast spindles (i.e., 3π/2 – 2π) and the left upper quadrant for slow spindles (i.e., π/2 – π). Mean slow oscillation phase with sleep spindle power peaks. Bottom: Dots depict individual subjects and the black line the average of the sample results. (c) Consistency in phase relationship between spindles and slow oscillations. Ridge‐line plots of fast spindle–PPCs (orange) and slow spindles‐PPCs (blue) for all subjects across sleep sessions. PPC values are expressed by color and height of the ridgelines. Slow oscillation frequencies (0.3–1.25 Hz) are outlined with black dotted line.
FIGURE 3
FIGURE 3
Spindle–slow oscillation coupling at sleep test session and its association with memory performance. (a) Power modulations in the two memory conditions at sleep test session. Differences in power for slow oscillation trials (trough ±1.2 s) compared with baseline trials without slow oscillations are depicted (in t‐score units) for the allo and ego group separately. The t‐map ego was subtracted from t‐map allo to obtain the difference map. The average frontal slow oscillation for each memory group is overlaid in black. In both groups, EEG activity is modulated as a function of the slow oscillation phase but there is no difference between the two groups. Significant clusters are outlined in black (cluster‐based permutation test, cluster α < 0.05). (b) Bar graphs including sample distribution of coupling count for fast spindles (top) and slow spindles (bottom) at sleep test session. Colored dots mark the subjects whose spindle–slow oscillation coupling was significantly above chance level (permutation test, α < 0.05). Error bars = SEM. (c) Correlation of spindle–slow oscillation power modulations and memory performance. Middle: The t‐map as outlined in (a) but including all subjects (slow spindles and fast spindle reference windows for later analyses highlighted by dashed black line). Top left: Fast spindle window with significant correlation clusters between slow oscillation‐specific EEG activity and memory performance obtained by contrasting the correlation for each time–frequency point against a reference distribution of bootstrapped EEG–behavior correlations. Significant correlation cluster is outlined in white. Top right: Maximum correlation pixel extracted from the fast spindle cluster contrasting t‐statistics against response latency in the memory task. Bottom left: Slow spindle window with correlation values between slow oscillation‐specific EEG activity and memory performance obtained as for fast spindle window. Bottom right: Same as top right but for slow spindles related t‐statistics.
FIGURE 4
FIGURE 4
Changes in primary modes of the resting‐state networks across sessions. ECN1, primary executive control network; DMN1, primary default mode network; HN1, primary hippocampal network. (a) Left: Sagittal and axial representation of the primary mode in the right executive control network. The degree of each one of the 832 regions is represented by the node's size. Middle: Results of a linear mixed‐effects model with session as within‐subject factor, sleep and memory as between‐subjects, all two‐ and three‐way interaction terms between those factors, and subject * session as random factor. Functional connectivity increased pre‐ to post‐task performance. Right: Results shown as difference from previous session to next session. Only post‐break to post‐test showed changes greater than 0. (b) Left: Same as in (a) but for the default mode network. Middle: Same model as in (a). In contrast, the results show that the functional connectivity decreased pre‐ to post‐task performance. Right: Results shown as difference from previous session to next session. Only post‐break to post‐test showed changes greater than 0 (c), left: Same as in (a,b) but for the hippocampal network. Middle: Same analysis as in (a,b). Note that the functional connectivity increased pre‐ to post‐task performance and pre‐ to post‐break. Right: Results shown as difference from previous session to next session. Both baseline to post‐training and post‐break to post‐test showed changes greater than 0. Error bars = SEM.
FIGURE 5
FIGURE 5
Sleep‐related changes in the second hippocampal subnetwork and its association with spindle–slow oscillation coupling. (a) HN2, second hippocampal network. Top: Graphical representation of the second mode in the hippocampal network. The degree of each one of the 832 regions is represented by the node's size. Bottom: Results of a linear mixed‐effects model with session as within‐subject factor, sleep and memory as between‐subjects factor and subject * session as random factor. Functional connectivity decreased significantly in this hippocampal subnetwork across sessions in the sleep condition but remained largely stable in the wake condition. On the right the difference scores are presented. Only for sleep but not wake was there a significant change across the break period. Error bars and shadings = SEM. (b) Middle: T‐map as outlined in Figure 3c (slow spindle and fast spindle reference windows for later analyses highlighted by dashed black line). Top left: Fast spindle window with significant correlation clusters between SO‐specific EEG activity and post‐learning to post‐break change in the hippocampal subnetwork obtained by contrasting the correlation for each time–frequency point against a reference distribution of bootstrapped EEG–behavior correlations. Significant correlation clusters are outlined in white. Top right: Maximum correlation pixel extracted from the fast spindle cluster contrasting t‐statistics against change in second hippocampal mode score. Bottom left: Same as top left but for slow spindle cluster. Bottom right: Same as top right but for slow spindle related t‐statistics

References

    1. Adamczyk, M. , Genzel, L. , Dresler, M. , Steiger, A. , & Friess, E. (2015). Automatic sleep spindle detection and genetic influence estimation using continuous wavelet transform. Frontiers in Human Neuroscience, 9(624). - PMC - PubMed
    1. Akaike, H. (1973). Maximum likelihood identification of Gaussian autoregressive moving average models. Biometrika, 60(2), 255–265.
    1. Albouy, G. , Fogel, S. , King, B. R. , Laventure, S. , Benali, H. , Karni, A. , Carrier, J. , Robertson, E. M. , & Doyon, J. (2015). Maintaining vs. enhancing motor sequence memories: Respective roles of striatal and hippocampal systems. NeuroImage, 108, 423–434. 10.1016/j.neuroimage.2014.12.049 - DOI - PubMed
    1. Anderer, P. , Klösch, G. , Gruber, G. , Trenker, E. , Pascual‐Marqui, R. D. , Zeitlhofer, J. , Barbanoj, M. J. , Rappelsberger, P. , & Saletu, B. (2001). Low‐resolution brain electromagnetic tomography revealed simultaneously active frontal and parietal sleep spindle sources in the human cortex. Neuroscience, 103(3), 581–592. - PubMed
    1. Barakat, M. , Doyon, J. , Debas, K. , Vandewalle, G. , Morin, A. , Poirier, G. , Martin, N. , Lafortune, M. , Karni, A. , Ungerleider, L. G. , Benali, H. , & Carrier, J. (2011). Fast and slow spindle involvement in the consolidation of a new motor sequence. Behavioural Brain Research, 217(1), 117–121. 10.1016/j.bbr.2010.10.019 - DOI - PubMed

Publication types

LinkOut - more resources