. 2022 Jun;9(18):e2104640.
doi: 10.1002/advs.202104640. Epub 2022 Apr 30.

Nurr1 Modulation Mediates Neuroprotective Effects of Statins

Affiliations

Nurr1 Modulation Mediates Neuroprotective Effects of Statins

Sabine Willems et al. Adv Sci (Weinh). 2022 Jun.

Abstract

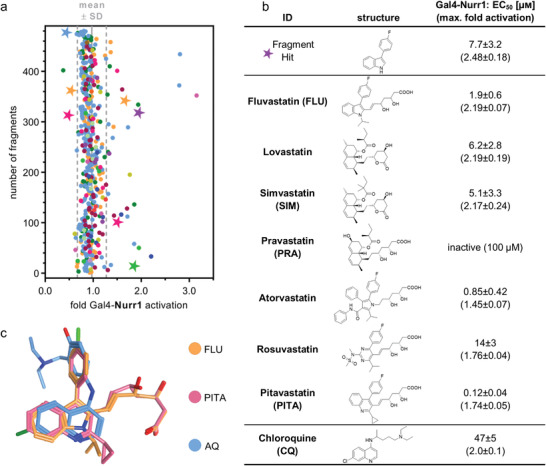
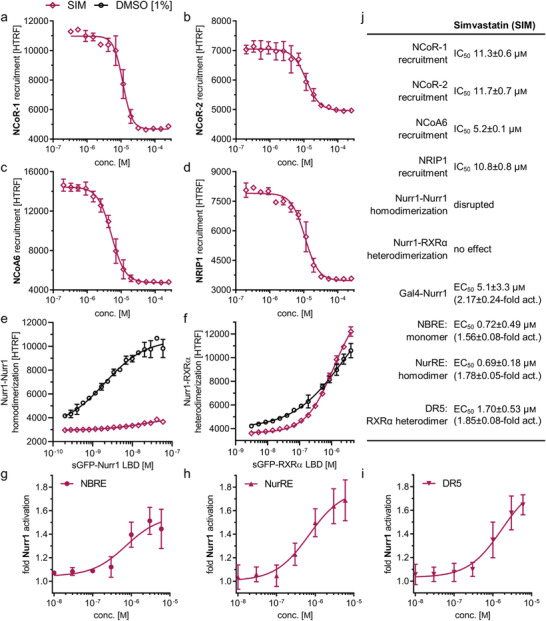
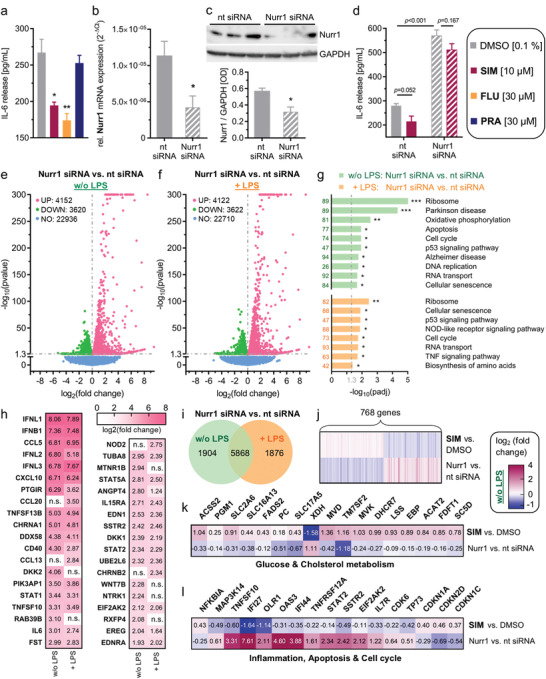
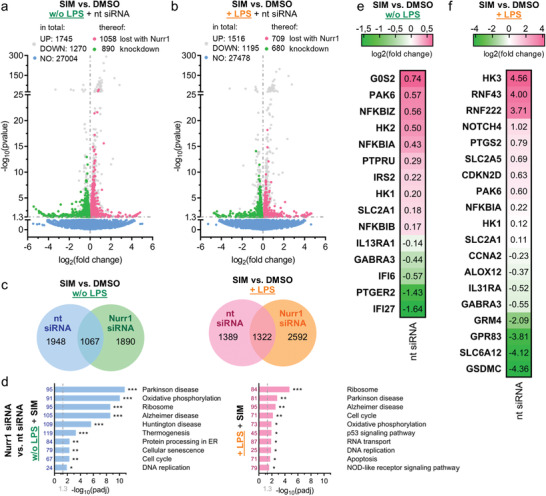
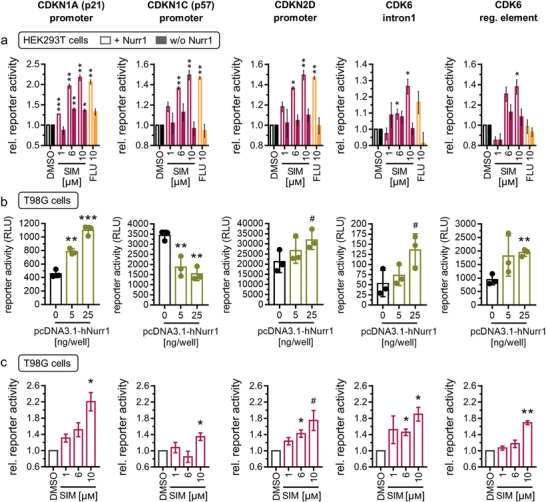
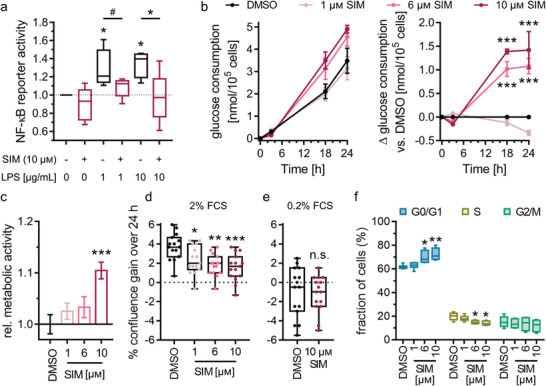
The ligand-sensing transcription factor Nurr1 emerges as a promising therapeutic target for neurodegenerative pathologies but Nurr1 ligands for functional studies and therapeutic validation are lacking. Here pronounced Nurr1 modulation by statins for which clinically relevant neuroprotective effects are demonstrated, is reported. Several statins directly affect Nurr1 activity in cellular and cell-free settings with low micromolar to sub-micromolar potencies. Simvastatin as example exhibits anti-inflammatory effects in astrocytes, which are abrogated by Nurr1 knockdown. Differential gene expression analysis in native and Nurr1-silenced cells reveals strong proinflammatory effects of Nurr1 knockdown while simvastatin treatment induces several neuroprotective mechanisms via Nurr1 involving changes in inflammatory, metabolic and cell cycle gene expression. Further in vitro evaluation confirms reduced inflammatory response, improved glucose metabolism, and cell cycle inhibition of simvastatin-treated neuronal cells. These findings suggest Nurr1 involvement in the well-documented but mechanistically elusive neuroprotection by statins.

Keywords: Alzheimer's disease; NR4A2; Parkinson's disease; multiple sclerosis; nuclear receptor related-1.


Conflict of interest statement

The authors declare no conflict of interest.

Figures

Figure 1
Figure 1
Discovery of statins as Nurr1 modulators and their profiling. a) Primary fragment screening results. Nurr1 modulatory activity of the entire drug fragment library in a Gal4‐Nurr1 hybrid reporter gene assay. Data are the mean reporter activity versus 0.4% DMSO at 100 × 10−6 m; n = 2. Different colors represent different graph frameworks (see also Figure S1, Supporting Information). Compounds marked with a star relate to the fragment hits validated in control experiments on Gal4‐VP16. Gray lines represent mean ± SD of the entire screening. b) Nurr1 modulatory activity of the fragment screening hit and of the statin class of drugs (vs 0.1% DMSO) in a Gal4‐Nurr1 hybrid reporter gene assay. Data for chloroquine (CQ) from ref. [15]. Data are the mean ± S.E.M.; n ≥ 3. c) Multiple alignment of fluvastatin (FLU), pitavastatin (PITA), and amodiaquine (AQ) reveals common structural features with overlap of the indole and quinoline scaffolds as well as the phenyl substituents.
Figure 2
Figure 2
Profiling of simvastatin (SIM) as Nurr1 modulator. a–f) Effects of SIM on coregulator interactions and dimerization of Nurr1 in HTRF assays. SIM displaced a) NCoR‐1, b) NCoR‐2, c) NCoA6, and d) NRIP1 from the Nurr1 LBD in a dose‐dependent fashion and 30 × 10−6 m SIM decreased e) homodimerization of Nurr1 f) without affecting Nurr1‐RXRα heterodimerization. Data are the mean ± SD; N = 3. g–i) Profiling of SIM in human full‐length Nurr1 reporter gene assays for the Nurr1 response elements NBRE (g, Nurr1 monomer), NurRE (h, Nurr1 homodimer), and DR5 (i, Nurr1‐RXRα heterodimer). Data are the mean ± S.E.M., n ≥ 3. j) Summarized activities of Nurr1 modulator SIM in cell‐free and cellular experiments.
Figure 3
Figure 3
Nurr1 is involved in neuroinflammatory signaling and Nurr1 silencing causes opposite effects to simvastatin treatment. a) Lipopolysaccharide (LPS)‐treated (1 µg mL−1) T98G cells released considerable amounts of interleukin‐6 (IL‐6). The Nurr1 agonists simvastatin (SIM) and fluvastatin (FLU) significantly counteracted IL‐6 release from LPS‐treated T98G cells, whereas pravastatin (PRA), as negative control, did not affect IL‐6 release. Data are the mean ± S.E.M., n = 4, # p < 0.1, * p < 0.05, ** p < 0.01 (t‐test). b,c) Nurr1 knockdown efficiency as determined by Nurr1 mRNA levels (qRT‐PCR, 2−ΔCt method with GAPDH as reference gene, b) and by western blot (c). Data are the mean ± S.E.M., n = 8 (qRT‐PCR), n = 4 (western blot), * p < 0.05 versus nontargeting (nt) control siRNA (t‐test). d) IL‐6 release from LPS‐treated T98G cells was further enhanced by siRNA‐mediated Nurr1 knockdown suggesting reverse Nurr1 involvement in this inflammatory response. The Nurr1 agonist SIM ameliorated the inflammatory response of T98G cells in a Nurr1‐dependent manner. Data are the mean ± S.E.M., n = 3, p‐values from t‐test. e,f) Differential gene expression in T98G cells treated with nt or Nurr1 siRNA in absence (e) or presence (f) of LPS. Volcano plots show log2fold change in gene expression level (x‐axis) versus statistical significance level (‐log10(p‐value); y‐axis). g) KEGG pathway enrichment analysis illustrates involvement of Nurr1 in signaling pathways related to neurodegenerative diseases and neuroinflammation. Bar plot shows statistical significance level (‐log10(padj)) of regulated KEGG pathways, numbers refer to the count of differentially expressed genes related to the pathway. n = 3, * p < 0.05, ** p < 0.01, *** p < 0.001. h) Selected differentially expressed genes with log2fold change > |2| associated with neurodegenerative diseases (PD, AD, neurodegeneration) or neuroinflammatory signaling (TNF, NFκB, WNT, TGFβ, JAK‐STAT, PI3K‐Akt, apoptosis, neuroactive interaction) according to KEGG are listed with their respective log2fold change values for Nurr1 silencing compared to nt siRNA control in absence or presence of LPS. n.s. – not significant. i) Coexpression Venn diagram for differential gene expression in Nurr1‐silenced cells versus nt siRNA for ± LPS‐treated cells. j–l) 768 genes were oppositely regulated by Nurr1 knockdown or simvastatin treatment in T98G cells (j, Gene list S3, Supporting Information) including several key genes of glucose and cholesterol metabolism (k) as well as inflammation, cell cycle regulation and apoptosis (l). Heatmaps show log2fold change for selected significantly (p < 0.05) regulated genes.
Figure 4
Figure 4
Simvastatin affected gene expression of human astrocytes (T98G) in a Nurr1‐dependent manner. a,b) Differentially expressed genes for simvastatin (SIM, 10 × 10−6 m) versus DMSO treatment in nt siRNA‐treated or Nurr1‐silenced T98G cells without (a) and with (b) additional lipopolysaccharide (LPS)‐stimulation. Genes regulated in nt siRNA‐treated and Nurr1‐silenced cells are gray, genes regulated only in nt siRNA‐treated but not in Nurr1‐silenced cells are red (induction) or green (downregulation). Volcano plots show log2fold change in gene expression level (x‐axis) versus statistical significance level (‐log10(p‐value); y‐axis), n = 3. c) Coexpression Venn diagrams show effects of SIM versus DMSO treatment in nt siRNA‐treated versus Nurr1‐silenced T98G cells with or without additional LPS‐stimulation. d) KEGG pathway enrichment analysis demonstrates effects of Nurr1 activation by SIM on the expression of genes related to cell cycle, apoptosis, oxidative phosphorylation, and thermogenesis as well as the neurodegenerative diseases AD and PD. Bar plot shows statistical significance level (‐log10(padj)) of regulated KEGG pathways, numbers refer to the count of differentially expressed genes related to the pathway. n = 3, * p < 0.05, ** p < 0.01, *** p < 0.001. e,f) Selected genes that were regulated by SIM versus DMSO treatment without (e) or with (f) additional LPS‐stimulation in nt siRNA‐treated cells whose expression was unaffected in Nurr1 siRNA‐treated cells. Only selected genes related to neuroprotection and neuroinflammation are shown, further regulated genes in Tables S1 and S2 of the Supporting Information. Heatmap shows log2fold change in gene expression.
Figure 5
Figure 5
Reporter constructs validated Nurr1 involvement and Nurr1‐mediated effects of simvastatin in the regulation of CDKN1A (p21), CDKN1C (p57), CDKN2D, and CDK6. a) In presence of Nurr1 (plain bars), simvastatin (SIM, 1 × 10−6, 6 × 10−6, 10 × 10−6 m) and fluvastatin (FLU, 10 × 10−6 m) activated reporter constructs comprising the promoter regions of the CDKN1A, CDKN1C, and CDKN2D genes or the intron 1 of the CDK6 gene or the regulatory element of the CDK6 gene. Without cotransfection of Nurr1 (filled bars), the statins had a weaker or no effect. Data are the mean ± S.E.M., n = 4. b) In Nurr1 expressing T98G cells, Nurr1 overexpression altered reporter activity. Data are the mean ± SD, n = 3. c) Simvastatin activated the reporter constructs also in T98G cells. Data are the mean ± S.E.M., n = 4. # p < 0.1, * p < 0.05, ** p < 0.01, *** p < 0.001 (t‐tests vs control or as indicated).
Figure 6
Figure 6
Simvastatin treatment altered inflammatory response, metabolism, and cell cycle of astrocytes. a) Simvastatin (SIM, 10 × 10−6 m) counteracted lipopolysaccharide (LPS)‐induced NFκB activity in T98G cells overexpressing Nurr1. Boxplots show min.–max. relative activity of an NFκB response element luciferase reporter, n = 4. # p < 0.1, * p < 0.05 (ANOVA). b) SIM enhanced glucose consumption of T98G cells in a dose‐dependent fashion. Graphs show mean ± S.E.M. absolute glucose consumption over time and mean ± S.E.M. Δglucose consumption versus DMSO‐treated cells over time, n = 3. *** p < 0.001 (ANOVA). c) SIM enhanced metabolic activity of T98G cells in a dose‐dependent fashion. Metabolic activity was determined with the WST‐8 reagent. Data are the mean ± S.E.M. relative metabolic activity versus DMSO‐treated cells, n = 15. *** p < 0.001 versus DMSO (ANOVA). d) SIM decreased the fetal calf serum (FCS)‐stimulated (2%) proliferation of T98G cells in a dose‐dependent fashion but had no effect in nonproliferating cells (0.2% FCS, e). Boxplots show min.–max. gain in confluence over 24 h, n = 15. * p < 0.05, ** p < 0.01, *** p < 0.001 versus DMSO‐treated cells (ANOVA). f) Cell cycle analysis of T98G cells treated with 2% FCS and varying concentrations of SIM by flow cytometry. Boxplots show min.–max., n = 6. * p < 0.05, ** p < 0.01 versus DMSO (ANOVA).

Similar articles

Cited by

References

    1. Wang Z., Benoit G., Liu J., Prasad S., Aarnisalo P., Liu X., Xu H., Walker N. P. C., Perlmann T., Nature 2003, 423, 555. - PubMed
    1. Decressac M., Volakakis N., Björklund A., Perlmann T., Nat. Rev. Neurol. 2013, 9, 629. - PubMed
    1. Kim C.‐H., Han B.‐S., Moon J., Kim D.‐J., Shin J., Rajan S., Nguyen Q. T., Sohn M., Kim W.‐G., Han M., Jeong I., Kim K.‐S., Lee E.‐H., Tu Y., Naffin‐Olivos J. L., Park C.‐H., Ringe D., Yoon H. S., Petsko G. A., Kim K.‐S., Proc. Natl. Acad. Sci. USA 2015, 112, 8756. - PMC - PubMed
    1. Liu W., Gao Y., Chang N., Biochem. Biophys. Res. Commun. 2017, 482, 1312. - PubMed
    1. Montarolo F., Perga S., Martire S., Bertolotto A., Inflammation Res. 2015, 64, 841. - PubMed

Publication types

MeSH terms

Substances