. 2022 Jun 15;110(12):1959-1977.e9.
doi: 10.1016/j.neuron.2022.04.002. Epub 2022 Apr 29.

Ripple-selective GABAergic projection cells in the hippocampus

Affiliations

Ripple-selective GABAergic projection cells in the hippocampus

Gergely G Szabo et al. Neuron. .

Abstract

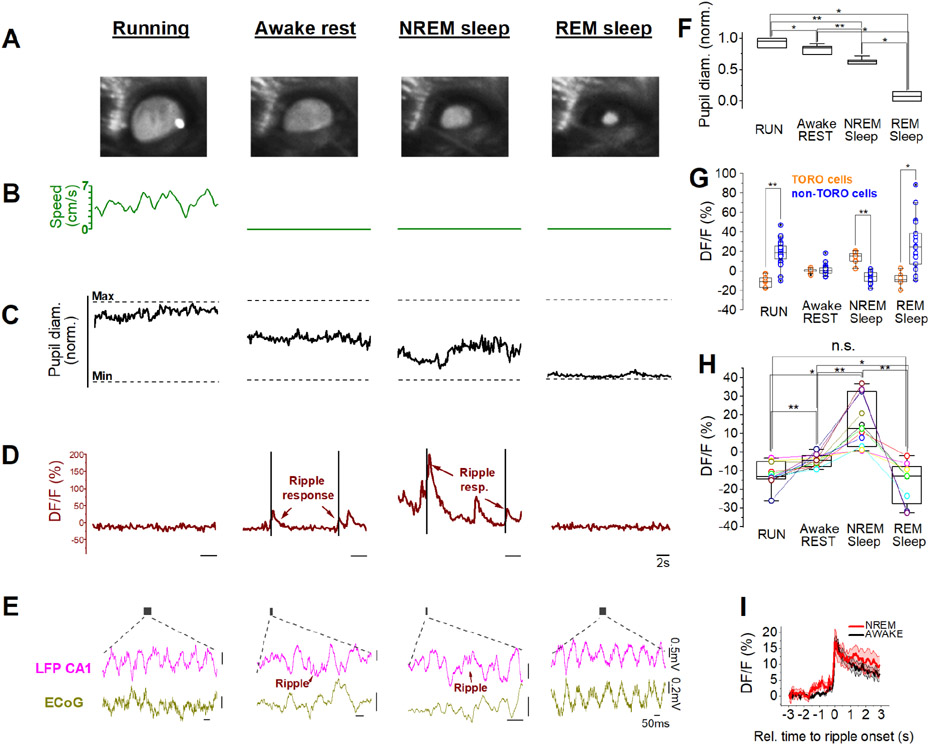
Ripples are brief high-frequency electrographic events with important roles in episodic memory. However, the in vivo circuit mechanisms coordinating ripple-related activity among local and distant neuronal ensembles are not well understood. Here, we define key characteristics of a long-distance projecting GABAergic cell group in the mouse hippocampus that selectively exhibits high-frequency firing during ripples while staying largely silent during theta-associated states when most other GABAergic cells are active. The high ripple-associated firing commenced before ripple onset and reached its maximum before ripple peak, with the signature theta-OFF, ripple-ON firing pattern being preserved across awake and sleep states. Controlled by septal GABAergic, cholinergic, and CA3 glutamatergic inputs, these ripple-selective cells innervate parvalbumin and cholecystokinin-expressing local interneurons while also targeting a variety of extra-hippocampal regions. These results demonstrate the existence of a hippocampal GABAergic circuit element that is uniquely positioned to coordinate ripple-related neuronal dynamics across neuronal assemblies.

Keywords: GABA; brain state; disinhibition; hippocampus; inhibition; medial septum; muscarinic; sharp-wave ripple; sleep.


Conflict of interest statement

Declaration of interests The authors declare no competing interests.

Figures

Figure 1.
Figure 1.. Distinct in vivo activity dynamics of theta-OFF, ripple-ON cells in the CA1 region of the mouse hippocampus assessed with juxtacellular recordings.
(A) Partial reconstruction of a representative theta-ON, ripple-ON, identified as parvalbumin-expressing basket cell (PVBC). s.o. – stratum oriens; s.p. – stratum pyramidale; s.r. – stratum radiatum. (B) Immunopositivity for PV. Arrows point out positive boutons. (C) Spiking activity of the cell shown in A. Note the robust firing during RUN and the spiking initiated at the onset of the ripple events. (D) Average firing frequency during resting and running for all recorded PVBCs in these experiments (REST: 9.5 ± 6.8 Hz; RUN: 39.1 ± 18 Hz; paired sample t-test, t=−5.5, p=0.003, n=6). Individual values plus mean ± SD are shown. (E) Partial reconstruction of an in-vivo juxtacellularly recorded and labeled representative theta-OFF, ripple-ON (“TORO”) cell. Inset (below reconstruction): schematic depicting the soma location of all juxtacellularly recorded and labeled CA1 TORO cells. s.l.-m. – stratum lacunosum-moleculare; alv. – alveus. (F) Confocal micrograph showing somatostatin and M2R immunopositivity in the soma and in dendrites, respectively (arrows). (G) Spiking activity of the cell shown in E during RUN and REST periods. Note the low level of activity during RUN, and the bouts of intense spiking initiated shortly before ripples. (H) Average firing frequency during resting and running for all recorded CA1 TORO cells (REST: 11.8 ± 4.8 Hz; RUN: 2 ± 2.5 Hz paired sample t-test, t=6.9, p=0.0004, n=7). Data are presented as on D. (I) Comparison of average spiking frequency outside of and during ripples for CA1 TORO cells vs. PVBCs. (TORO, ripple OUT: 8.9 ± 4.9 Hz, ripple IN: 173.7±26.0 Hz, t=−15.5, p<0.0001; PVBC, ripple OUT: 12.3 ± 7.3 Hz, ripple IN: 103.8 ± 42.1 Hz, paired sample t-test, t=−6.3, p=0.001). While both cell groups increased their firing during ripples, TORO cells reached higher firing frequencies during ripples than PVBCs (Welch’s t-test, t=3.5, p=0.008, n=13). (J) Ripple center-triggered normalized spiking frequency curve of a representative PVBC and a TORO cell. Note the area under the curve (AUC) being larger before the center than after for the TORO cell. (K) Comparison of the pre-ripple index (100-(AUCpost-ripple-center/AUCpre-ripple-center)*100) between CA1 TORO cells and PVBCs (Welch’s t-test, p=0.01). Bars indicate the means.
Figure 2.
Figure 2.. Identification and characterization of hippocampal TORO cells in a publicly available dataset.
(A) Data from the Allen Brain Observatory (Siegle et al., 2021) functional connectivity dataset were analyzed to identify putative TORO units based on firing activity during ripples and locomotor activity. Scatter plot shows firing rate during locomotion and SPW-Rs for TORO (orange) and non-TORO (grey) units. Dashed orange lines indicate cut-offs for TORO cell identification (>50Hz for ripple, <9Hz for locomotion, >15:1 ripple:locomotion firing rate ratio). (B) Firing rate during locomotion for a representative TORO cell located in the CA1 (top left). Top right panel shows average firing rate with respect to speed. Bottom panel shows firing rate changes during periods of locomotion and immobility. (C) Brain areas that contain TORO cells (orange dot and line). Brain regions are color coded by neocortical, thalamic, hippocampal, and midbrain structures. The percentage of cells that are identified as TORO are displayed along with the # of TORO cells out of the total population per brain region. HPF (hippocampal formation) refers to a category that includes cells that were not assigned with high confidence to any subregion within the HPF. The TORO cell in this category was located in the white matter over the subiculum. (D) Left shows histogram of speed vs. firing rate correlation values for TORO (orange) and non-TORO units (t9373=−8.47, p=2.8x10⁻¹⁷). Right panel (shared y-axis) shows TORO cell firing rate vs. speed correlation values for all data vs. when immobility data was withheld (t17=−9.29, p=4.5x10⁻⁸). (E) Correlation values for TORO cell firing rates to ripple amplitude (t17=11.41, p=2.1x10⁻⁹), frequency (t17=8.35, p=4.5x10⁻⁸), and duration (t17=0.73, p=0.47). (F) Scatter plot and histograms for TORO vs. CA1 theta-ON, ripple-ON cells comparing pre-ripple index (shared y-axis; same analysis as Fig. 1K; t102=−4.63, p=1.1x10⁻⁵) and burst index (shared x-axis; t102=−4.42, p=2.5x10⁻⁵). Pre-ripple index was calculated as in Figure 1K. Burst index, a score ranging from −1 to 1 (1 being most bursty), was calculated from interspike intervals (ISI, inset shows mean ISI density).
Figure 3.
Figure 3.. Unique characteristics of TORO cell activity dynamics verified with 2-photon imaging in behaving mice.
(A) Experimental design. (B) Two-photon in vivo calcium imaging trace of a representative TORO cell identified based on the “TORO image” (see text). Vertical magenta bars indicate ripple events detected in the contralateral CA1. (C) Expanded view of the trace on B. (D) Zoomed-in region from an average time projection 2-photon Ca-image from str. oriens (top) and the derived TORO image (bottom), where the average RUN response is shown on a cyan scale, while ripple response is shown on a magenta scale. TORO cells (arrows) were identified based on their low activity during RUN onsets but strong responses to ripple occurrences. (E) Post-hoc confocal maximum intensity projection (MIP) image of the same cells shown on D (top). Cells #1 and #7 express M2R (bottom). (F) Post-hoc confocal MIP image including several GABAergic neurons imaged during the same in vivo experiment as in panel D (note the same cells). The encircled cells are post hoc identified neurons expressing the respective markers. Image has been cropped and rotated to match the orientation of the cells shown on D-E, and the original boundaries of the confocal section are marked with a dashed line. (G) Ripple-triggered average 2-photon calcium traces for individual GABAergic cells. Note that TORO cells #1 and #7 (same as on D-F) have larger ripple responses than any of the other non-TORO GABA cells (orange traces belong to TORO cells, grey traces are from non-TORO GABAergic cells). (H) Comparison of the magnitude of ripple responses between 15 TORO cells and 109 non-TORO cells. TORO cell ripple response amplitude was greater than that of non-TORO cells (median[1st quartile, 3rd quartile]: TORO, 36.3[21.8, 43.9]; non-TORO, 4.1[1.4, 8.5], p <0.0001, n=124 cells from 5 mice, including 4 Dlx5/6-Cre mice (14 TORO cells) and 1 C57BL/6 mouse (1 TORO cell); Z=5.9; Mann-Whitney U test). Each cell was ranked according to their ripple response magnitude within their session (TORO, 100[100, 100]; nonTORO, 46.7[20.5, 70.9], p<0.0001, Z=6.26; Mann-Whitney U test on normalized ranks). (I) All post-hoc identified TORO cells were found to be M2R-positive (n = 15).
Figure 4.
Figure 4.. Preserved ripple-preference of TORO cells during sleep.
(A) Representative images of the pupil of a head-fixed mouse, corresponding to the different behavioral and brain states during 2-photon calcium imaging. (B) Speed plots of locomotion activity of the mouse during running, awake rest, NREM and REM sleep stages. (C) The corresponding pupil diameter measurements. (D) Respective calcium imaging traces from a TORO cell. Black bars indicate ripples. Note the robust ripple-responses during awake rest and NREM sleep, and the lack of activity during running and REM sleep. (E) LFP and electrocorticogram (ECoG) traces taken from the time windows (with respect to panels B-D) illustrated by the grey bars. Note the running- and REM-associated theta, and the presence of ripples during awake rest and NREM sleep. (F) Pupil diameter is unique to each state (Kruskal-Wallis ANOVA completed with Mann-Whitney U test as pairs, X2(3)=25.3, p<0.001, n=4 mice; *p<0.05, **p<0.01 (M-W test)). Box plots show median±interquartile range (IQR), whiskers show range. (G) TORO cell activity is distinct from non-TORO cells in 3 out of 4 states. Boxplots show median±IQR, whiskers show range, circles show individual values. (n=9 TORO and 24 non-TORO cells from 4 mice, Mann-Whitney U test; *p<0.05, **p<0.01). (H) TORO cell activity changes from one state to another. Repeated measures ANOVA with Greenhouse-Geisser correction, F=12.4, p=0.0054; completed with pairwise comparisons with pair-sample t-test; n=11 cells, 6 mice. Note that TORO cell activity is similarly low during RUN and REM (pair-sample t-test; t=1.5, p=0.186 (RUN vs REM). Boxplots show median±IQR, whiskers show range, circles show individual values. (*p<0.05, **p<0.01) (I) Ripple-triggered average 2-photon calcium traces for awake rest vs. NREM states do not differ significantly in TORO cells (t=0.7, p=0.48, pair sample t-test on ripple-response magnitudes, n=11 cells, 6 mice), indicating that TORO cells robustly increase their ripple-related activity during both awake and sleep states. MeanáSEM is shown.
Figure 5.
Figure 5.. TORO cells are strongly entrained by CA3 activation in vivo.
(A) Experimental design for driving CA3 inputs optogenetically (strategy 1; n=4 mice, strategy 2; n=2 mice). (B) TORO image (RUN- and Ripple responses were overlaid) of a representative calcium movie taken from CA1 oriens. Cells #1&2 are TORO cells. (C) While all cells shown on (B) responded positively to optogenetic activation of CA3-originating fibers, TORO cells #1&2 (orange traces) had more robust response than the rest of the cells (grey traces). Stimulation: 15ms light pulses at 15.6 Hz for the duration of 5 imaging frames or approximately 320ms. Note that the strongest ripple response (arrow) was also produced by the TORO cells. (D) Average light-triggered response in all TORO cells vs. non-TORO cells (n=26 TORO cells from 4 mice, left) and the lack of response in mCherry controls (right, TORO cells shown, n=24 cells from 2 mice). TORO cells showed positive calcium responses upon light delivery compared to no-opsin controls (by 35±16% DF/F, X2(1)=5, p=0.028, likelihood ratio test, n=50 cells, 6 mice) and TORO cells had more robust light-response than non-TORO cells: see for example cells #1&2 on Figure 5B-C (effect size r=0.79, p=0.007, sign test, n=21 cells, 4 mice). Data are shown as mean±SEM.
Figure 6.
Figure 6.. Septal GABAergic inhibition suppresses TORO cells during running.
(A) Labeling strategy for visualizing septal GABAergic fibers in the CA1. (B) Confocal MIP images showing M2R-positive somata and dendrites contacted by septal GABAergic inputs. (C) Quantification of septal GABAergic contacts. Box plot shows median±IQR, whiskers show range, circles show mean values for each animal; red dots are individual values for M2R cells. (D) Labeling strategy for 2P imaging of septal GABAergic axon terminals while simultaneously imaging TORO cells. (E) Representative example of simultaneous 2P imaging from a TORO cell (jRGECO, violet; defined based on TORO image, panels F-H) and from the GABAergic axons originating from the medial septum (Axon-GCaMP6s, green; yellow arrows). (F) Ripple-triggered calcium response calculated from the jRGECO signal (4 post-ripple frames/10 pre-ripple frames), intensity is shown on a magenta scale. Note that this procedure also visualizes the otherwise faint dendritic segments of the TORO cell. (G) RUN-triggered calcium response calculated on the Axon-GCaMP6s signal (RUN frames/no-RUN frames), intensity is shown on a cyan scale. (H) Overlay of the two responses shown on panels (F) and (G). Note the septal GABAergic axons located in close juxtaposition to the TORO cell soma and dendrites. (I) 2P calcium trace from the TORO cell and the surrounding septal axons shown on panel (H). Vertical black bars indicate ripples. Note the axonal activation during running. (J) Run-triggered average for all TORO cells (violet) and the surrounding septal axons (green). Axon terminals surrounding TORO cells are primarily active during running (median[1st quartile, 3rd quartile]: pre-RUN: 5.0[0.1, 48.4] DF/F%, RUN: 176.1[142.5, 298.7] DF/F%, n=11 cells, 3 mice, p=0.0039, W=0, Wilcoxon signed ranks test). Data are shown as mean±SEM. See also Figure S5. (K) Labeling strategy for driving septal GABAergic inputs optogenetically while imaging TORO cells in the CA1. (L) Example 2P imaging trace from a TORO cell suppressed by blue light. Note the lack of ripple responses when the light is delivered to the CA1. Stimulation pattern: 15ms pulses at 15.6 Hz for 220 frames (or approximately 14 sec). (M) Summary plots of ChR2 (n=58 cells from 5 mice) and control (mCherry, n=20 cells from 2 mice) experiments. Blue light significantly reduced the magnitude of ripple responses in ChR2 expressing mice compared to no-opsin and no-light controls (by −5.9±2.1% DF/F, X2(1)=8, p=0.0006, likelihood ratio test, n=78 cells, 7 mice). Box plots show median±IQR, whiskers show range, square markers show mean.
Figure 7.
Figure 7.. TORO cells substantially contribute to extra-hippocampal GABAergic projections from the CA1.
(A) Firing characteristics of a representative tdTChrm2 cell in response to depolarizing (150, 300, 500, 800 pA) and hyperpolarizing (−100 pA) current steps. (B) Intrinsic properties of in vitro recorded tdTChrm2-cells. Box plots show median±interquartile range (IQR), whiskers show range, blue dots are individual values per cell (n=40 from 8 mice). Adaptation ratio initially increased with current injection levels then decreased with more depolarized levels due to the smaller change of 1st ISI at higher frequencies (green trace). (C) 2P image of the tdTChrm2 signal is shown from in vivo 2P calcium imaging experiments (C-E) carried out in a Chrm2-tdT-D mouse brain previously injected with an AAV to express GCaMP6f in neurons. Asterisk in panel C points out a tdTChrm2 cell, arrowheads indicate its dendrites. See also FigS6 H-I. (D) GCaMP signal (average intensity across time) from the same imaging plane as on (C). (E) TORO image of the GCaMP image from (D). The tdTChrm2 cell labeled with an asterisk in panels (C) and (D) is a TORO cell. See also Figures S6H-I for more examples. (F) Labeling strategy for visualizing GABAergic cells used in the experiments illustrated in panels H-M (note that in order to avoid labeling cells in the cortex, brain tissue overlying the hippocampus was removed and a cannula window was fitted in place). (G) Example confocal micrograph of a brain section including the hippocampus, part of the neighboring subiculum (SUB) and part of the retrosplenial cortex (RSC). Most GCaMP-expressing cell bodies were located in str. oriens, pyramidale and radiatum, and to a lesser extent at the CA1 radiatum-LM border in low numbers (arrowheads). (H) High magnification MIP image from the SUB area indicated by a square in (G). Arrowheads and arrow point out tdTChrm2 positive and negative CA1-originating GABAergic axon terminals, respectively (same for (I) and (K)) (I) High magnification MIP image of the RSC area indicated by a rectangle in (G). (J) Example confocal micrograph of a brain section including the lateral entorhinal cortex (EC lat.). (K) High magnification MIP image from the EC lat. are indicated by a square in (J). (L) Density of tdTChrm2 and GCaMP (i.e. CA1-originating) co-expressing boutons in six remote target regions (one-way ANOVA with Bonferroni correction, p<0.0001, F=11.4, n=5 mice). Data are presented as mean±SD. (M) tdTChrm2-expressing fraction of the CA1-originating GABAergic axon terminals (p=0.022, F=3.29, one-way ANOVA with Bonferroni correction, n=5 mice). Data are presented as mean±SD.
Figure 8.
Figure 8.. TORO cells preferentially innervate interneurons.
(A) Confocal MIP image of a representative CA1 oriens PV interneuron being contacted by several tdTChrm2 terminals (arrows), including virally labeled (i.e., originating from local cells) boutons from the CA1 (arrowheads). Note that PV expressing boutons were excluded from the analysis shown on panel C. (B) Confocal MIP image of a representative CCK interneuron at the CA1 radiatum-LM border surrounded by several virally labeled tdTChrm2 boutons (arrowheads). Arrow points out an unlabeled (i.e., GCaMP6f-negative) tdTChrm2 bouton. Note that tdTChrm2 boutons are negative for PV at the radiatum-LM border. (C) Quantification of tdTChrm2 expressing, PV negative boutons on PV and CCK cell bodies. PV negativity of the presynaptic tdTChrm2 axons was confirmed for all postsynaptic PV cells and for CCK cells where PV containing was available (40/56 CCK cells, see Methods). PV cell bodies were mostly located in the oriens and pyramidal cell layers where several of them received axon terminals from tdTChrm2-cells (median[1st quartile, 3rd quartile]: ORI: 2[0, 4], PYR:1[0, 3] boutons/cell body, n=80 cells, 7 mice). Within the CCK cell group, the average bouton number was not uniform across layers, with the highest bouton number per cell found in the oriens and radiatum-LM border (Kruskal-Wallis ANOVA completed with Mann-Whitney U test as pairs; X2(3)=10.9, p=0.012; (ORI: 3[2, 4], PYR: 0.5[0, 2], RAD: 1[0, 3], Radiatum-LM border: 3[2, 5] boutons/soma, n=56 cells, 6 mice). Box plots show median±IQR, whiskers show range, vertical ticks show individual values. (*p<0.05, **p<0.01, M-W test). (D) Experimental design for paired recording of tdTChrm2 cells and pyramidal cells (PCs) or interneurons (INs). (E) Connection probability obtained by paired recordings. (F) Representative traces obtained from a synaptically connected tdTChrm2 cell – IN pair. Note the robust increase in IPSCs throughout the train of presynaptic APs. The IN is the axo-axonic cell (AAC) illustrated on panel H. (G) Representative traces obtained from the single synaptically connected tdTChrm2 cell-PC pair. Asterisks indicate successful uIPSCs which are smaller and fewer compared to the uIPSCs in the pair shown on F. See also Figure S7 D-F. (H) 2D reconstruction of the cell pair shown on F. Black: tdTChrm2 cell dendrite, orange: axon; olive: AAC dendrite, green: axon. Arrows point out synaptic contacts. (I) Biocytin-labeled AAC axons target axon initial segments visualized by anti-p-IκBα. Arrows point out juxtapositions. (J) PV immunopositivity of the postsynaptic AAC. (K) Ten superimposed uIPSCs (thin grey lines) evoked by single presynaptic APs (orange) in the tdTChrm2 cell – AAC pair. The averaged uIPSC trace is shown in olive. (L) Properties of uIPSCs obtained from the 4 tdTChrm2 cell – IN pairs. Note that properties were obtained from the responses followed by the 1st AP of the train. Peak amplitude: mean peak amplitude of uIPSC including failures; synaptic potency: mean peak amplitude excluding failures. (Note that similar metrics could not be obtained from the tdTChrm2 cell – PC pair because all of the first responses in the train were failures (100% failure probability – magenta); see also Figure S7E-F). Mean±SEM is shown. (M) Representative trace showing that tdTChrm2 cells are able to evoke uIPSCs in IN-s even when being driven at 200Hz.

Comment in

References

    1. Amaral DG, and Witter MP (1989). The three-dimensional organization of the hippocampal formation: A review of anatomical data. Neuroscience 31, 571–591. - PubMed
    1. Araujo DM, Lapchak PA, Regenold W, and Quirion R (1989). Characterization of [3H]AF-DX 116 binding sites in the rat brain: Evidence for heterogeneity of muscarinic-M2 receptor sites. Synapse 4, 106–114. - PubMed
    1. Berens P (2009). CircStat : A MATLAB Toolbox for Circular Statistics. J. Stat. Softw 31, 10.18637/jss.v031.i10. - DOI
    1. Bocchio M, Gouny C, Angulo-Garcia D, Toulat T, Tressard T, Quiroli E, Baude A, and Cossart R (2020). Hippocampal hub neurons maintain distinct connectivity throughout their lifetime. Nat. Commun 11, 4559. - PMC - PubMed
    1. Böhm C, Peng Y, Maier N, Winterer J, Poulet JFA, Geiger JRP, and Schmitz D (2015). Functional diversity of subicular principal cells during hippocampal ripples. J. Neurosci 35, 13608–13618. - PMC - PubMed

Publication types

LinkOut - more resources