. 2022 May 12;185(10):1676-1693.e23.
doi: 10.1016/j.cell.2022.04.005. Epub 2022 Apr 29.

Cannabinoid receptor 1 antagonist genistein attenuates marijuana-induced vascular inflammation

Affiliations

Cannabinoid receptor 1 antagonist genistein attenuates marijuana-induced vascular inflammation

Tzu-Tang Wei et al. Cell. .

Erratum in

Abstract

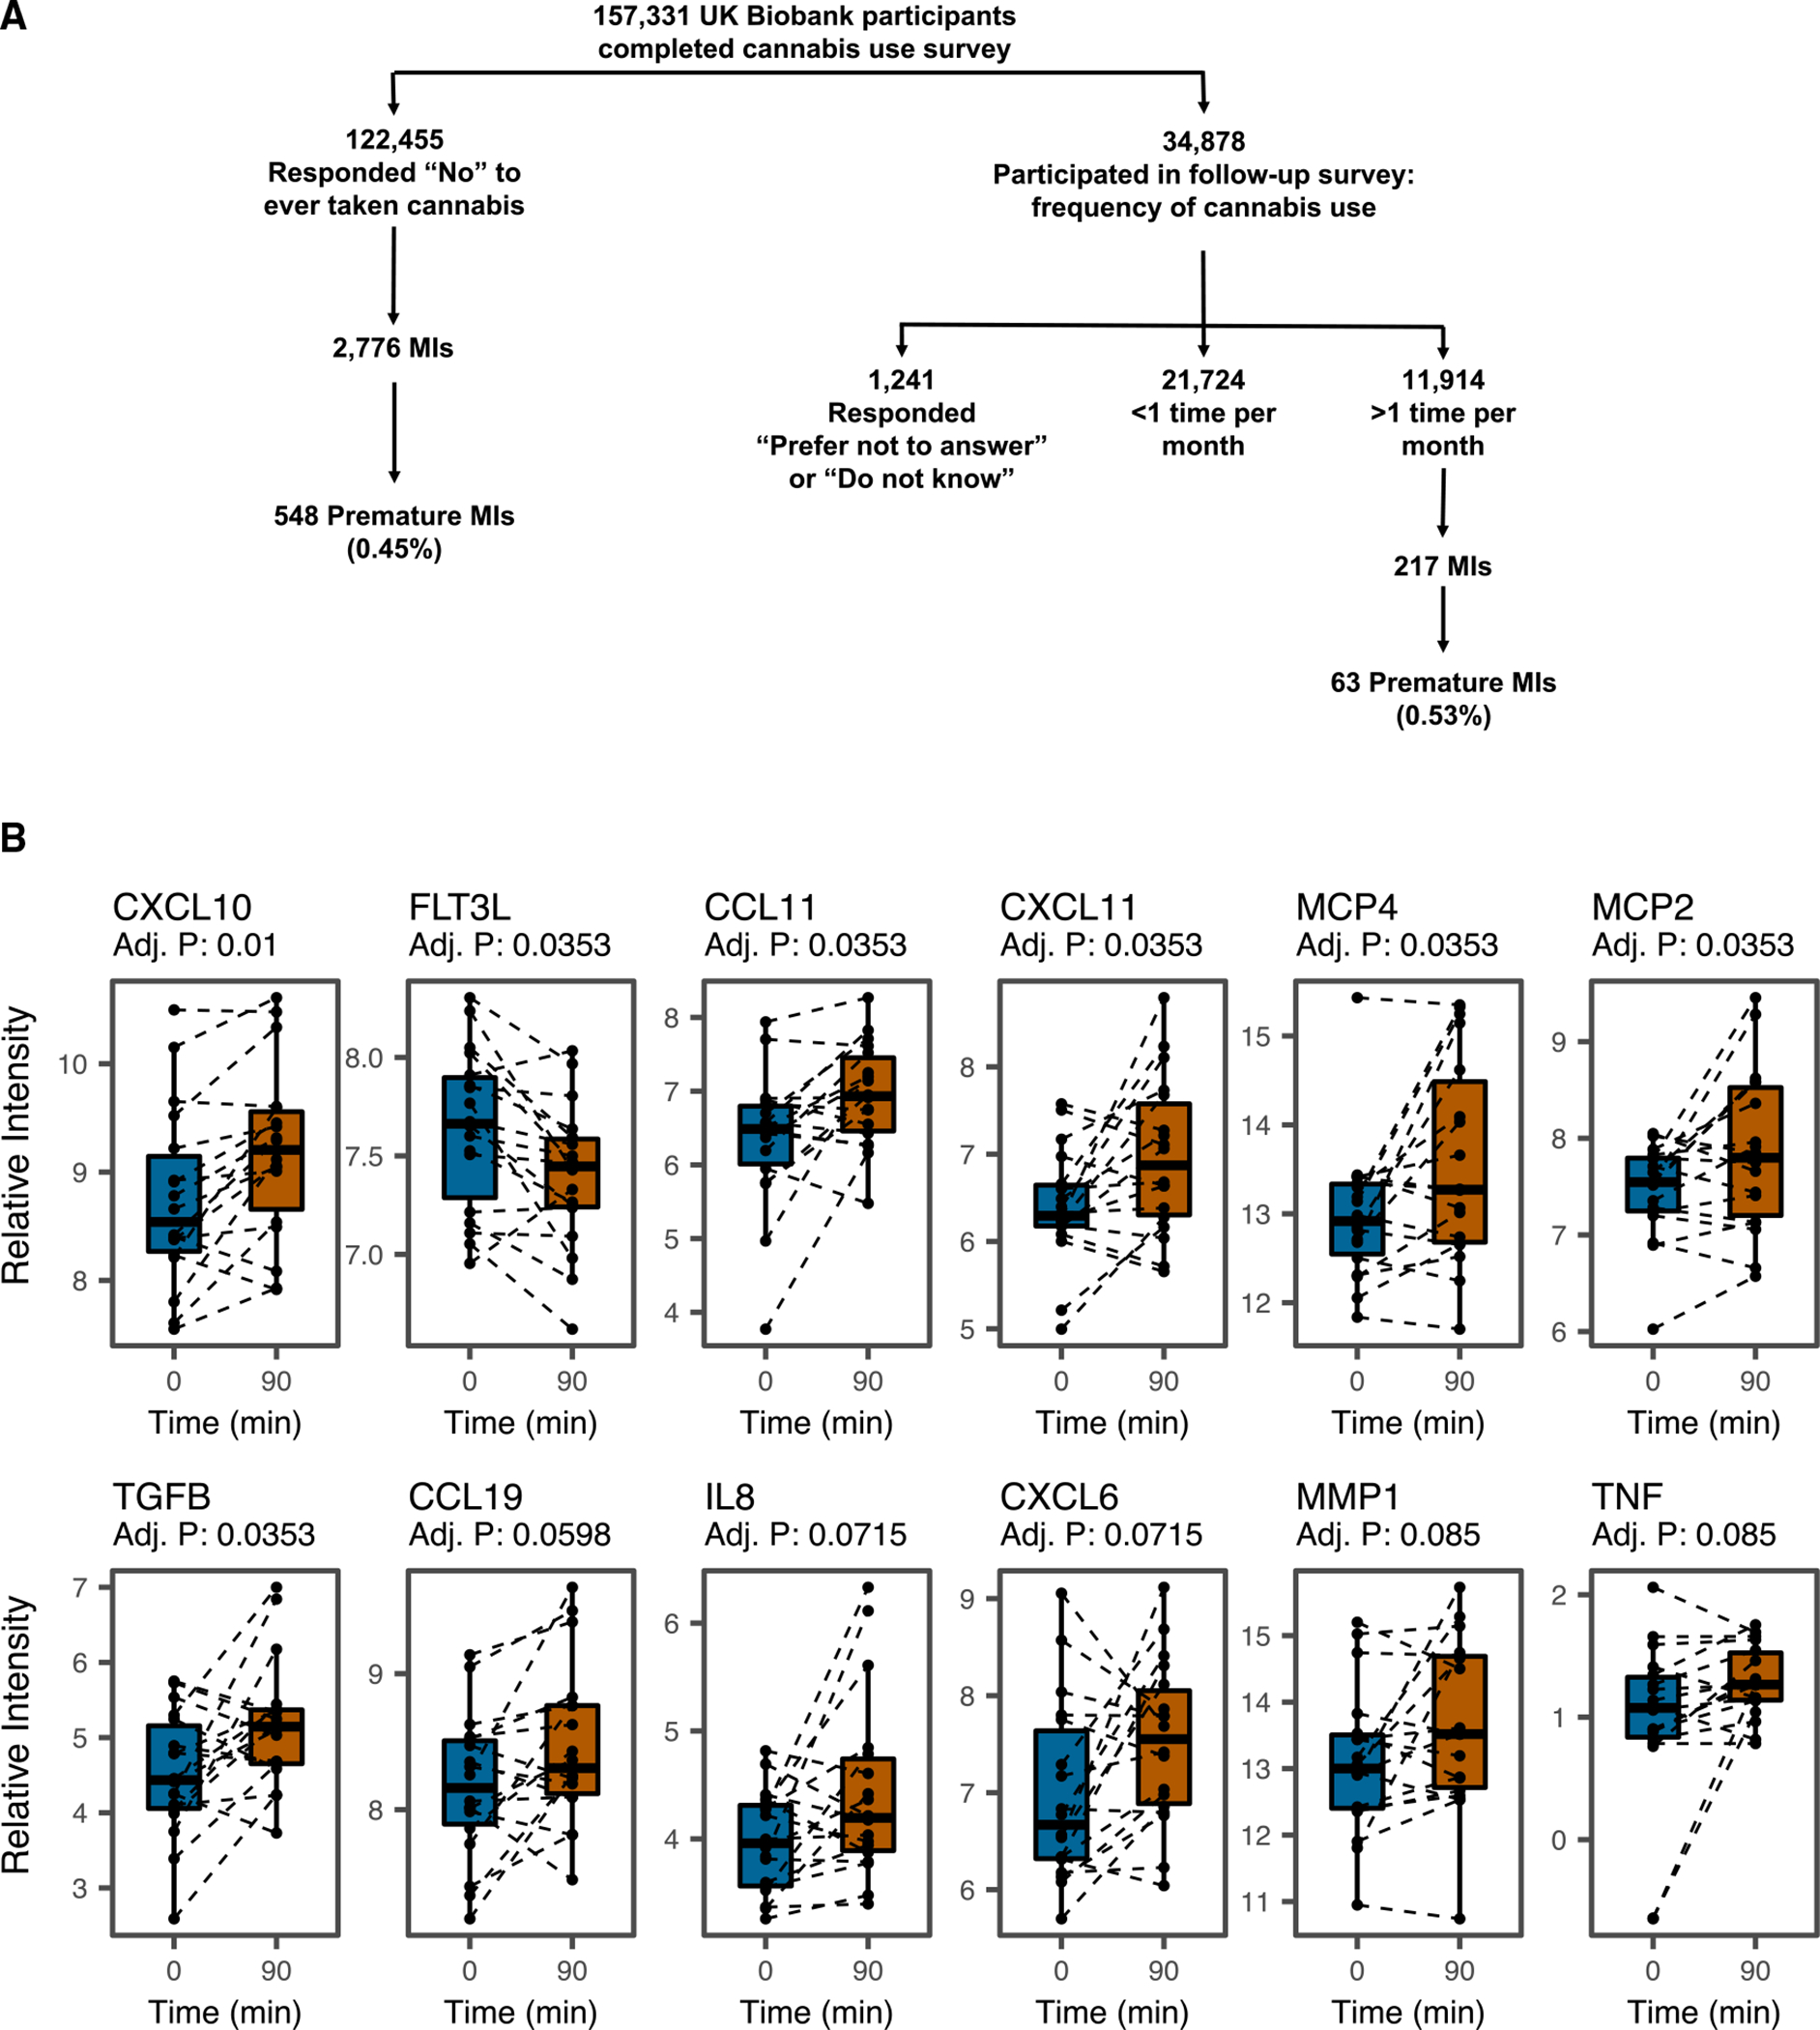
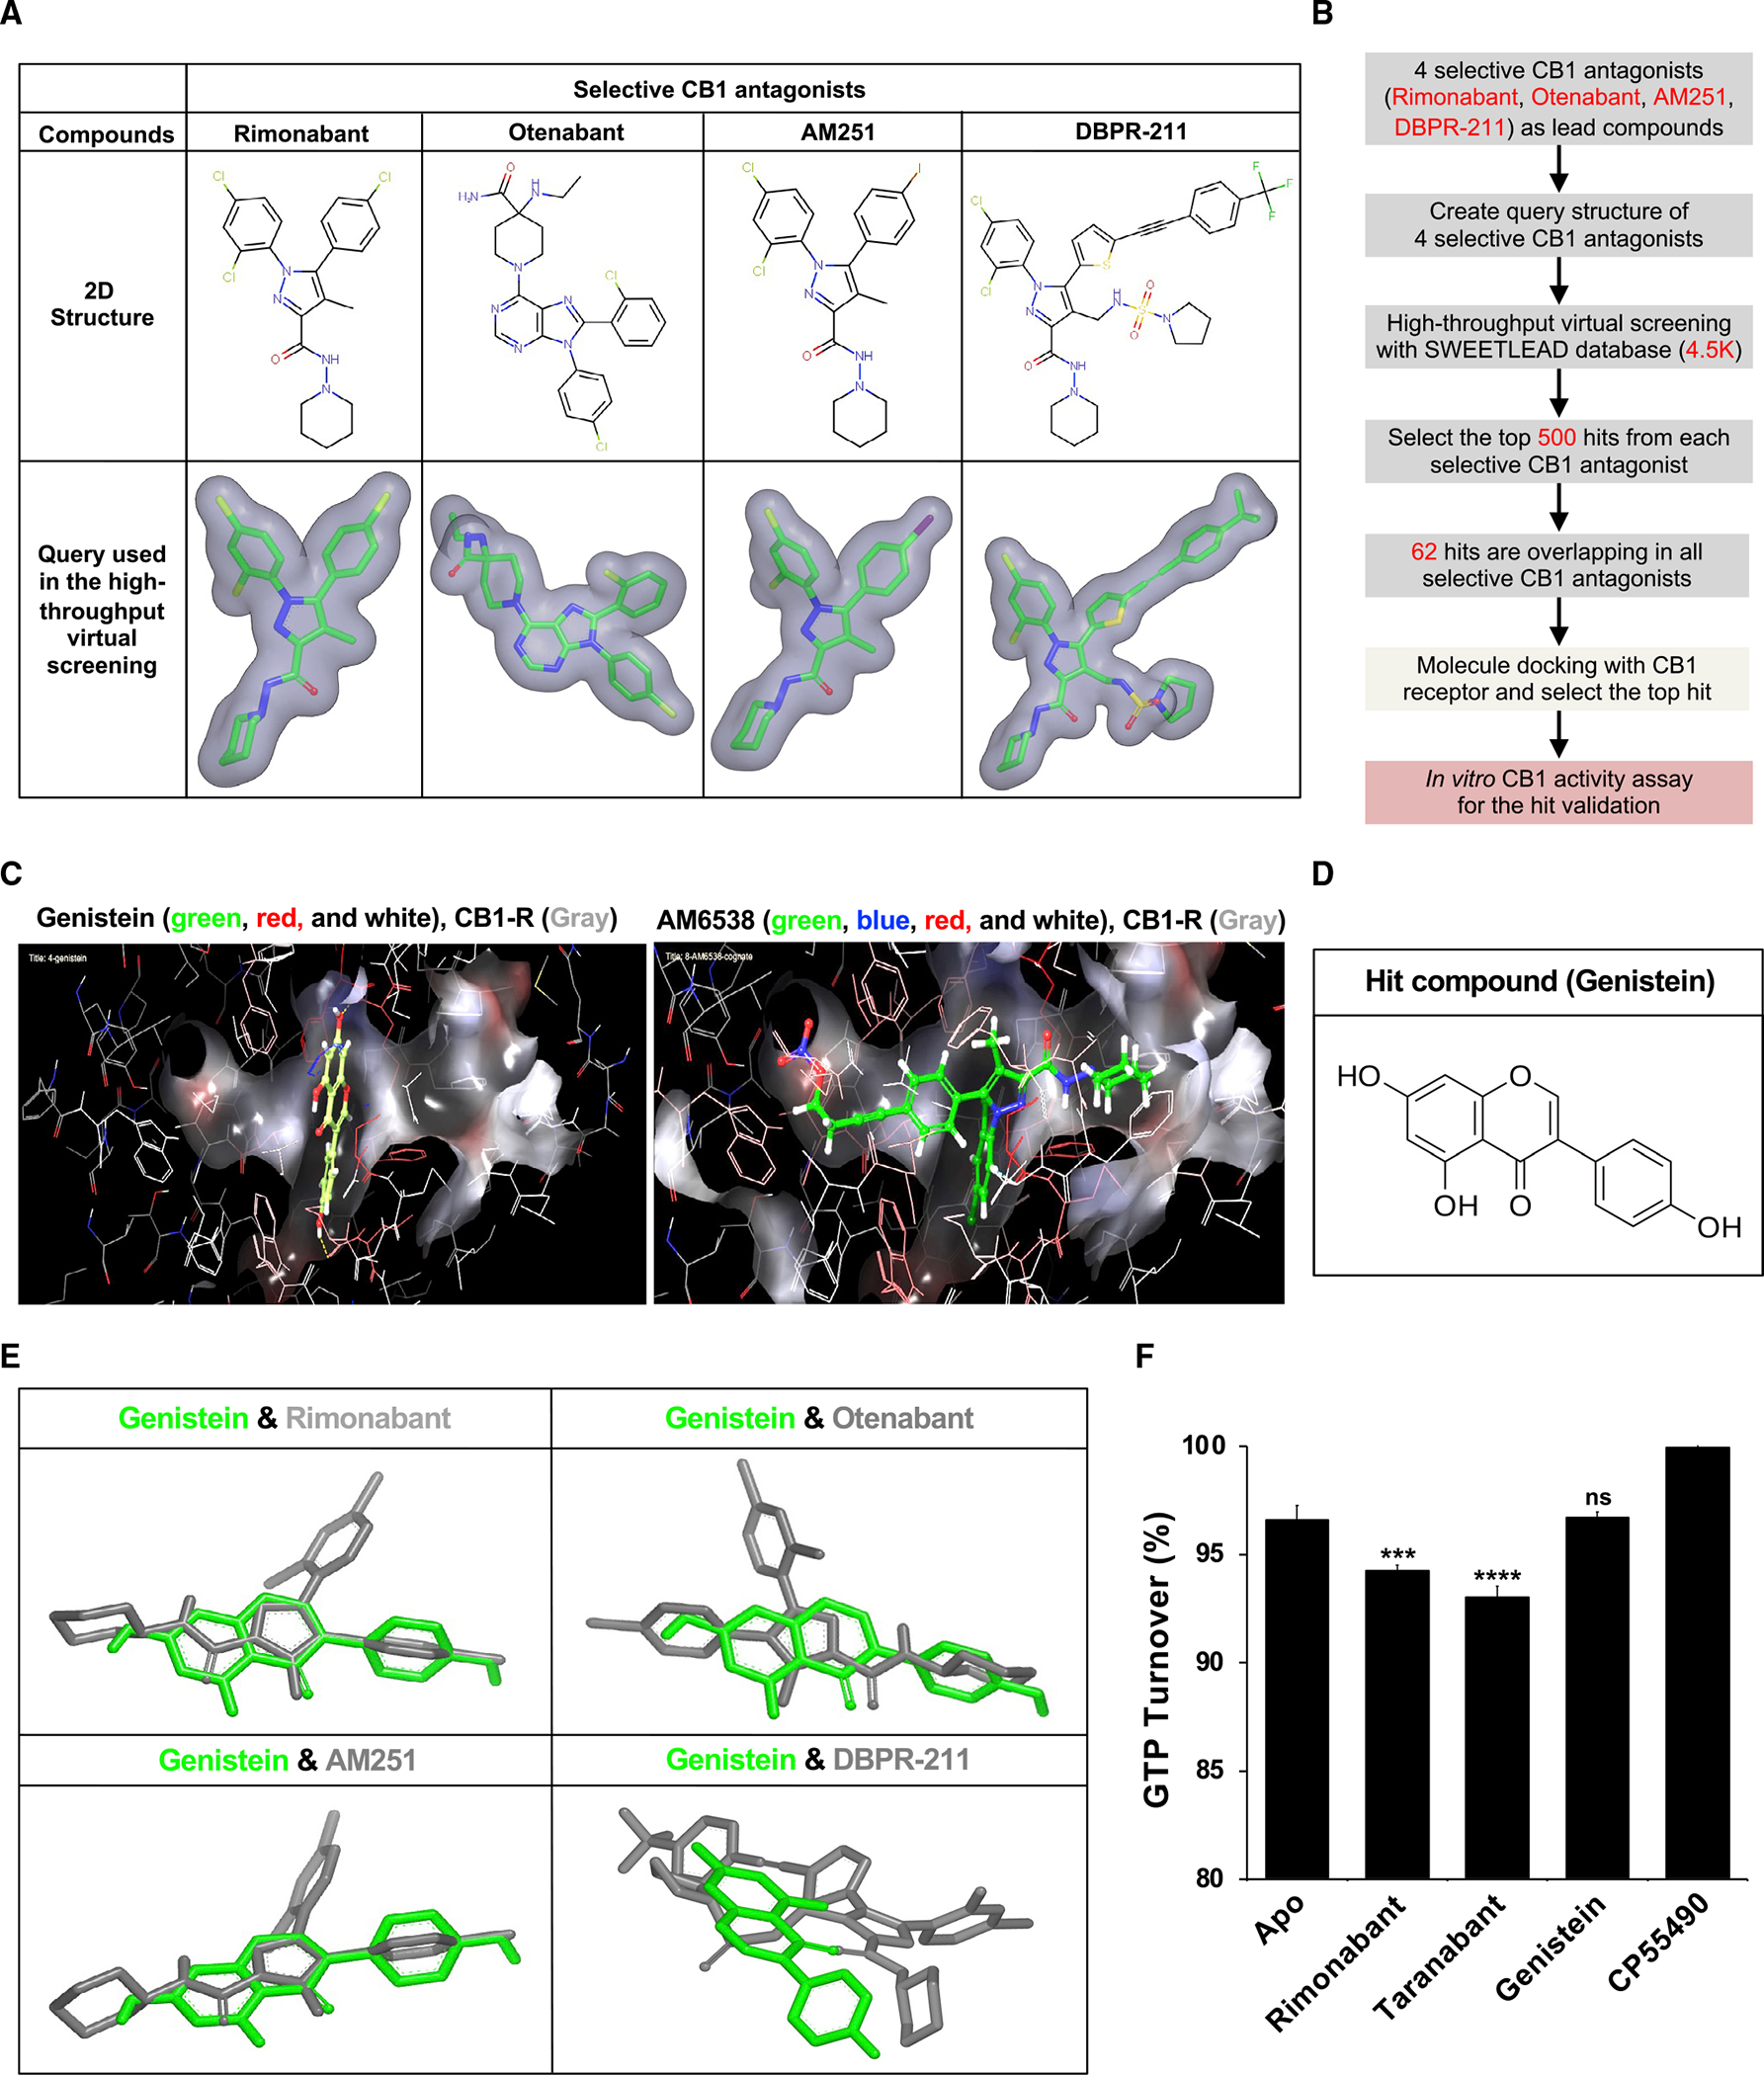
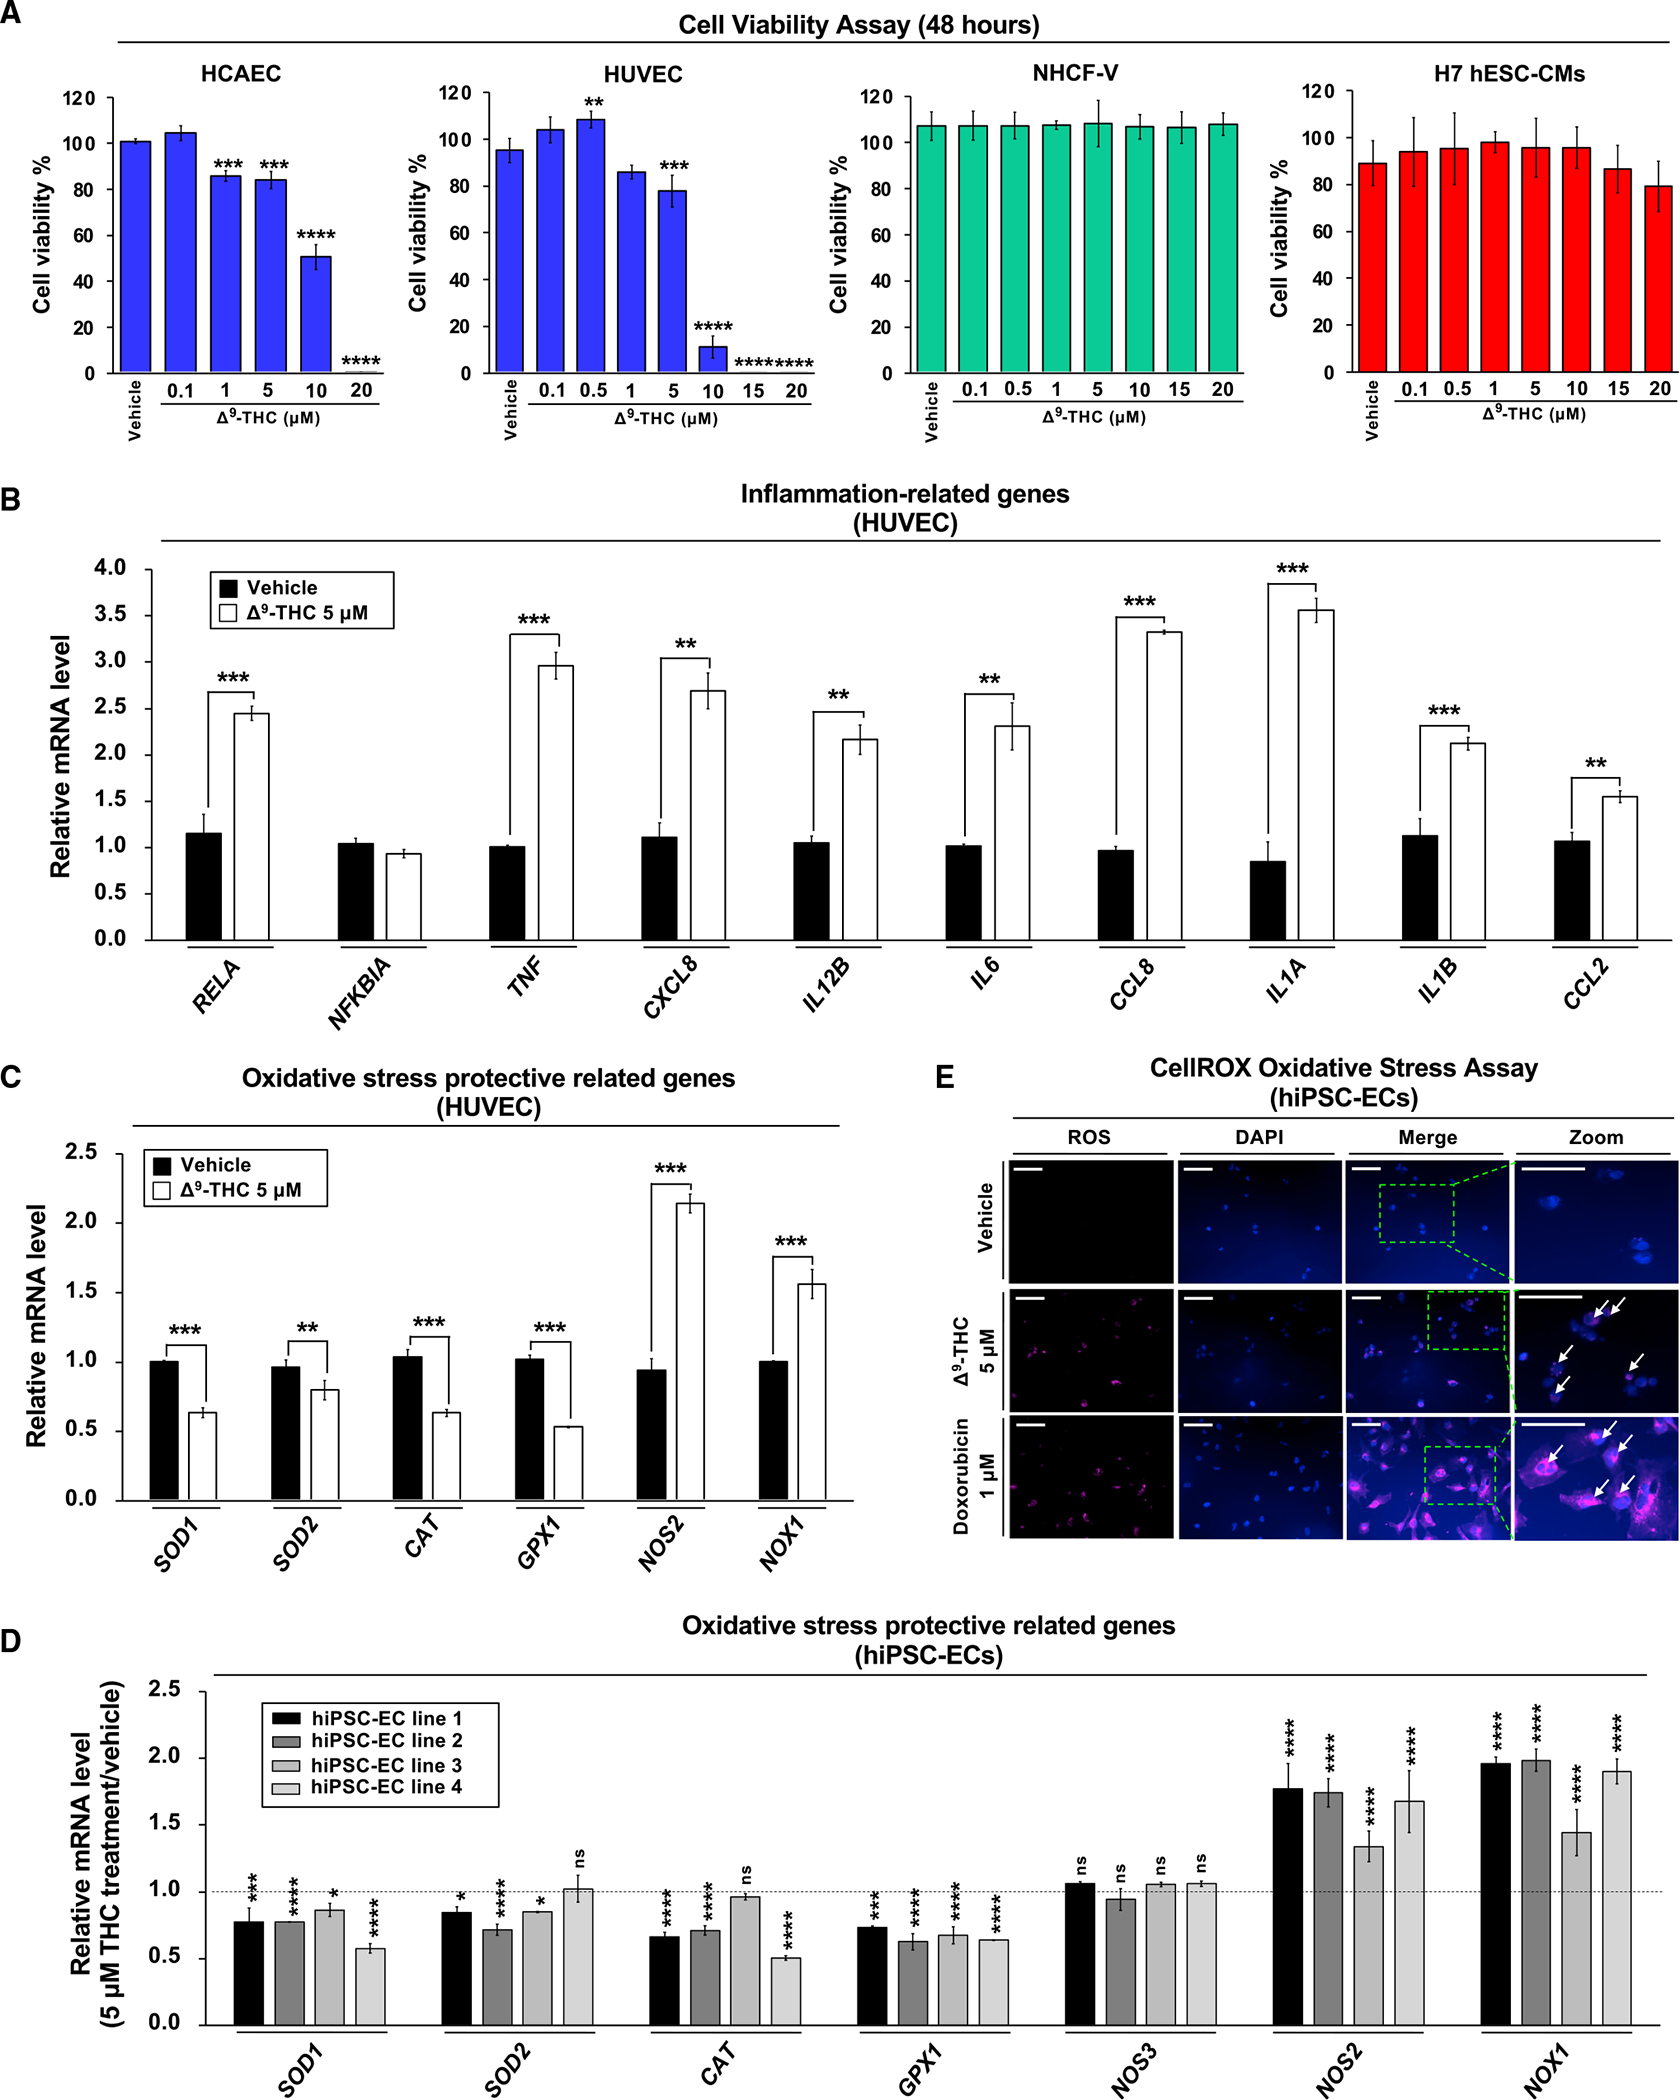
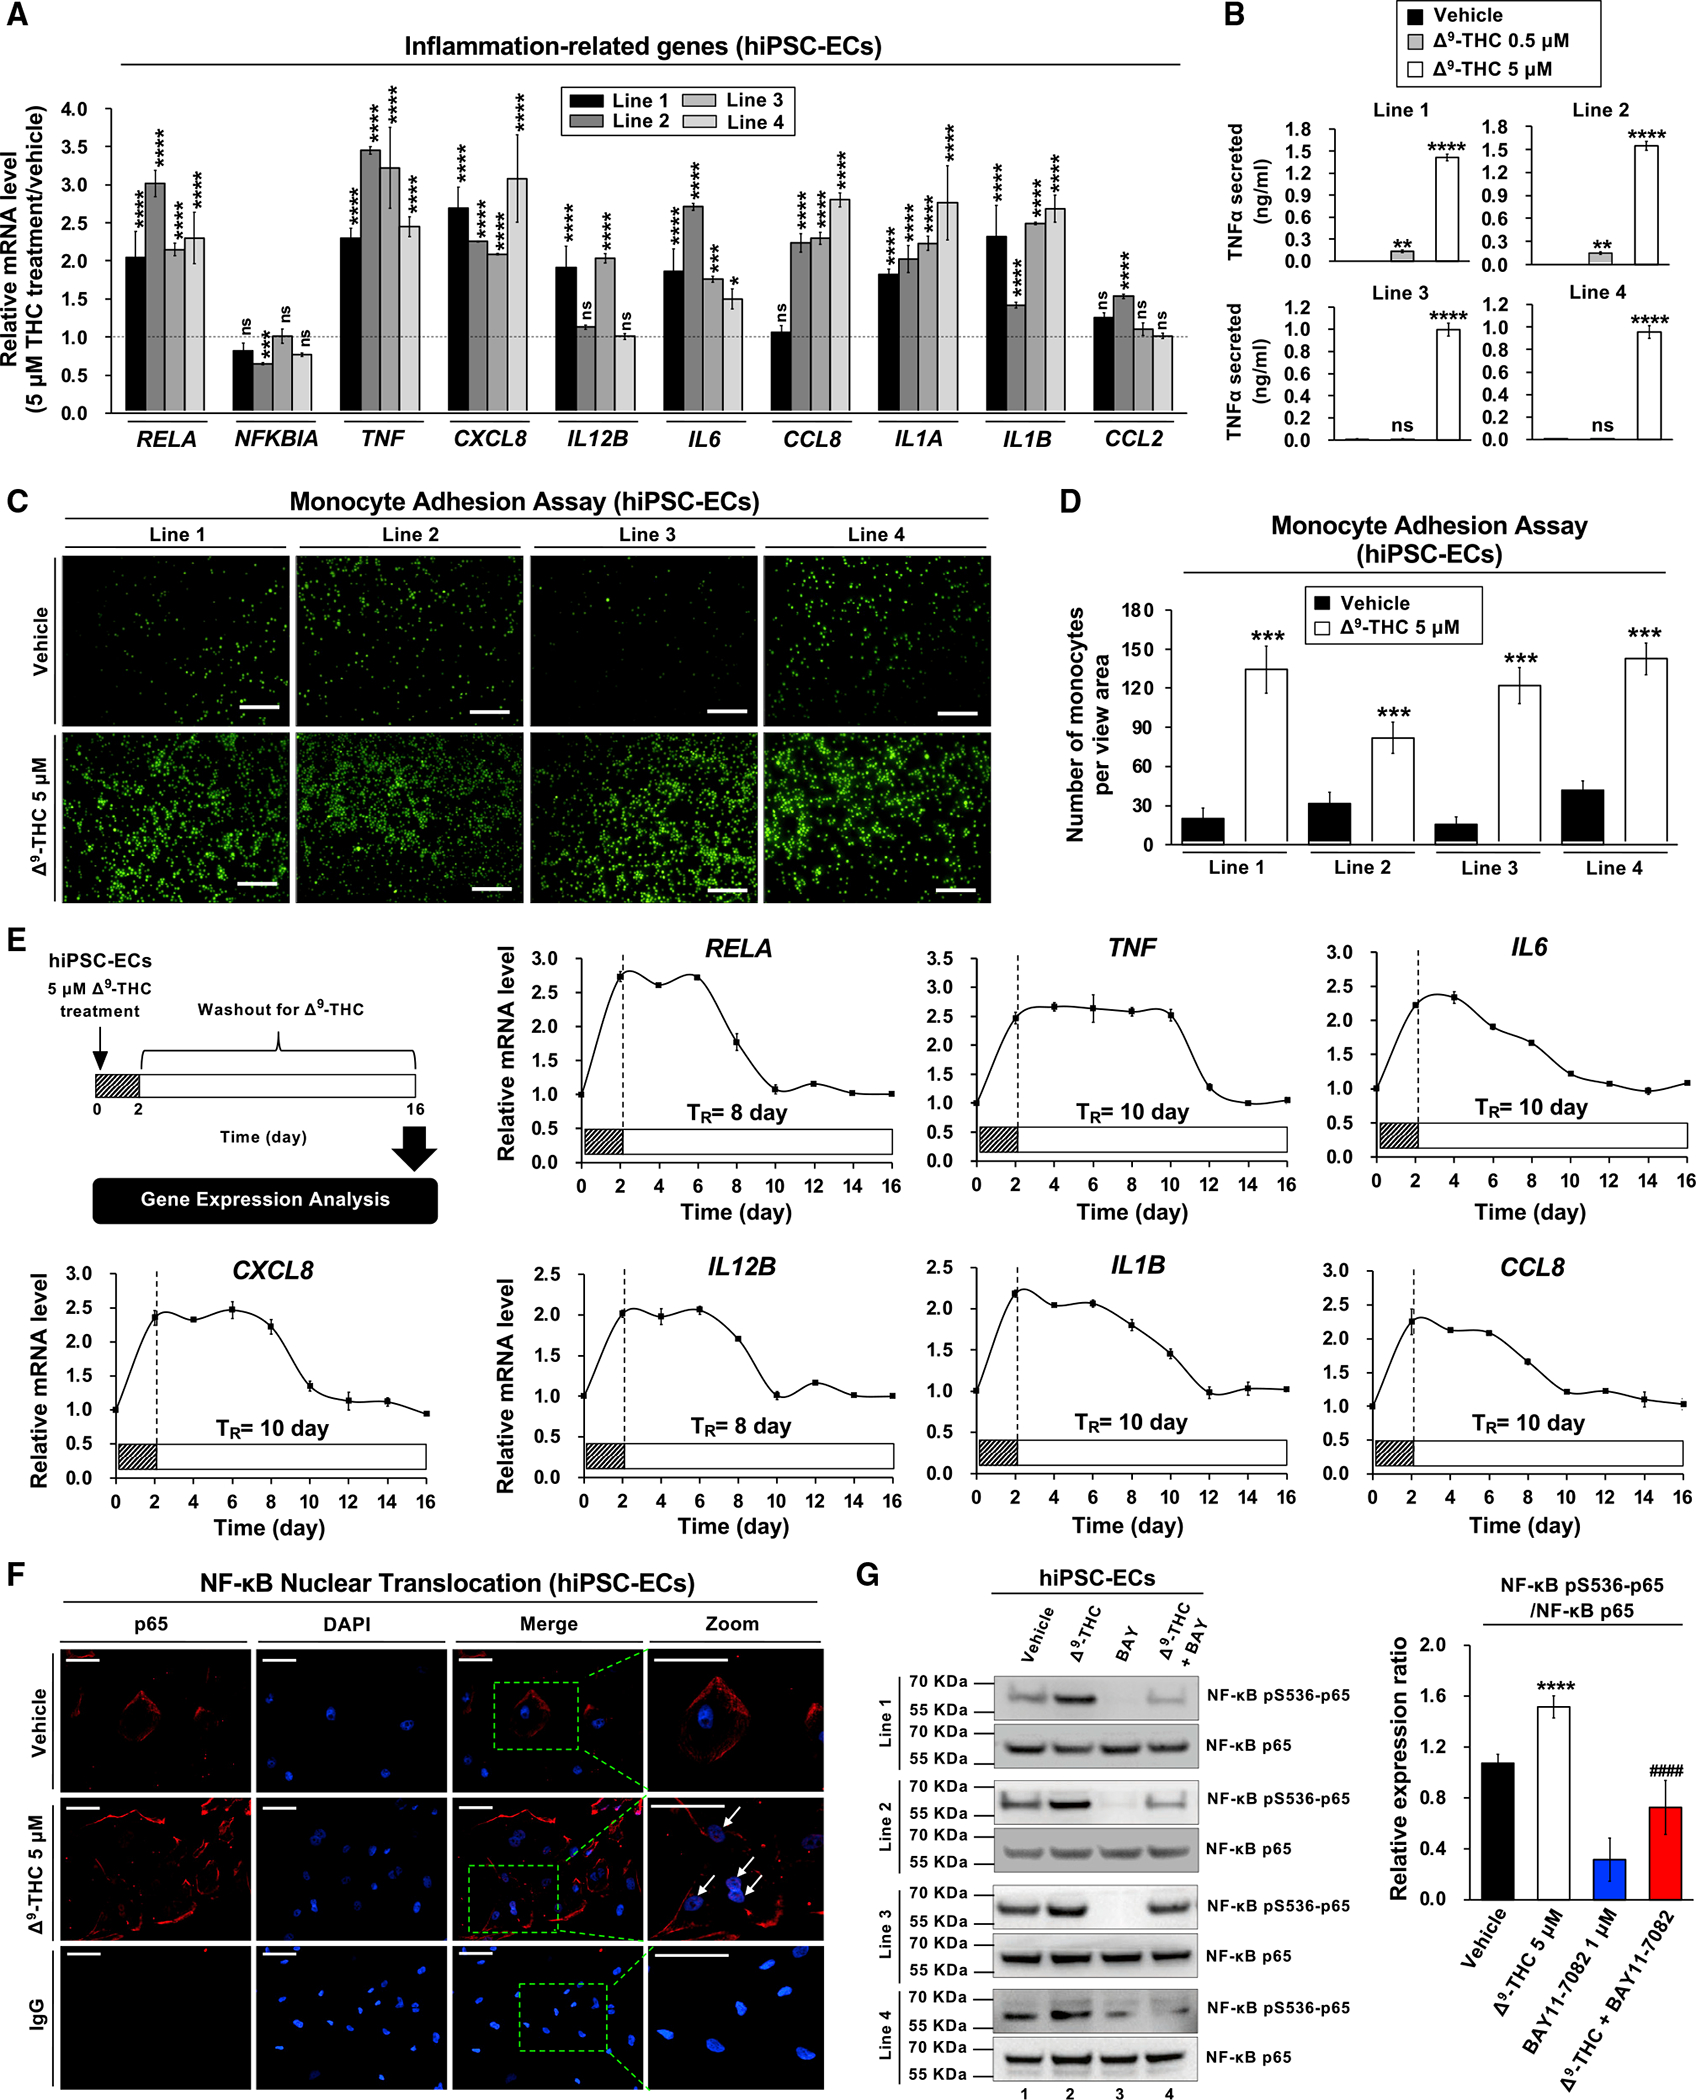
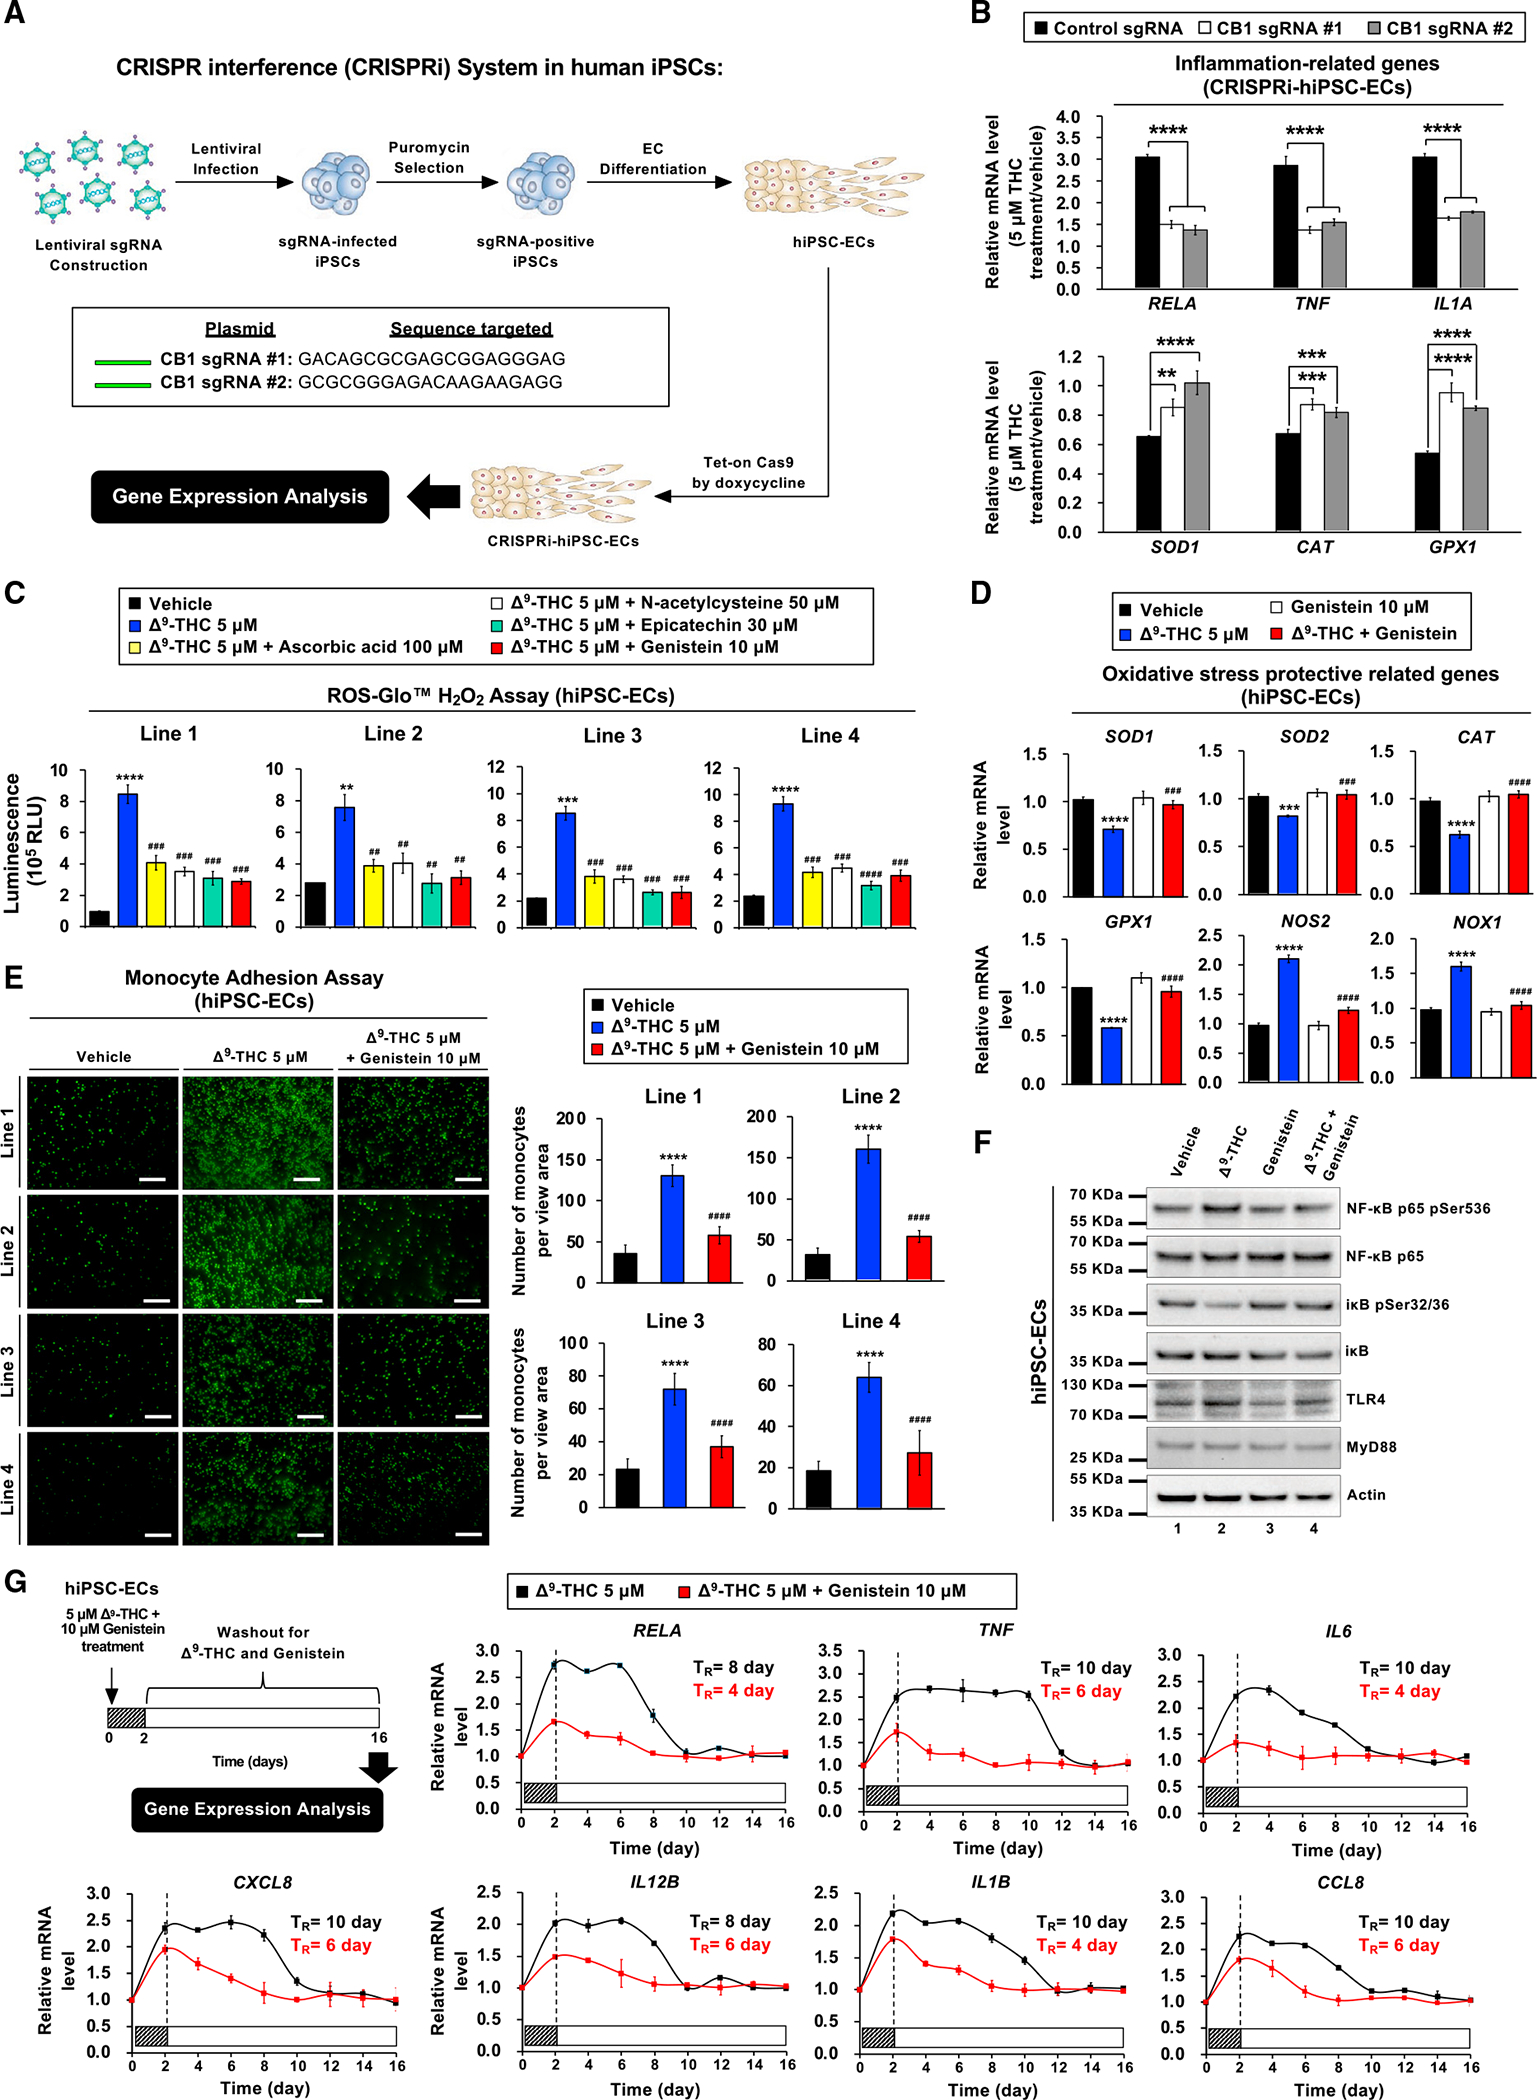
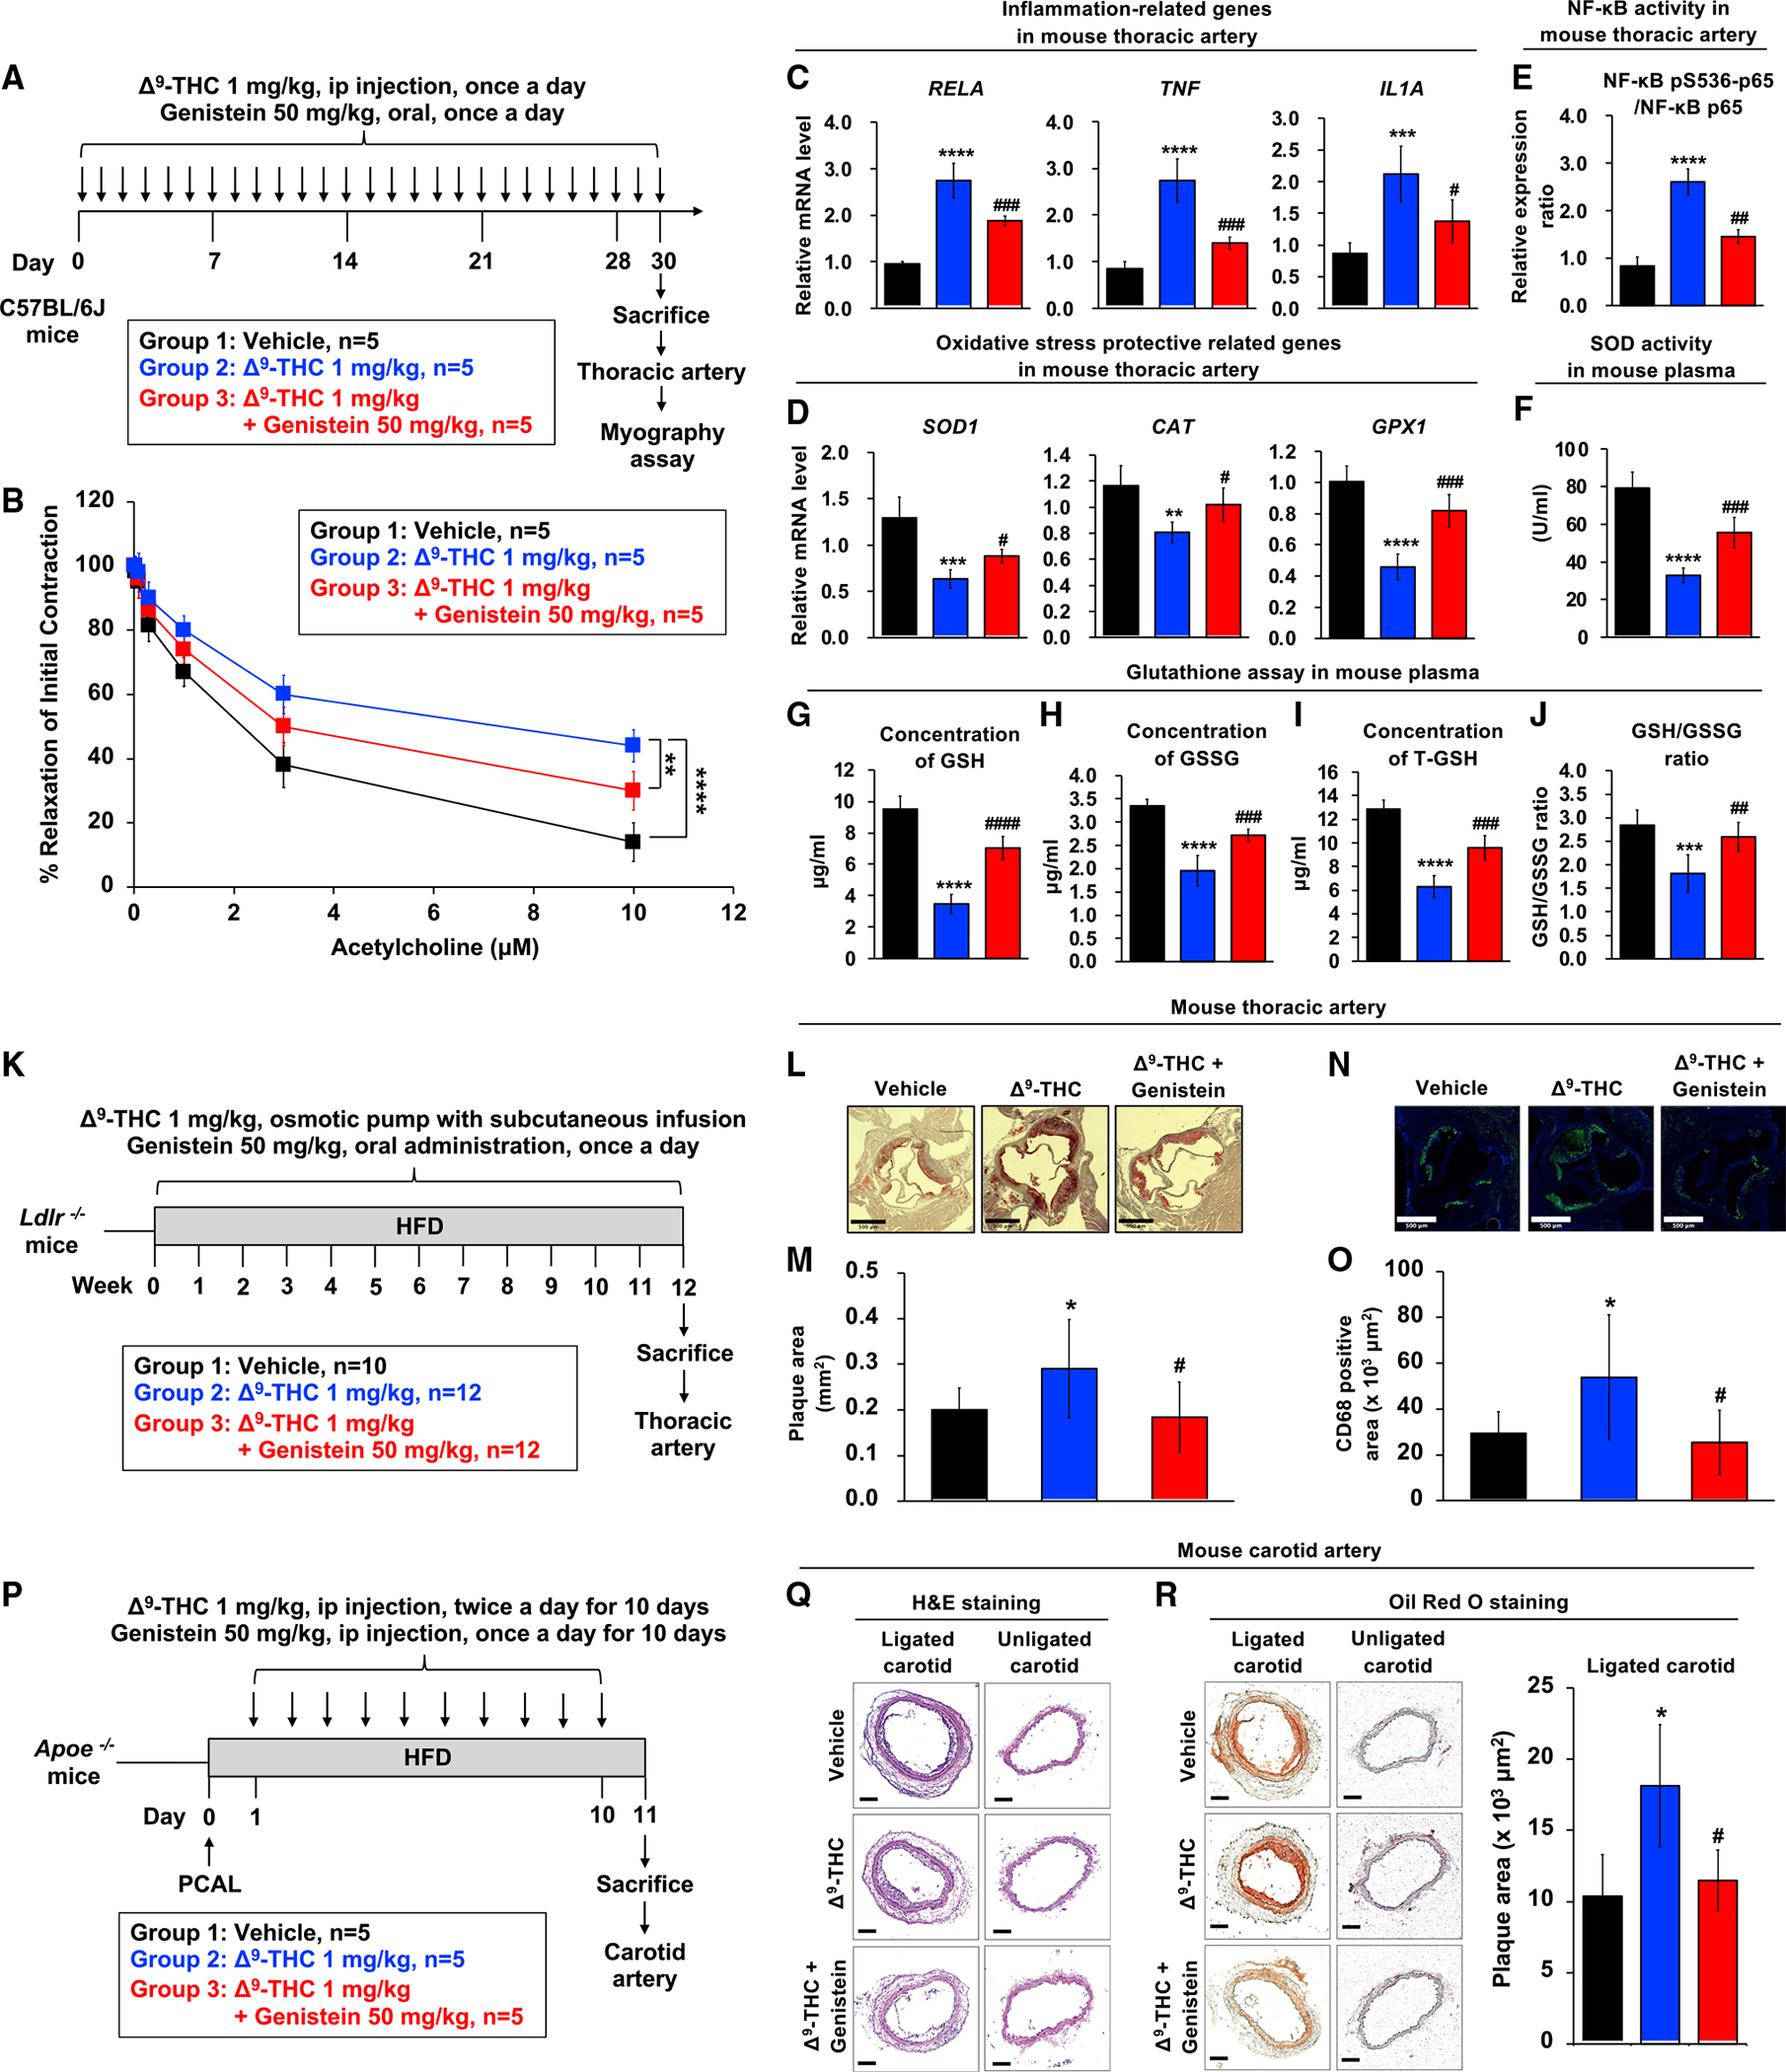
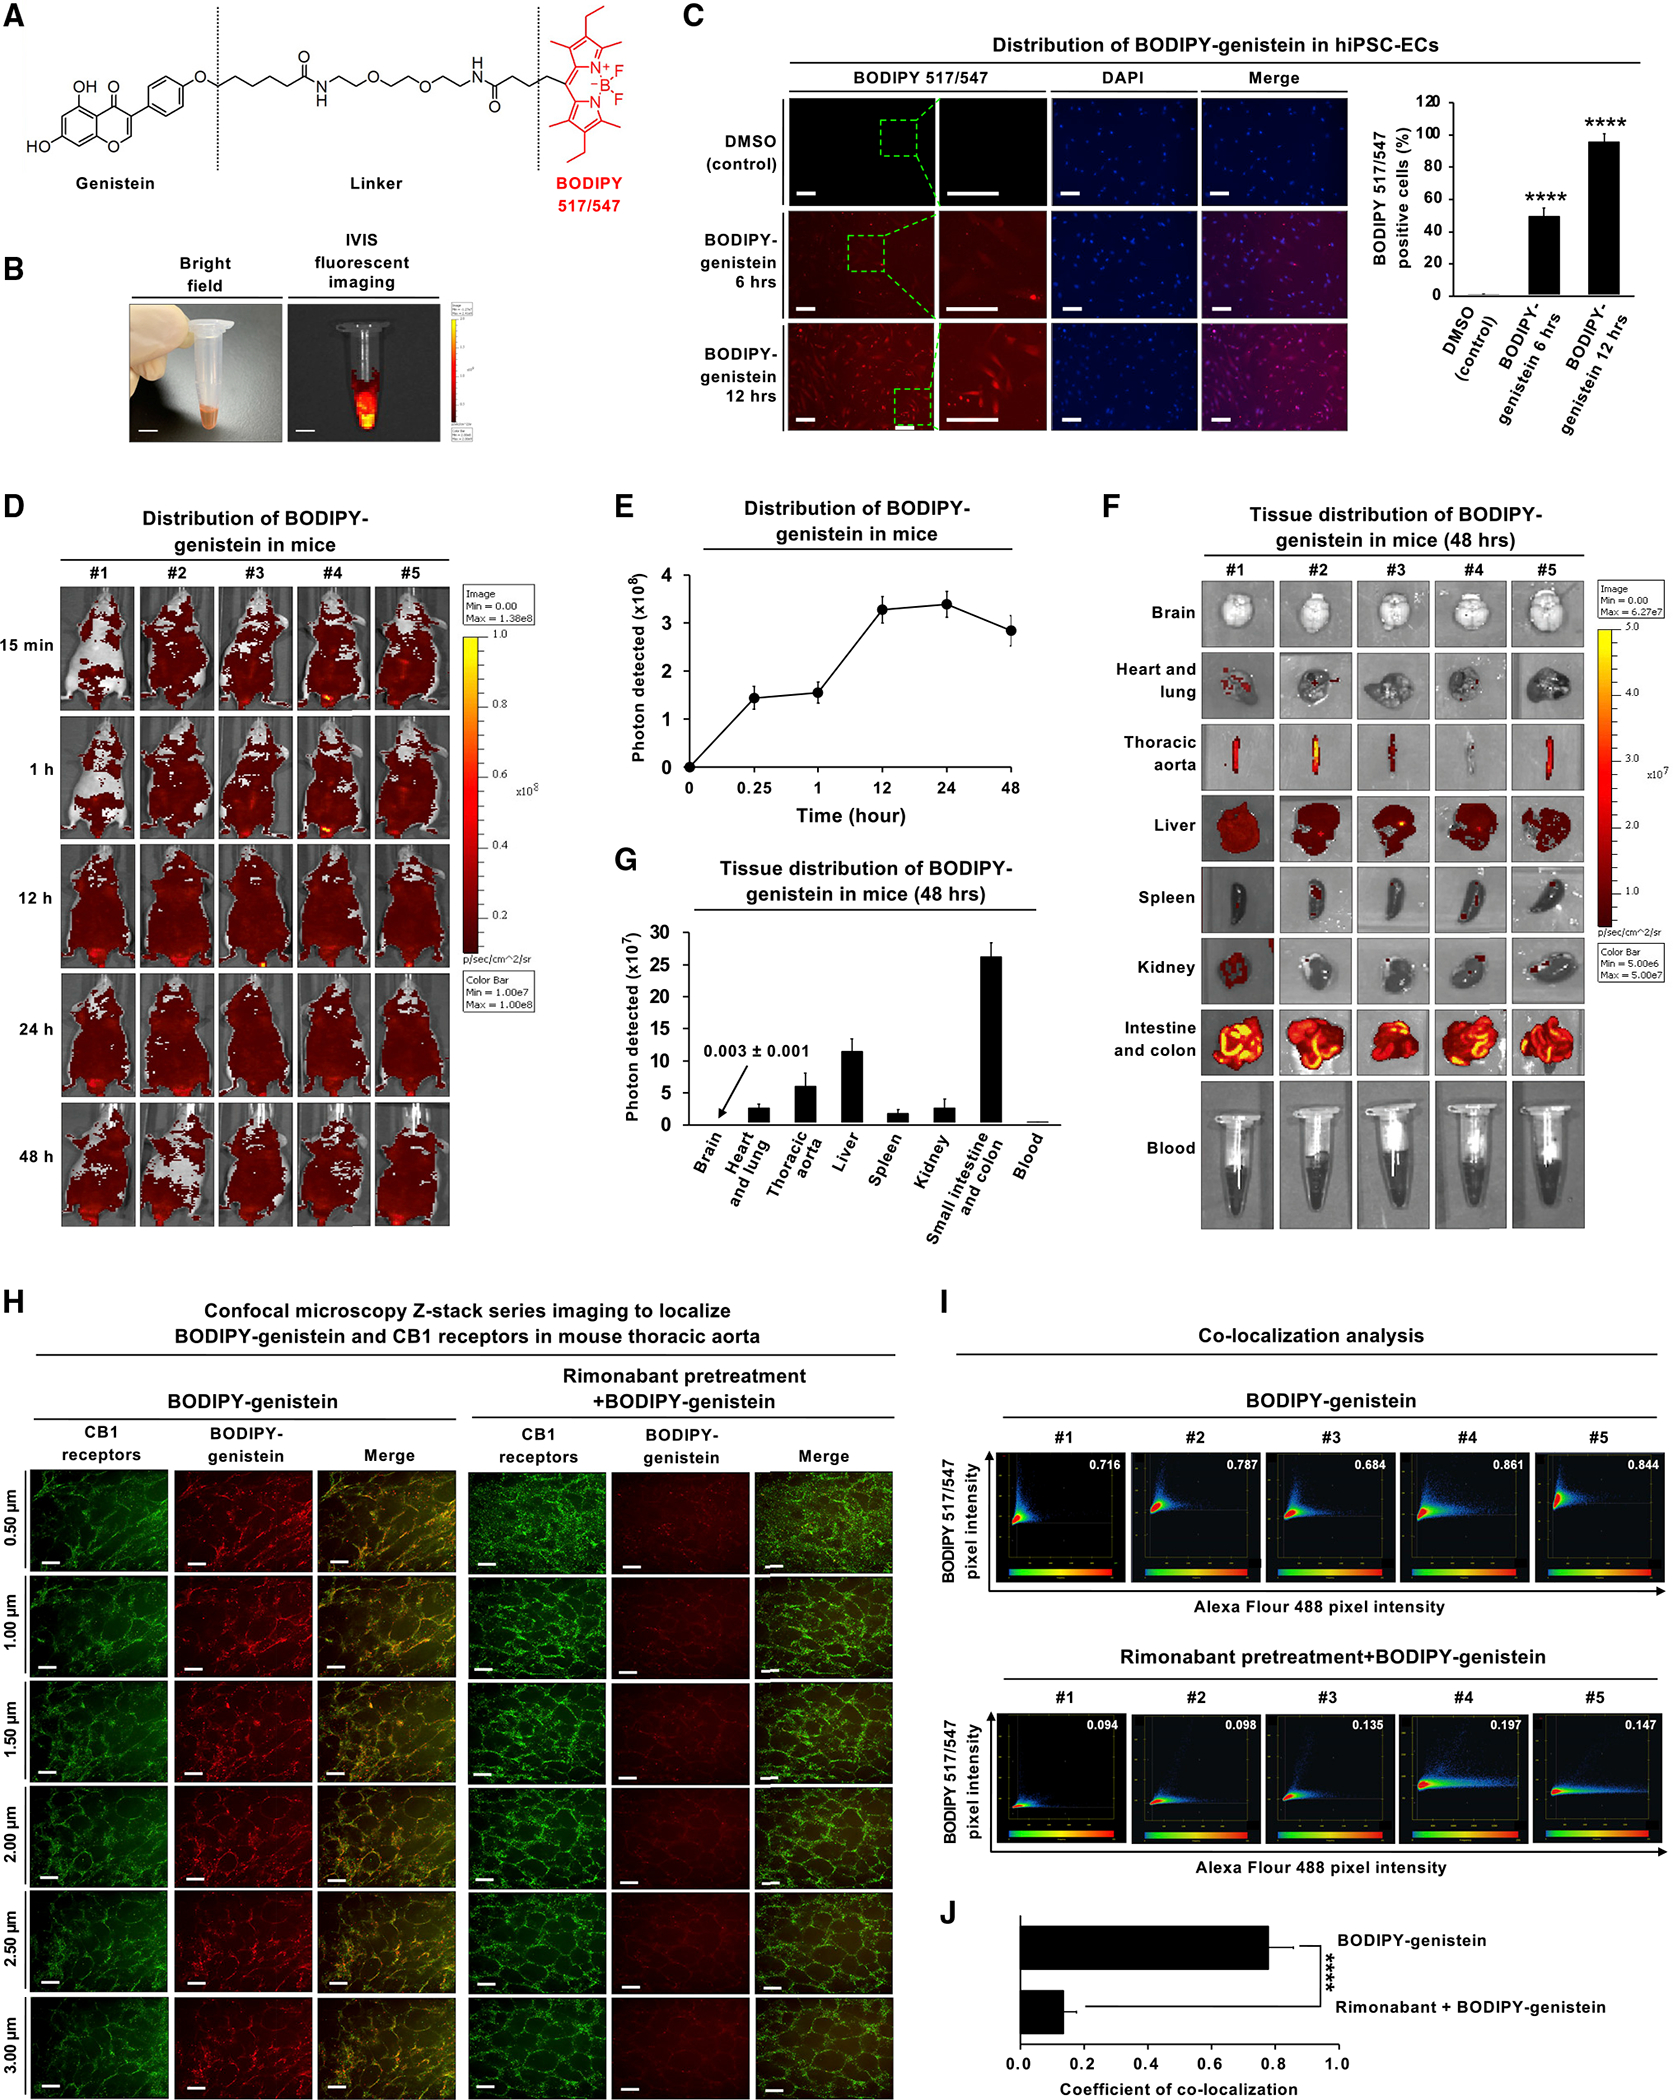
Epidemiological studies reveal that marijuana increases the risk of cardiovascular disease (CVD); however, little is known about the mechanism. Δ9-tetrahydrocannabinol (Δ9-THC), the psychoactive component of marijuana, binds to cannabinoid receptor 1 (CB1/CNR1) in the vasculature and is implicated in CVD. A UK Biobank analysis found that cannabis was an risk factor for CVD. We found that marijuana smoking activated inflammatory cytokines implicated in CVD. In silico virtual screening identified genistein, a soybean isoflavone, as a putative CB1 antagonist. Human-induced pluripotent stem cell-derived endothelial cells were used to model Δ9-THC-induced inflammation and oxidative stress via NF-κB signaling. Knockdown of the CB1 receptor with siRNA, CRISPR interference, and genistein attenuated the effects of Δ9-THC. In mice, genistein blocked Δ9-THC-induced endothelial dysfunction in wire myograph, reduced atherosclerotic plaque, and had minimal penetration of the central nervous system. Genistein is a CB1 antagonist that attenuates Δ9-THC-induced atherosclerosis.

Keywords: Billy Martin tetrad; G protein-coupled receptor; GPCR; UK Biobank; atherosclerosis; cardiovascular disease; human-induced pluripotent stem cell; in silico drug screening; in vivo ligand binding; marijuana.


Conflict of interest statement

Declaration of interests J.C.W. is a co-founder and SAB of Greenstone Biosciences, but the work was done independently. B.K.K. is a co-founder and SAB of ConfometRx, but the work was done independently.

Figures

Figure 1.
Figure 1.. Analysis of the UK Biobank dataset demonstrates the relationship between cannabis and myocardial infarction
(A) Biobank Engine, a tool to search case-control association results from the UK Biobank hospital in-patient health-related outcomes summary information data, was utilized to obtain insight into the genetic mechanism of cannabis-associated cardiovascular disease. Schematic of the stratification of the UK Biobank dataset phenotypes for analysis. To determine the population-level/clinical impact of cannabis on cardiovascular events, patient data acquired from the UK Biobank were analyzed. To identify the relevant study population, self-reported patient surveys collected as part of the UK Biobank dataset were utilized to stratify the UK Biobank population. A total of 157,331UK Biobank participants were surveyed on whether they have ever used cannabis. A subset of 34,878 individuals who responded “yes” were subsequently surveyed for the frequency of cannabis use, and 11,914 responded that they utilized cannabis more than 1 time per month. On the other hand, 122,445 individuals responded “no” to ever taking cannabis. Among these individuals, cannabis use was associated with an increased incidence of MI in a logistic regression model with normalized age, sex, and body mass index (odds ratio 1.16 (95% confidence interval 1.00–1.34); p < 0.05). Cannabis users also showed a higher incidence of premature MI (under the age of 50) than non-users (0.53% versus 0.45%). (B) Investigating inflammatory cytokine release in response to smoking marijuana. Twenty recreational marijuana smokers were recruited to smoke a single marijuana cigarette, and serial blood draws were performed to assess the Δ9-THC levels in blood. Inflammatory cytokine production was assayed using the Olink proteomic platform. Participants were asked to abstain from using marijuana for 24 h before testing. Two participants did not consent to subsequent testing and were excluded from the Olink analysis. Plasma was isolated from n = 18 individuals (13 males/5 females) using sodium citrate tubes at 15 min intervals from 0 min to 180 min after smoking. An Olink inflammation panel with 92 cytokines implicated in inflammation and oxidative stress was used to analyze the blood samples at 0, 90, and 180 min. The Olink panel revealed that several circulating cytokines were upregulated in marijuana smokers as implicated in atherosclerosis.
Figure 2.
Figure 2.. Identification of cannabinoid receptor 1 (CB1) inhibitor by high-throughput virtual screening and molecular docking
(A) Query structure of 4 selective CB1 antagonists (rimonabant, otenabant, AM251, and DBPR-211) was used in the ligand-based high-throughput virtual screening. (B) High-throughput virtual screening workflow for lead compound identification. (C) Docking of the selective CB1 antagonist AM6538 and genistein into the CB1 receptor. The best fit of AM6538 and genistein into CB1 was shown using Schrödinger molecule docking software. (D) Molecular structure of hit compound genistein. (E) Genistein shared structural homology with selective CB1 antagonists in ligand-based virtual screening. (F) Genistein is a neutral antagonist of the CB1 receptor. GTPase-Glo assay reveals rimonabant and taranabant to decrease GTP turnover compared with Apo and GTPase without ligand, indicating that they are inverse agonists. Genistein elicits the same GTP turnover as Apo, suggesting that genistein is a neutral antagonist. CP55490 causes increased GTP turnover consistent with its function as a CB1 agonist. ***p < 0.001 versus Apo; ****p < 0.001 versus Apo; ns, not significant versus Apo.
Figure 3.
Figure 3.. Δ9-THC-induced cytotoxicity in endothelial cells is associated with inflammation and oxidative stress
(A) The effects of Δ9-THC on cell viability of human coronary artery endothelial cells (HCAECs), human umbilical vein endothelial cells (HUVECs), normal human cardiac fibroblasts-ventricular (NHCF-V), and human embryonic stem cell-derived cardiomyocytes (hESC-CMs). Cells were treated with increasing concentrations of Δ9-THC for 48 h, and cell viability was measured by the CellTiter-Glo luminescent cell viability assay. (B and C) (B) The RNA expression of inflammation-related and (C) oxidative stress-related genes in HUVECs. Cells were treated with 5 μM Δ9-THC for 48 h, and gene expression was measured by qPCR and normalized to GAPDH. (D) Oxidative stress-related gene expression in hiPSC-ECs after Δ9-THC treatment. Cells were treated with 5 μM Δ9-THC for 48 h, and mRNA expression of various genes was measured by qPCR analysis and normalized to GAPDH. (E) hiPSC-ECs were treated with 5 μM Δ9-THC or 1 μM doxorubicin (positive control) for 48 h and oxidative stress was measured by CellROX oxidative stress assay. Images were obtained by fluorescence microscopy. The white arrowhead indicates cells producing reactive oxygen species (scale bar, 50 μm). Error bars represent mean ± SEM. *p < 0.05 versus vehicle; **p < 0.01 versus vehicle; ***p < 0.001 versus vehicle; ****p < 0.0001 versus vehicle; ns, not significant versus vehicle.
Figure 4.
Figure 4.. Δ9-THC causes inflammation in hiPSC-ECs, TNF-α release, and monocyte adhesion
(A) RNA expression of inflammation-related genes in hiPSC-ECs after Δ9-THC treatment for 48 h, as determined by qPCR normalized to GAPDH. (B) Δ9-THC promoted the release of TNF-α from hiPSC-ECs. Cells were treated with 0.5 or 5 μM Δ9-THC for 48 h, and TNF-α concentration in the cell culture medium was measured by ELISA. (C) Monocyte adhesion assays of hiPSC-ECs treated with 5 μM Δ9-THC for 48 h. U937 adherence was observed by a fluorescence microscope. (D) The intensity of fluorescence-labeled-adherent U937 monocytes was measured. (E) The effect of Δ9-THC on the inflammation-related gene expression in hiPSC-ECs. Cells were treated with 5 μM Δ9-THC for 48 h. The medium was replaced with fresh cell culture medium, and total RNA was isolated from cells every other day for 14 days. Expression of inflammation-related genes was quantified by qPCR analysis and normalized to GAPDH. The retention time (TR) means the time required for the recovery of mRNA basal level. (F) The effects of Δ9-THC on p65 nuclear translocation in hiPSC-ECs were determined in co-localization studies. hiPSC-ECs were treated with 5 μM Δ9-THC for 48 h and then assayed with anti-p65 antibody for localization of p65 (red fluorescence). The nuclei were counterstained with DAPI (blue fluorescence), and cells were visualized using immunofluorescence microscopy; merged images are shown. The white arrowhead indicates co-localization (purple) of p65 (red) and DAPI (blue) (scale bar, 50 μm). (G) Δ9-THC caused p65 phosphorylation in hiPSC-ECs. Cells were treated with 5 μM Δ9-THC, 1 μM BAY11–7082, or their combination for 48 h. Western blot analysis was performed on total cell lysates using indicated antibodies (left panel). Images were quantified by ImageJ software (right panel). Error bars represent mean ± SEM. *p < 0.05 versus vehicle; **p < 0.01 versus vehicle; ***p < 0.001 versus vehicle; ****p < 0.0001 versus vehicle; ns, not significant versus vehicle; ####p < 0.0001 versus Δ9-THC.
Figure 5.
Figure 5.. Inhibition of CB1 or genistein treatment mitigates the effects of Δ9-THC on hiPSC-ECs
(A) Schematic overview of the CRISPR interference (CRISPRi) in hiPSC-ECs. (B) hiPSC-ECs were treated with 5 μM Δ9-THC for 48 h. The mRNA expression of inflammation-related genes and oxidative stress protective-related genes in hiPSC-ECs treated with sgRNA versus control was quantified by qPCR analysis and normalized to GAPDH. (C) Compounds that mitigate reactive oxygen species production caused by Δ9-THC in hiPSC-ECs were screened. The cells were treated with 5 μM Δ9-THC plus antioxidant reagent or vehicle control for 48 h, and the level of hydrogen peroxide was measured by ROS-Glo™ H2O2 assay. (D) Expression of oxidative stress protective-related genes in hiPSC-ECs as determined by qPCR analysis. The hiPSC-ECs were treated with 5 μM Δ9-THC, 10-μM genistein, or their combination for 48 h, and normalized to GAPDH. (E) Genistein blocked monocyte adhesion in hiPSC-ECs treated with Δ9-THC. hiPSC-ECs were treated with 5 μM Δ9-THC and 10 μM genistein or vehicle (control) for 48 h. U937 cells adherence to hiPSC-ECs was visualized by fluorescence microscope (left panel) and the intensity was quantified (right panel). (F) Genistein prevents Δ9-THC-induced NF-κB phosphorylation in hiPSC-ECs. Cells were treated with 5 μM Δ9-THC,10 μM genistein, or their combination for 48 h. Total cell lysates were subjected to western blot analysis. (G) Genistein attenuates Δ9 -THC-induced inflammation in hiPSC-ECs. The cells were treated with 5μM Δ9-THC and 10 μM genistein for 48 h and then replaced with fresh cell culture medium. Total RNA was isolated from hiPSC-ECs every other day for 2 weeks. The mRNA expression of inflammation-related genes was quantified by qPCR and normalized to GAPDH. The retention time (TR) is the time required for the recovery of gene expression to basal level. Error bars represent mean ± SEM. *p < 0.05 versus vehicle; **p < 0.01 versus vehicle; ***p < 0.001 versus vehicle; ****p < 0.0001 versus vehicle; ns, not significant versus vehicle; ##p < 0.01 versus Δ9-THC; ###p < 0.001 versus Δ9-THC; ####p < 0.0001 versus Δ9-THC.
Figure 6.
Figure 6.. Genistein blocks Δ9-THC-induced endothelial dysfunction
(A) Schematic overview of the wire myograph experimental design in the mouse model. (B) Isometric tension recordings of isolated mice thoracic aortas were performed using a wire myograph. Vascular concentration-dependent relaxation was induced by acetylcholine (ACh) in pre-constricted mouse thoracic arteries. (C and D) (C) The mRNA expression of inflammation-related genes and (D) oxidative stress protective-related genes in thoracic artery tissues from mice is shown after normalizing to GAPDH. (E) Effect of Δ9-THC and genistein on NF-κB phosphorylation in mouse thoracic artery. Total cell lysates were prepared, and the expressions of phosphor-NF-κB were analyzed by ELISA. (F) Superoxide dismutase (SOD) activity of serum from mouse. (G) Reduced glutathione (GSH) levels in the serum samples of mice were detected. Plasma isolated from C57BL/6J mice (n = 5) treated with vehicle control, Δ9-THC, genistein, or their combination every day for 30 days was analyzed by the glutathione colorimetric assay kit (BioVision, K261). (H) Oxidized glutathione (GSSG) levels in the serum samples of mice. (I) Total glutathione (T-GSH) levels in the serum samples of mice. (J) The GSH/GSSG ratio in the serum samples of mice. (K) Schematic overview of the chronic atherosclerosis model. Ldlr−/− mice (9–12 weeks old) were divided into three groups: (1) vehicle control (n = 10), (2) Δ9-THC (n = 12), and (3) Δ9-THC plus genistein (n = 12). Δ9-THC (1 mg/kg/day) or vehicle (90% saline, 5% ethanol, 5% cremophor) was administered subcutaneously using osmotic pumps, and genistein (50 mg/kg/day) or vehicle (corn oil 100 μL/d) was orally administered daily. All experimental animals were fed with a high-fat diet (HFD) for the duration of the treatment protocol. At the end of 12 weeks, the mice were euthanized to determine the extent of atherosclerotic plaque formation. (L) Oil red O staining of atherosclerotic plaques in cross-sections at the aortic root level with scale bars at 500 μm. (M) Quantitation of atherosclerotic plaques: (1) vehicle control (n = 10), (2) Δ9-THC (n = 10), and (3) Δ9-THC plus genistein (n = 11). (N) Immunostaining of CD68 in cross-sections at the aortic root level with scale bars at 500 μm. (O) Quantitation of CD68-positive area from (1) vehicle control (n = 10), (2) Δ9-THC (n = 9), and (3) Δ9-THC plus genistein (n = 10). (P) Schematic overview of the experimental design in the Apoe−/− mouse model. Partial carotid artery ligation (PCAL) was performed in Apoe−/− mice (10–16 weeks old). One day after PCAL, Apoe−/− mice were divided into three groups (n = 5/group): (1) vehicle control, (2) Δ9-THC (1 mg/kg intraperitoneally, twice daily for a total of 10 days), and (3) Δ9-THC (1 mg/kg intraperitoneally, twice daily for a total of 10 days) plus genistein (50 mg/kg intraperitoneally, once daily for a total of 10 days). All experimental animals were fed with a high-fat diet (HFD) following PCAL. After 10 days of HFD and treatment exposure, carotid atherosclerosis plaque burden was assayed in all three groups. (Q) Carotid artery sections were counterstained with hematoxylin and eosin (H&E), and a representative slide was presented with scale bars at 100 μm. (R) Oil red O staining of atherosclerotic plaques in cross-section of mouse carotid artery (lower panel) with scale bar at 100 μm. The atherosclerotic plaques were quantified. Error bars represent mean ± SEM. *p < 0.05 versus vehicle; **p < 0.01 versus vehicle; ***p < 0.001 versus vehicle, ****p < 0.0001 versus vehicle; ns, not significant versus vehicle; #p < 0.05 versus Δ9-THC; ##p < 0.01 versus Δ9-THC; ###p < 0.001 versus Δ9-THC; ####p < 0.0001 versus Δ9-THC.
Figure 7.
Figure 7.. In vitro validation, in vivo distribution, and confirmation of in vivo binding to the CB1 receptor using fluorescently labeled genistein
(A) Chemical structure of BODIPY517/547-genistein. The core structures of the BODIPY fluorophore are highlighted in red. (B) Bright-field image (left panel) and fluorescent image (right panel) of BODIPY517/547-genistein were detected by the IVIS Spectrum in vivo imaging system. The scale bar,5 mm. (C) The cellular distribution of BODIPY517/547-genistein in hiPSC-ECs. The cells were treated with BODIPY517/547-genistein (5 μM) for 6 or 12 h and subjected to fluorescence microscopy for BODIPY517/547-genistein (red fluorescence) and DAPI (blue fluorescence). Representative fluorescence images of the cells with the inset showing higher magnification as indicated with the green-boxed area. The scale bar,100 μm. (D) The fluorescence images of BODIPY517/547-genistein after intravenous injection into male nude mice. Adult male BALB/c nude mice (n = 5) were intravenously injected with BODIPY517/547-genistein at a dose of 5 mg/kg. The in vivo fluorescence images were detected by the IVIS Spectrum at indicated time points. All mice were sacrificed at 48 h, and major organs were collected and then fixed using formalin. (E) The tissue distribution of BODIPY517/547-genistein in mice over 48 h. Fluorescence images were quantified using the IVIS imaging system. The fluorescence intensity peaked at 24 h. The fluorescence images of BODIPY517/547-genistein were quantified by ImageJ software. (F) Images of the brain, heart and lung, thoracic aorta, liver, spleen, kidney, intestine, colon, and blood were obtained from n = 5 mice. BODIPY517/547-genistein was detected predominately in the intestine and abdominal viscera but with minimal signal in the brain. (G) BODIPY517/547-genistein accumulated in the small intestine, colon, liver, thoracic artery, heart, and lungbut was minimally detected in the brain. Fluorescence images were quantified using the ImageJ software. (H) En face immunofluorescence staining was performed to observe the localization of BODIPY517/547-genistein and CB1 receptors in vascular endothelial cells from the mouse thoracic aorta. Mice were either injected with BODIPY517/547-genistein alone or pre-treated with 100 nM rimonabant for 30 min prior to injection of BODIPY517/547-genistein. Mouse aortas were isolated and permeabilized with Triton X100. The aortas were incubated with anti-CB1 antibody Alexa Fluor 488, green. Fluorescent z stack images were collected at 0.5 μm steps by laser scan confocal microscopy. En face immunofluorescence images of BODIPY517/547-genistein (red fluorescence) and CB1 receptor (Alexa Fluor 488, green fluorescence) in vascular endothelial cells after treatment with BODIPY517/547-genistein for 48 h. Scale bar, 20 μm. (I) Scatter plots of co-localization analysis in vascular endothelial cells from mouse thoracic aorta at 48 h (left panel). The x axis represents CB1 receptors (Alexa Fluor 488, green fluorescence), and the y axis represents BODIPY517/547-genistein (red fluorescence). (J) Quantification of BODIPY517/547-genistein co-localized with CB1 receptors. The co-localized signal is colored orange. Error bars represent mean ± SEM. *p < 0.05 versus vehicle; **p < 0.01 versus vehicle; ***p < 0.001 versus vehicle; ****p < 0.0001 versus vehicle; ns, not significant versus vehicle.

Comment in

References

    1. Akira S, Uematsu S, and Takeuchi O (2006). Pathogen recognition and innate immunity. Cell 124, 783–801. - PubMed
    1. Ardigo D, Assimes TL, Fortmann SP, Go AS, Hlatky M, Hytopoulos E, Iribarren C, Tsao PS, Tabibiazar R, and Quertermous T; ADVANCE Investigators (2007). Circulating chemokines accurately identify individuals with clinically significant atherosclerotic heart disease. Physiol. Genomics 31, 402–409. - PubMed
    1. Atakan Z (2012). Cannabis, a complex plant: different compounds and different effects on individuals. Ther. Adv. Psychopharmacol. 2, 241–254. - PMC - PubMed
    1. Baba O, Huang LH, Elvington A, Szpakowska M, Sultan D, Heo GS, Zhang X, Luehmann H, Detering L, Chevigne A, et al. (2021). CXCR4-binding positron emission tomography tracers link monocyte recruitment and endothelial injury in murine atherosclerosis. Arterioscler. Thromb. Vasc. Biol. 41, 822–836. - PMC - PubMed
    1. Badowski ME (2017). A review of oral cannabinoids and medical marijuana for the treatment of chemotherapy-induced nausea and vomiting: a focus on pharmacokinetic variability and pharmacodynamics. Cancer Chemother. Pharmacol. 80, 441–449. - PMC - PubMed

Publication types