. 2022 Aug 15;92(4):299-313.
doi: 10.1016/j.biopsych.2022.02.959. Epub 2022 Mar 4.

Virtual Ontogeny of Cortical Growth Preceding Mental Illness

Yash Patel  1 Jean Shin  2 Christoph Abé  3 Ingrid Agartz  4 Clara Alloza  5 Dag Alnæs  4 Sonia Ambrogi  6 Linda A Antonucci  7 Celso Arango  8 Volker Arolt  9 Guillaume Auzias  10 Rosa Ayesa-Arriola  11 Nerisa Banaj  6 Tobias Banaschewski  12 Cibele Bandeira  13 Zeynep Başgöze  14 Renata Basso Cupertino  15 Claiton H D Bau  13 Jochen Bauer  16 Sarah Baumeister  12 Fabio Bernardoni  17 Alessandro Bertolino  18 Caterina Del Mar Bonnin  19 Daniel Brandeis  12 Silvia Brem  20 Jason Bruggemann  21 Robin Bülow  22 Juan R Bustillo  23 Sara Calderoni  24 Rosa Calvo  25 Erick J Canales-Rodríguez  26 Dara M Cannon  27 Susanna Carmona  28 Vaughan J Carr  21 Stanley V Catts  29 Sneha Chenji  30 Qian Hui Chew  31 David Coghill  32 Colm G Connolly  33 Annette Conzelmann  34 Alexander R Craven  35 Benedicto Crespo-Facorro  36 Kathryn Cullen  14 Andreas Dahl  37 Udo Dannlowski  9 Christopher G Davey  38 Christine Deruelle  10 Covadonga M Díaz-Caneja  39 Katharina Dohm  9 Stefan Ehrlich  17 Jeffery Epstein  40 Tracy Erwin-Grabner  41 Lisa T Eyler  42 Jennifer Fedor  43 Jacqueline Fitzgerald  44 William Foran  43 Judith M Ford  45 Lydia Fortea  19 Paola Fuentes-Claramonte  26 Janice Fullerton  46 Lisa Furlong  47 Louise Gallagher  48 Bingchen Gao  49 Si Gao  50 Jose M Goikolea  19 Ian Gotlib  51 Roberto Goya-Maldonado  41 Hans J Grabe  52 Melissa Green  21 Eugenio H Grevet  53 Nynke A Groenewold  54 Dominik Grotegerd  9 Oliver Gruber  55 Jan Haavik  56 Tim Hahn  9 Ben J Harrison  57 Walter Heindel  16 Frans Henskens  58 Dirk J Heslenfeld  59 Eva Hilland  60 Pieter J Hoekstra  61 Sarah Hohmann  12 Nathalie Holz  12 Fleur M Howells  62 Jonathan C Ipser  54 Neda Jahanshad  63 Babette Jakobi  64 Andreas Jansen  65 Joost Janssen  5 Rune Jonassen  66 Anna Kaiser  12 Vasiliy Kaleda  67 James Karantonis  47 Joseph A King  17 Tilo Kircher  68 Peter Kochunov  50 Sheri-Michelle Koopowitz  54 Mikael Landén  69 Nils Inge Landrø  37 Stephen Lawrie  70 Irina Lebedeva  67 Beatriz Luna  43 Astri J Lundervold  35 Frank P MacMaster  71 Luigi A Maglanoc  72 Daniel H Mathalon  73 Colm McDonald  74 Andrew McIntosh  70 Susanne Meinert  9 Patricia T Michie  75 Philip Mitchell  21 Ana Moreno-Alcázar  76 Bryan Mowry  77 Filippo Muratori  24 Leila Nabulsi  27 Igor Nenadić  78 Ruth O'Gorman Tuura  79 Jaap Oosterlaan  80 Bronwyn Overs  46 Christos Pantelis  81 Mara Parellada  39 Jose C Pariente  82 Paul Pauli  83 Giulio Pergola  18 Francesco Maria Piarulli  18 Felipe Picon  84 Fabrizio Piras  6 Edith Pomarol-Clotet  26 Clara Pretus  85 Yann Quidé  21 Joaquim Radua  19 J Antoni Ramos-Quiroga  86 Paul E Rasser  87 Andreas Reif  88 Alessandra Retico  89 Gloria Roberts  21 Susan Rossell  90 Diego Luiz Rovaris  91 Katya Rubia  92 Matthew Sacchet  93 Josep Salavert  76 Raymond Salvador  26 Salvador Sarró  26 Akira Sawa  94 Ulrich Schall  87 Rodney Scott  95 Pierluigi Selvaggi  96 Tim Silk  97 Kang Sim  98 Antonin Skoch  99 Gianfranco Spalletta  6 Filip Spaniel  99 Dan J Stein  54 Olaf Steinsträter  78 Aleks Stolicyn  70 Yoichiro Takayanagi  100 Leanne Tamm  40 Maria Tavares  13 Alexander Teumer  101 Katharina Thiel  9 Sophia I Thomopoulos  102 David Tomecek  99 Alexander S Tomyshev  67 Diana Tordesillas-Gutiérrez  103 Michela Tosetti  104 Anne Uhlmann  105 Tamsyn Van Rheenen  106 Javier Vazquez-Bourgón  11 Meike W Vernooij  107 Eduard Vieta  25 Oscar Vilarroya  108 Cynthia Weickert  109 Thomas Weickert  110 Lars T Westlye  4 Heather Whalley  70 David Willinger  111 Alexandra Winter  9 Katharina Wittfeld  112 Tony T Yang  113 Yuliya Yoncheva  114 Jendé L Zijlmans  115 Martine Hoogman  64 Barbara Franke  116 Daan van Rooij  117 Jan Buitelaar  117 Christopher R K Ching  102 Ole A Andreassen  4 Elena Pozzi  118 Dick Veltman  119 Lianne Schmaal  118 Theo G M van Erp  49 Jessica Turner  120 F Xavier Castellanos  114 Zdenka Pausova  2 Paul Thompson  102 Tomas Paus  121
Affiliations

Virtual Ontogeny of Cortical Growth Preceding Mental Illness

Yash Patel et al. Biol Psychiatry. .

Abstract

Background: Morphology of the human cerebral cortex differs across psychiatric disorders, with neurobiology and developmental origins mostly undetermined. Deviations in the tangential growth of the cerebral cortex during pre/perinatal periods may be reflected in individual variations in cortical surface area later in life.

Methods: Interregional profiles of group differences in surface area between cases and controls were generated using T1-weighted magnetic resonance imaging from 27,359 individuals including those with attention-deficit/hyperactivity disorder, autism spectrum disorder, bipolar disorder, major depressive disorder, schizophrenia, and high general psychopathology (through the Child Behavior Checklist). Similarity of interregional profiles of group differences in surface area and prenatal cell-specific gene expression was assessed.

Results: Across the 11 cortical regions, group differences in cortical area for attention-deficit/hyperactivity disorder, schizophrenia, and Child Behavior Checklist were dominant in multimodal association cortices. The same interregional profiles were also associated with interregional profiles of (prenatal) gene expression specific to proliferative cells, namely radial glia and intermediate progenitor cells (greater expression, larger difference), as well as differentiated cells, namely excitatory neurons and endothelial and mural cells (greater expression, smaller difference). Finally, these cell types were implicated in known pre/perinatal risk factors for psychosis. Genes coexpressed with radial glia were enriched with genes implicated in congenital abnormalities, birth weight, hypoxia, and starvation. Genes coexpressed with endothelial and mural genes were enriched with genes associated with maternal hypertension and preterm birth.

Conclusions: Our findings support a neurodevelopmental model of vulnerability to mental illness whereby prenatal risk factors acting through cell-specific processes lead to deviations from typical brain development during pregnancy.

Keywords: Cortical growth; Cortical surface area; Mental illness; Neurodevelopment; Neurogenesis; Psychiatric disorders.


Figures

Figure 1.
Figure 1.
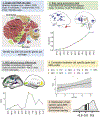
Methodological workflow for virtual ontogeny. Step 1 (top left): identify top 200 cell-specific genes from single-cell RNA sequencing data of the developing neocortex (30). Step 2 (top right): quantify median gene expression (bulk RNA) across donors for each of 11 cortical regions sampled from the PsychENCODE dataset (33). Cell specificity was defined as the ratio of expression of a gene in a given cell type divided by the expression across all cells. For instance, the gene SLC1A3 was in the top 200 specific genes for the radial-glia panel. The expression of this gene is plotted in step 2 (top right). Step 3 (bottom left): quantify meta-analytic group differences in surface area between cases and controls across the 11 cortical regions sampled in the PsychENCODE dataset. Group differences for SCZ are plotted as an example. Step 4 (bottom right, top half): correlation between cell-specific gene expression and an MRI-derived profile, in this case, SLC1A3 expression and case-control differences for SCZ. This is repeated for all 200 genes specific to a cell type (in this case, radial glia) to create a distribution of correlation coefficients in step 5 (bottom right, bottom half). A1C, primary auditory cortex; ABCD, Adolescent Brain Cognitive Development; AMY, amygdala; CBC, cerebral cortex; DFC, dorsal frontal cortex; ENIGMA, Enhancing Neuro Imaging Genetics through Meta Analysis; HIP, hippocampus; IPC, inferior parietal cortex; IPCs, intermediate progenitor cells; ITC, inferior temporal cortex; M1C, primary motor cortex; MD, mediodorsal nucleus of thalamus; MDD, major depressive disorder; MFC, medial frontal cortex; MRI, magnetic resonance imaging; OFC, orbitofrontal cortex; OPC, oligodendrocyte progenitor cell; PCW, postconception week; S1C, primary somatosensory cortex; SCZ, schizophrenia; STC, superior temporal cortex; STR, striatum; V1C, primary visual cortex; VFC, ventral frontal cortex.
Figure 2.
Figure 2.
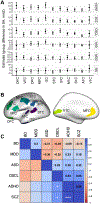
Regional differences in cortical surface area across multiple psychiatric conditions. (A) Meta-analytic estimates of group differences in cortical surface between cases and controls. Contrast shown as controls minus cases, where positive values indicate smaller surface area in cases. (B) Schematic location of regions of interest from which surface area was quantified. (C) Cross-disorder correlation matrix of profiles from panel (A). *Nominal p < .05; ***false discovery rate–corrected p < .05. A1C, primary auditory cortex; ADHD, attention-deficit/hyperactivity disorder; ASD, autism spectrum disorder; BD, bipolar disorder; CBCL, Child Behavior Checklist; DFC, dorsal frontal cortex; IPC, inferior parietal cortex; ITC, inferior temporal cortex; M1C, primary motor cortex; MDD, major depressive disorder; MFC, medial frontal cortex; OFC, orbitofrontal cortex; SA, surface area; S1C, primary somatosensory cortex; SCZ, schizophrenia; STC, superior temporal cortex; V1C, primary visual cortex; VFC, ventral frontal cortex.
Figure 3.
Figure 3.
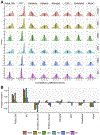
Virtual ontogeny. (A) Distribution of correlation coefficients between prenatal cell-specific gene expression and postnatal group differences in cortical surface area. Gray box around zero represents 99% confidence intervals from the null distribution generated through 10,000 resamplings of gene expression and group-difference profiles. Black vertical line represents the mean correlation coefficient (biweight midcorrelation) of the distribution, also plotted in panel (B). *False discovery rate–corrected p value < .01. ADHD, attention-deficit/hyperactivity disorder; ASD, autism spectrum disorder; BD, bipolar disorder; bicor, biweight midcorrelation; CBCL, Child Behavior Checklist; IPC, intermediate progenitor cell; MDD, major depressive disorder; OPC, oligodendrocyte progenitor cell; SCZ, schizophrenia.
Figure 4.
Figure 4.
Differences in cortical surface area cluster into associative and primary/unimodal cortex. (A) Hierarchical clustering dendrogram of group differences in cortical surface area with k = 2 clusters. (B) Boxplot depicting group differences between clusters for each of the six profiles investigated. (C) LOESS model fits of cell-specific gene expression trajectories stratified by cortical cluster. Expression (y-axis) is unit scaled. Shaded gray region around the model fit represents 95% confidence intervals. Vertical black dashed lines represent prominent windows of neurodevelopment reported previously (33). A1C, primary auditory cortex; ADHD, attention-deficit/hyperactivity disorder; ASD, autism spectrum disorder; BD, bipolar disorder; CBCL, Child Behavior Checklist; DFC, dorsal frontal cortex; IPC, intermediate progenitor cell; IPC, inferior parietal cortex; ITC, inferior temporal cortex; M1C, primary motor cortex; MDD, major depressive disorder; MFC, medial frontal cortex; OFC, orbitofrontal cortex; OPC, oligodendrocyte progenitor cell; PCW, postconception week; S1C, primary somatosensory cortex; SCZ, schizophrenia; STC, superior temporal cortex; V1C, primary visual cortex; VFC, ventral frontal cortex.
Figure 5.
Figure 5.
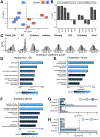
Enrichment of cell-specific gene panels. (A) Principal component analysis plot of regional loadings of PC1 and PC2. (B) Correlation between disorder-specific profiles and PC1/PC2 loadings. (C) Virtual ontogeny analysis depicting distributions of correlation between interregional variation in cell-specific gene expression and PC1 loadings (across the 11 regions). *FDR p < .01. (DF) Gene Ontology enrichment analysis of coexpressed cell-specific gene panels. Gene ratio represents the proportion of genes in the cell-specific panel that intersect with a Gene Ontology term with the total size of the gene set. (G) Enrichment analysis for disorder-associated genes for the three disorders loading strongest on PC1 (SCZ, ADHD, and ASD) and for (H) cortical surface area–associated genes of clusters 1 and 2. A1C, primary auditory cortex; ADHD, attention-deficit/hyperactivity disorder; ASD, autism spectrum disorder; BD, bipolar disorder; CBCL, Child Behavior Checklist; DFC, dorsal frontal cortex; FDR, false discovery rate; IPC, intermediate progenitor cell; IPC, inferior parietal cortex; ITC, inferior temporal cortex; M1C, primary motor cortex; MDD, major depressive disorder; MFC, medial frontal cortex; OFC, orbitofrontal cortex; OPC, oligodendrocyte progenitor cell; PC, principal component; S1C, primary somatosensory cortex; SCZ, schizophrenia; STC, superior temporal cortex; V1C, primary visual cortex; VFC, ventral frontal cortex.
Figure 6.
Figure 6.
Risk factors of psychosis with implicated cell types. (A) Z scores for pre/perinatal risk factors for psychosis from Davies et al. (39) are represented by the size of the circle, and the corresponding odds ratio is in the text below. (B) Enrichment between genes implicated in risk factors for psychosis and coexpressed cell-specific gene panels identified to be related to group differences in cortical surface area. Horizontal dashed line represents FDR < .05. FDR, false discovery rate; IPC, intermediate progenitor cell; OR, odds ratio.

References

    1. Azevedo FAC, Carvalho LRB, Grinberg LT, Farfel JM, Ferretti REL, Leite REP, et al. (2009): Equal numbers of neuronal and nonneuronal cells make the human brain an isometrically scaled-up primate brain. J Comp Neurol 513:532–541. - PubMed
    1. Rakic P (1988): Specification of cerebral cortical areas. Science 241:170–176. - PubMed
    1. Gilmore JH, Knickmeyer RC, Gao W (2018): Imaging structural and functional brain development in early childhood. Nat Rev Neurosci 19:123–137. - PMC - PubMed
    1. Storsve AB, Fjell AM, Tamnes CK, Westlye LT, Overbye K, Aasland HW, Walhovd KB (2014): Differential longitudinal changes in cortical thickness, surface area and volume across the adult life span: Regions of accelerating and decelerating change. J Neurosci 34:8488–8498. - PMC - PubMed
    1. Duerden EG, Chakravarty MM, Lerch JP, Taylor MJ (2020): Sex-based differences in cortical and subcortical development in 436 individuals aged 4–54 years. Cereb Cortex 30:2854–2866. - PMC - PubMed

Publication types

Grants and funding