. 2022 May 2;28(9):1938-1947.
doi: 10.1158/1078-0432.CCR-21-2585.

Diminished Immune Surveillance during Histologic Progression of Intraductal Papillary Mucinous Neoplasms Offers a Therapeutic Opportunity for Cancer Interception

Affiliations

Diminished Immune Surveillance during Histologic Progression of Intraductal Papillary Mucinous Neoplasms Offers a Therapeutic Opportunity for Cancer Interception

Sharia Hernandez et al. Clin Cancer Res. .

Abstract

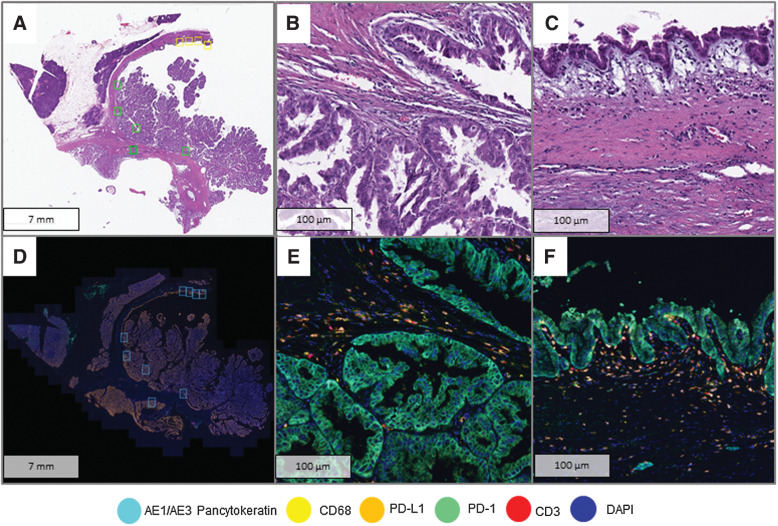
Purpose: Intraductal papillary mucinous neoplasms (IPMN) are bona fide precursors to pancreatic ductal adenocarcinoma (PDAC). While genomic alterations during multistep IPMN progression have been well cataloged, the accompanying changes within the tumor immune microenvironment (TIME) have not been comprehensively studied. Herein, we investigated TIME-related alterations during IPMN progression, using multiplex immunofluorescence (mIF) coupled with high-resolution image analyses.

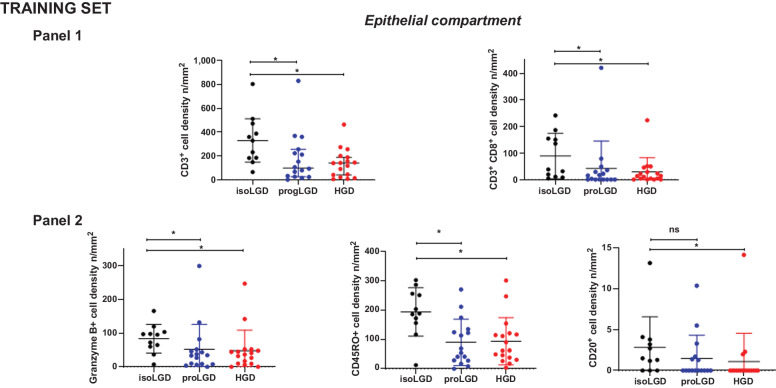
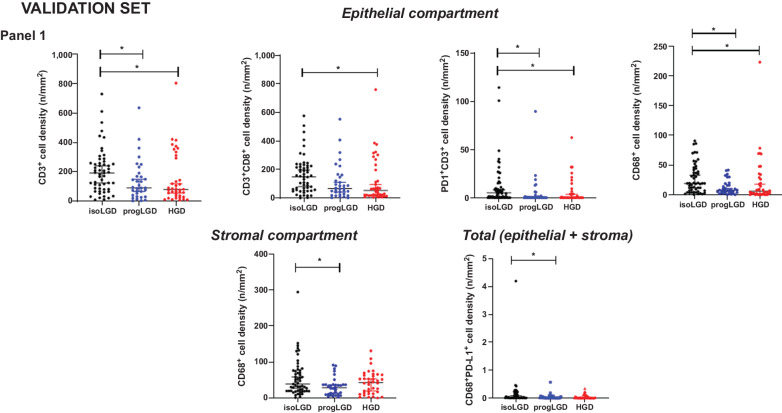
Experimental design: Two sets of formalin-fixed, paraffin-embedded tissue samples from surgically resected IPMNs were analyzed. The training set of 30 samples consisted of 11 low-grade IPMN (LG-IPMN), 17 high-grade IPMN (HG-IPMN), and 2 IPMN with PDAC, while a validation set of 93 samples comprised of 55 LG-IPMN and 38 HG-IPMN. The training set was analyzed with two panels of immuno-oncology-related biomarkers, while the validation set was analyzed with a subset of markers found significantly altered in the training set.

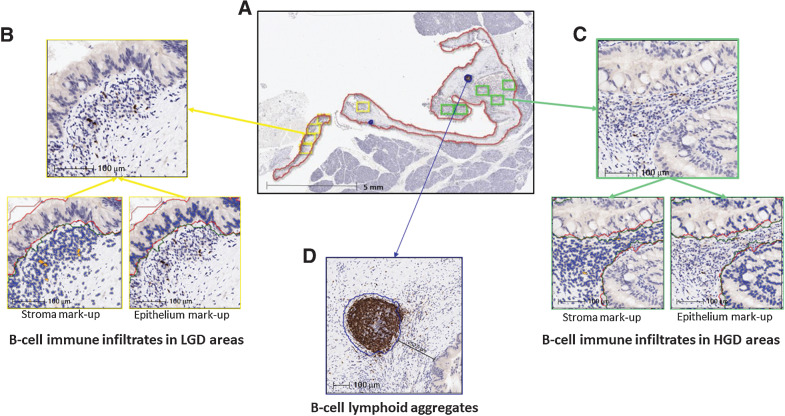
Results: Cell types indicative of enhanced immune surveillance, including cytotoxic and memory T cells, and antigen-experienced T cells and B cells, were all found at higher densities within isolated LG-IPMNs compared with HG-IPMNs. Notably, the TIME of LG-IPMNs that had progressed at the time of surgical resection (progressor LGD) resembled that of the synchronous HG-IPMNs, underscoring that attenuated immune surveillance occurs even in LG-IPMNs destined for progression.

Conclusions: Our findings provide a basis for interception of cystic neoplasia to PDAC, through maintenance of sustained immune surveillance using vaccines and other prevention approaches.


Figures

Figure 1. Analysis of immune cell infiltrates using mIF. A, Whole section H&E slide of a high-grade IPMN with HGD areas (yellow squares) and LGD areas (green squares) selected for digital image analysis. B, HGD area at high resolution (40×). C. LGD area at high resolution (40×). D, Image scan of Phenochart with selected areas for high magnification (blue squares). E, Panel 1 composite of HGD area (40×). F, Panel 1 composite of LGD area.
Figure 1.
Analysis of immune cell infiltrates using mIF. A, Whole-section H&E slide of a high-grade IPMN with HGD areas (yellow squares) and LGD areas (green squares) selected for digital image analysis. B, HGD area at high resolution (40×). C. LGD area at high resolution (40×). D, Image scan of Phenochart with selected areas for high magnification (blue squares). E, Panel 1 composite of HGD area (40×). F, Panel 1 composite of LGD area.
Figure 2. Analysis of B-cell immune infiltrates and B-cell lymphoid aggregates in IPMNs by IHC for CD20 and digital image analysis. A, Low-magnification image of a high-grade IPMN with cyst area (red line) B-cell lymphoid aggregates (blue line), LGD (yellow boxes) and HGD (green boxes) areas selected for image analysis. B and C show high magnification images of LGD and HGD areas and mark-up images of CD20-positive cells (orange) in stromal and dysplastic epithelial/carcinoma compartments. D, shows a high magnification image of a B-cell lymphoid aggregate (blue line).
Figure 2.
Analysis of B-cell immune infiltrates and B-cell lymphoid aggregates in IPMNs by IHC for CD20 and digital image analysis. A, Low-magnification image of a high-grade IPMN with cyst area (red line), B-cell lymphoid aggregates (blue line), LGD (yellow boxes), and HGD (green boxes) areas selected for image analysis. B and C show high-magnification images of LGD and HGD areas and mark-up images of CD20-positive cells (orange) in stromal and dysplastic epithelial compartments. D shows a high-magnification image of a B-cell lymphoid aggregate (blue line).
Figure 3. Scatter dot plot showing differential distribution of immune cells densities in the dysplastic epithelial/carcinoma compartment of the Training set, among dysplasia areas of low-grade IPMN and high-grade IPMN (isoLGD: isolated low-grade dysplasia area of low-grade IPMN; progLGD: progressive low-grade dysplasia area of high-grade IPMN, and HGD: high-grade dysplasia area of high-grade IPMN). Panel 1: CD3+, CD3+CD8+; and Panel 2: Granzyme B+, CD45RO+, and CD20+. Differences between all groups were determined using Kruskal–Wallis, and differences between two groups were determined by t test (ns, nonsignificant). Black bars indicate median and 95% confidence Interval.
Figure 3.
Scatter dot plot showing differential distribution of immune cell densities in the dysplastic epithelial compartment of the Training set, among dysplasia areas of low-grade IPMN and high-grade IPMN (isoLGD, isolated low-grade dysplasia area of low-grade IPMN; progLGD, progressive low-grade dysplasia area of high-grade IPMN; HGD, high-grade dysplasia area of high-grade IPMN). Panel 1: CD3+, CD3+CD8+; Panel 2: Granzyme B+, CD45RO+, and CD20+. Differences between all groups were determined using Kruskal–Wallis, and differences between two groups were determined by t test (ns, nonsignificant). Black bars indicate median and 95% confidence Interval.
Figure 4. Scatter dot plot showing differential distribution of immune cells densities in the different compartments of the validation set, among dysplasia areas of low-grade IPMN and high-grade IPMN (isoLGD: isolated LGD area of low-grade IPMN; progLGD: progressive low-grade dysplasia area of high-grade IPMN, and HGD: high-grade dysplasia area of high-grade IPMN). Dysplastic epithelial/carcinoma compartment Panel 1: CD3+, CD3+CD8+, PD1+CD3+, CD68+; Stromal compartment panel 1: CD68+ and total compartment panel 1: CD68+PD-L1+. Differences between all groups were determined using Kruskal–Wallis, and differences between two groups were determined by t test (ns, nonsignificant). Black bars indicate median and 95% confidence Interval.
Figure 4.
Scatter dot plot showing differential distribution of immune cell densities in the different compartments of the Validation set, among dysplasia areas of low-grade IPMN and high-grade IPMN (isoLGD, isolated LGD area of low-grade IPMN; progLGD, progressive low-grade dysplasia area of high-grade IPMN; HGD, high-grade dysplasia area of high-grade IPMN). Dysplastic epithelial compartment panel 1: CD3+, CD3+CD8+, PD1+CD3+, CD68+; Stromal compartment panel 1: CD68+; Total compartment panel 1: CD68+PD-L1+. Differences between all groups were determined using Kruskal–Wallis, and differences between two groups were determined by t test (ns, nonsignificant). Black bars indicate median and 95% confidence Interval.

Comment in

  • Clin Cancer Res. 28:1743.
  • Clin Cancer Res. 28:1743.

References

    1. Tanaka M, Fernandez-Del Castillo C, Kamisawa T, Jang JY, Levy P, Ohtsuka T, et al. . Revisions of international consensus Fukuoka guidelines for the management of IPMN of the pancreas. Pancreatology 2017;17:738–53. - PubMed
    1. Matthaei H, Schulick RD, Hruban RH, Maitra A. Cystic precursors to invasive pancreatic cancer. Nat Rev Gastroenterol Hepatol 2011;8:141–50. - PMC - PubMed
    1. Marchegiani G, Mino-Kenudson M, Sahora K, Morales-Oyarvide V, Thayer S, Ferrone C, et al. . IPMN involving the main pancreatic duct: biology, epidemiology, and long-term outcomes following resection. Ann Surg 2015;261:976–83. - PMC - PubMed
    1. Hackert T, Fritz S, Klauss M, Bergmann F, Hinz U, Strobel O, et al. . Main-duct intraductal papillary mucinous neoplasm: high cancer risk in duct diameter of 5 to 9 mm. Ann Surg 2015;262:875–80. - PubMed
    1. Basturk O, Hong SM, Wood LD, Adsay NV, Albores-Saavedra J, Biankin AV, et al. . A revised classification system and recommendations from the Baltimore consensus meeting for neoplastic precursor lesions in the pancreas. Am J Surg Pathol 2015;39:1730–41. - PMC - PubMed

Publication types

MeSH terms