

Liver gene therapy with intein-mediated F8 trans-splicing corrects mouse haemophilia A
- PMID: 35491676
- PMCID: PMC9174883
- DOI: 10.15252/emmm.202115199
Liver gene therapy with intein-mediated F8 trans-splicing corrects mouse haemophilia A
Abstract
Liver gene therapy with adeno-associated viral (AAV) vectors is under clinical investigation for haemophilia A (HemA), the most common inherited X-linked bleeding disorder. Major limitations are the large size of the F8 transgene, which makes packaging in a single AAV vector a challenge, as well as the development of circulating anti-F8 antibodies which neutralise F8 activity. Taking advantage of split-intein-mediated protein trans-splicing, we divided the coding sequence of the large and highly secreted F8-N6 variant in two separate AAV-intein vectors whose co-administration to HemA mice results in the expression of therapeutic levels of F8 over time. This occurred without eliciting circulating anti-F8 antibodies unlike animals treated with the single oversized AAV-F8 vector under clinical development. Therefore, liver gene therapy with AAV-F8-N6 intein should be considered as a potential therapeutic strategy for HemA.
Keywords: AAV vectors; haemophilia A; liver gene therapy; protein trans-splicing.
© 2022 The Authors. Published under the terms of the CC BY 4.0 license.
Figures
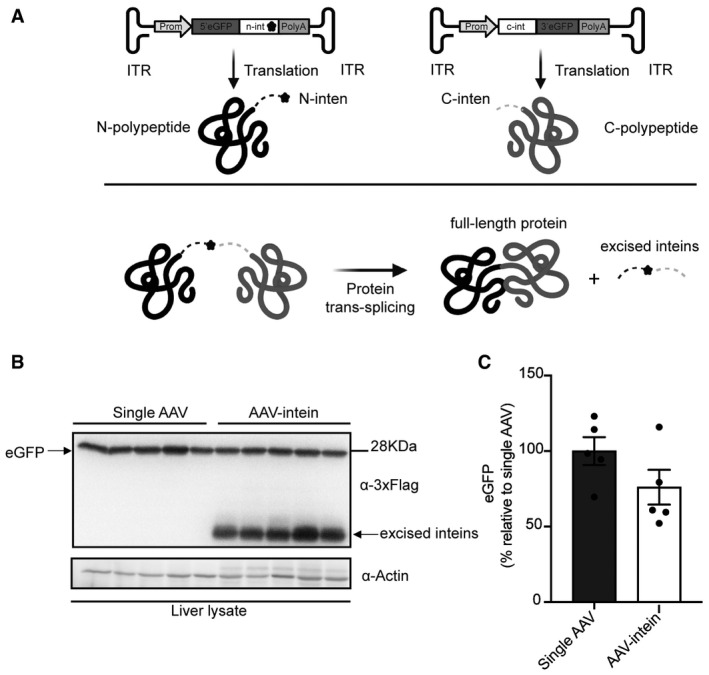
Schematic representation of the enhanced green fluorescent protein (eGFP) intein constructs and of the intein‐mediated protein trans‐splicing. ITR—inverted terminal repeats; Prom—promoter; 5’eGFP—5’eGFP coding sequence (CDS); n‐intein—N‐terminal of DnaE intein; star symbol—3xFlag tag; PolyA—short synthetic polyadenylation signal; c‐intein—C‐terminal of DnaE intein; 3’eGFP—3’ eGFP CDS.
Western blot analysis of liver lysates (100 µg) shows that intein‐mediated protein trans‐splicing efficiently reconstitutes full‐length eGFP. Single AAV: n = 5; AAV‐intein: n = 5. Arrows indicate both full‐length eGFP and excised inteins.
Quantification of eGFP protein bands. Values are reported as mean ± SEM. Each dot represents the eGFP protein band quantification from animals injected with either single AAV n = 5 or AAV‐intein n = 5.
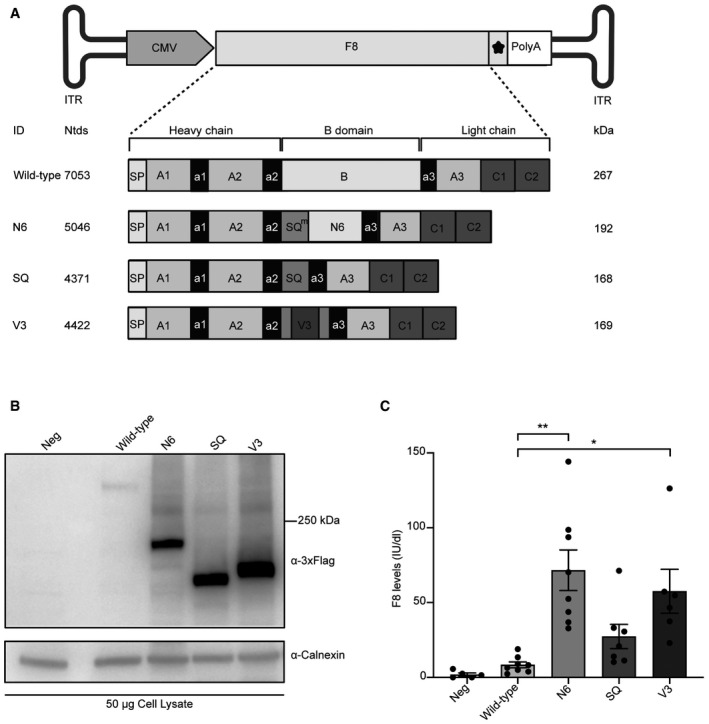
Schematic representation of the four different F8 variants that were cloned into an AAV plasmid: wild‐type F8; N6 containing 11 amino acids of the modified SQ amino acid linker (SQm) followed by the human N6 B domain; SQ containing the SQ amino acid linker; V3 containing the V3 peptide in the middle of the SQ linker. ITR—inverted terminal repeats; CMV—cytomegalovirus promoter; star symbol—3xFlag tag; PolyA—short synthetic polyadenylation signal; Ntds—nucleotides; SP—signal peptide. Details on the exact amino acid differences in the B domain can be found in Fig EV1.
Western blot analysis of lysates of HEK293 cells 72‐h post‐transfection with the various F8 variants. Neg—non‐transfected cells.
Chromogenic assay of F8 activity in the medium of transfected cells is reported as International Units/decilitre (IU/dl). Data are presented as mean ± SEM. Each dot within the same group corresponds to a biological replicate: Neg n = 5; Wild‐type n = 8; N6 n = 8; SQ n = 7; V3 n = 6. Significant differences between groups were assessed using the Kruskal–Wallis test followed by the post hoc analysis: Nemenyi’s All‐Pairs Rank Comparison Test. The Kruskal–Wallis test P = 2.88e‐05. **indicates the significant difference between the N6 and the Wild‐type groups: P ≤ 0.01. *indicates the significant difference between the V3 and the Wild‐type groups: P ≤ 0.05. All P‐values are reported in Appendix Table S1.
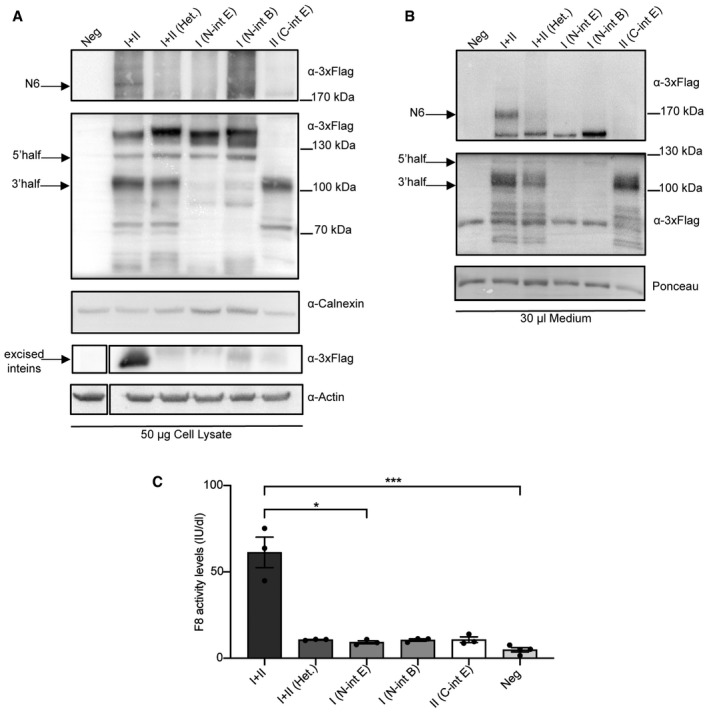
Western blot (WB) of protein lysates of HEK293 cells 72‐h post‐transfection (n = 3; biological replicates) with either Npu inteins or Heterologous (N‐intein DnaB + C‐intein DnaE) split‐inteins. I + II, N6 split‐intein proteins; I+II (Het.), heterologous split‐intein proteins; I, 5’N6 coding sequence (CDS)‐N‐DnaE protein; I (N‐int B), 5’N6 CDS‐N‐DnaB. II, C‐DnaE‐3’N6 CDS protein. Excised inteins (~12 kDa) are present only in the down part of the blot when I + II (Npu inteins) are provided. Arrows indicate the full‐length N6 protein, single halves and excised inteins.
WB of medium of the transfected cells showing the secreted proteins (n = 3; biological replicates). Arrows indicate the full‐length N6 protein as well as single halves and excised inteins.
Chromogenic assay performed on the medium of transfected cells to detect F8 activity levels reported as International Units/decilitre (IU/dl). Data are presented as mean ± SEM. Each dot within each group represents a different biological replicate (n): I + II n = 3; I + II (Het.) n = 3; I (N‐int E) n = 3; I (N‐int B) n = 3; II (C‐int E) n = 3; Neg n = 4. Significant differences between groups were assessed using Kruskal–Wallis rank‐sum test Kruskal−Wallis, P = 0.013. *indicates the significant difference between the I + II and the I (N‐int E) groups: P ≤ 0.05. ***indicates the significant difference between the I + II and the Neg groups: P ≤ 0.001. All P‐values are reported in Appendix Table S1.
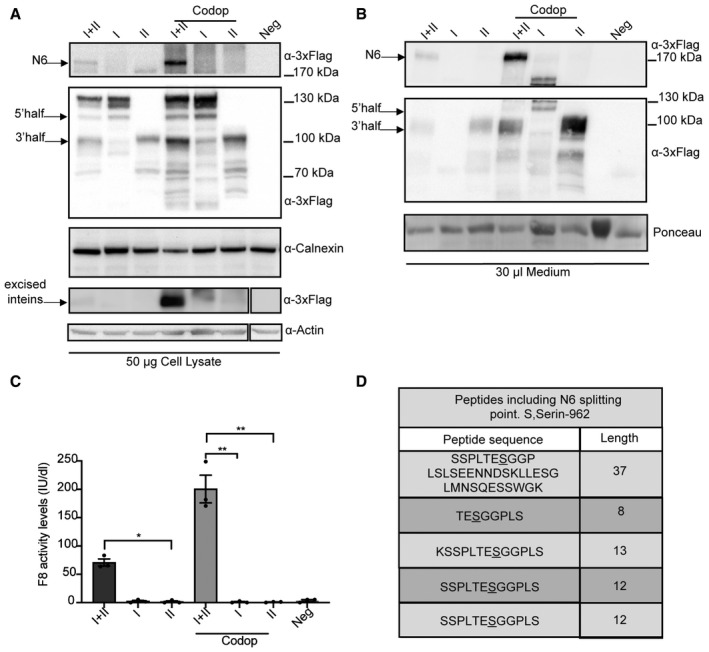
Western blot (WB) of protein lysates of HEK293 cells 72 hpt with the AAV‐N6 split‐intein plasmids and with the codon‐optimised set. I + II, N6 split‐intein proteins; I, 5’ N6 CDS‐N‐DnaE protein; II, C‐DnaE‐3’N6 CDS protein. (n = 3; biological replicates). Arrows indicate the full‐length N6 protein, excised inteins and both single halves. Codop: codon‐optimised.
WB of medium from the transfected cells showing increased secretion of the CodopN6 full‐length protein compared with the non‐codon‐optimised. (n = 3; biological replicates). Arrows indicate the full‐length N6 protein, excised inteins and both single halves.
Chromogenic assay performed on the medium from transfected cells to measure F8 activity levels reported as International Units/decilitre (IU/dl) (n = 3; biological replicates). Data are presented as mean ± SEM. Significant differences between groups were assessed using Kruskal–Wallis test P = 0.027. *indicates the significant difference between the I + II (N6 split‐intein) and the II (C‐DnaE‐3’N6 CDS) groups: P ≤ 0.05. **indicates the significant difference between the Codop I + II and the I (5’ N6 CDS‐N‐DnaE) codop groups: P ≤ 0.01. **indicates the significant difference between the Codop I + II and the II (C‐DnaE‐3’N6 CDS) codop groups: P ≤ 0.01. All P‐values are reported in Appendix Table S1.
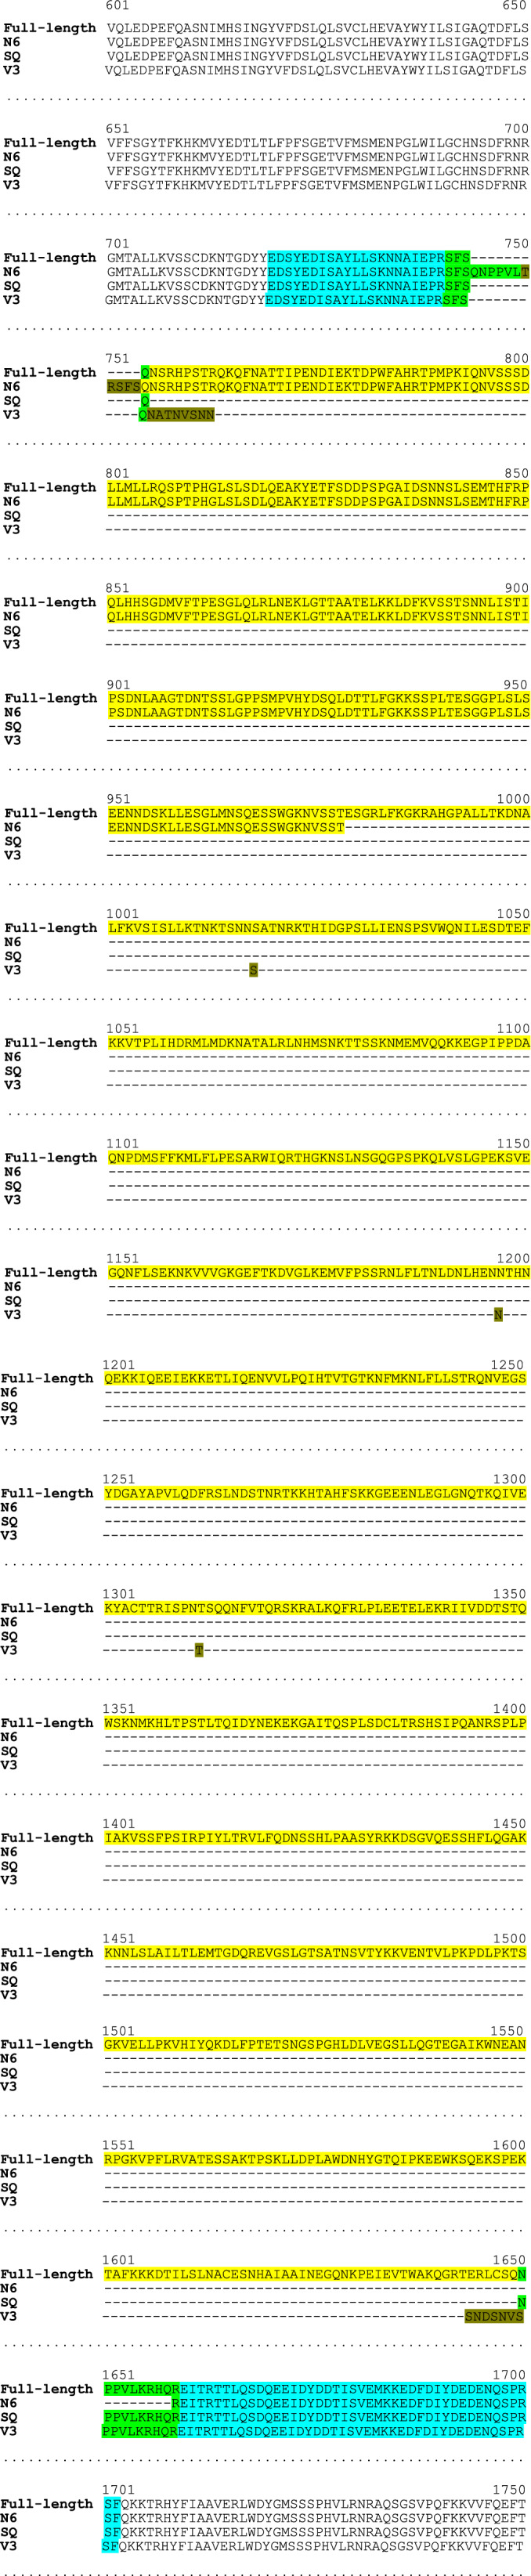
Peptides sequences obtained by LC‐MS analysis which include the N6 splitting point which is correctly reconstituted; S: Ser 962 (n = 5; biological replicates).
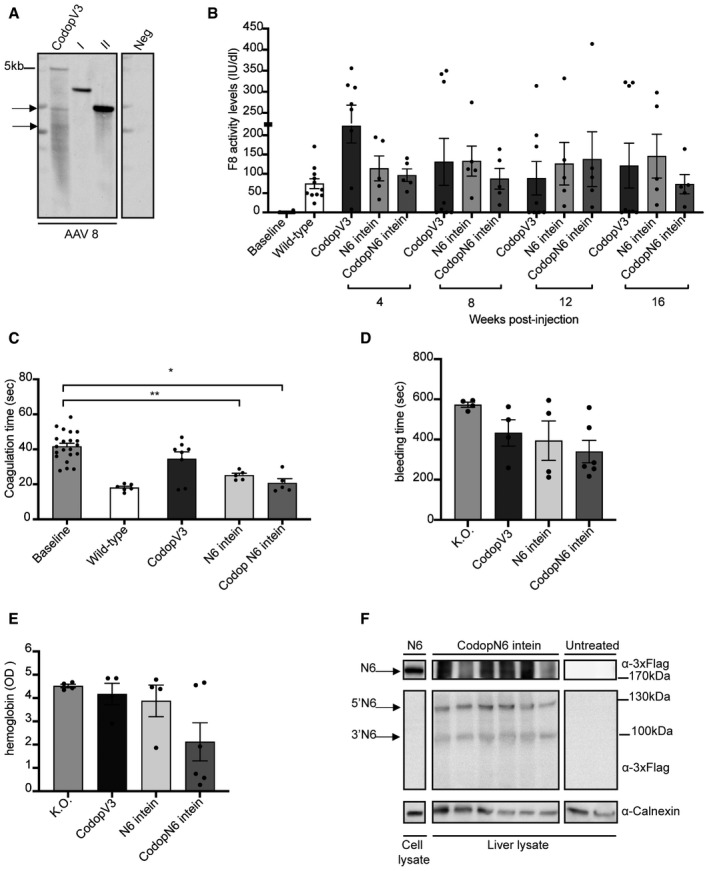
Alkaline gel Southern blot analysis of AAV DNA. AAV DNA was hybridised to a probe specific for the HLP promoter. Neg, AAV DNA treated with Dnase I; CodopV3, AAV‐CodopV3; I, AAV‐5’N6‐N‐intein; II, AAV‐C‐intein‐3’ N6.
Chromogenic assay performed on plasma samples to detect F8 activity in AAV‐treated mice compared to controls groups. Data are presented as mean ± SEM. The same animals were analysed at the various time points. Each dot within the same group and within different groups of treatment corresponds to a single animal. The baseline includes all animals (n = 20) before the treatment: CodopV3: n = 8; N6 intein: n = 5; CodopN6 intein: n = 5. The statistical difference between groups has been assessed at 4‐week post‐injection (wpi) with the one‐way ANOVA P = 0.056; at 8 wpi with the Kruskal–Wallis test P = 0.68; at 12 wpi with the Kruskal–Wallis test P = 0.45; at 16 wpi with the Kruskal–Wallis test P = 0.58. All P‐values are reported in Appendix Table S1.
Activated partial thromboplastin time (aPTT) assay performed on plasma samples both at the baseline and at the last time point of the analysis (16 wpi). Data are presented as mean ± SEM. Each dot within each group of treatment corresponds to different animals: The baseline includes all animals before the treatment n = 21; CodopV3: n = 8; N6 intein: n = 5; CodopN6 intein: n = 5. Significant differences between groups were assessed using the Kruskal–Wallis test. **indicates the significant difference between the baseline and the N6 intein groups: P ≤ 0.01.*indicates the significant difference between the baseline and the CodopN6 intein groups: P ≤ 0.05. All P‐values are reported in Appendix Table S1.
Tail‐clip assay reported as bleeding time in seconds. Significant differences between groups were assessed using one‐way ANOVA test P‐value is = 0.11. Data are presented as mean ± SEM. Each dot corresponds to a different animal. Knockout (K.O.) group: n = 4; CodopV3: n = 4; N6 intein: n = 4; CodopN6 intein: n = 6.
Haemoglobin content measured as optical density (OD) at 416 nm after the tail‐clip assay. Significant differences between groups were assessed using one‐way ANOVA test. Data are reported as mean ± SEM. Each dot corresponds to a single animal. Knockout (K.O.) group: n = 4; CodopV3: n = 4; N6 intein: n = 4; CodopN6 intein: n = 6.
Western blot analysis of liver lysates (100 µg) from either CodopN6 intein‐treated mice (n = 6) or untreated haemophilic mice (n = 2). A lysate from HEK293 cells transfected with the N6 full‐length plasmid was used as positive control (50 µg). Arrows point at N6 full‐length protein (N6), the 5’ half of N6 (5’N6) and 3’ half of N6 (3’N6).
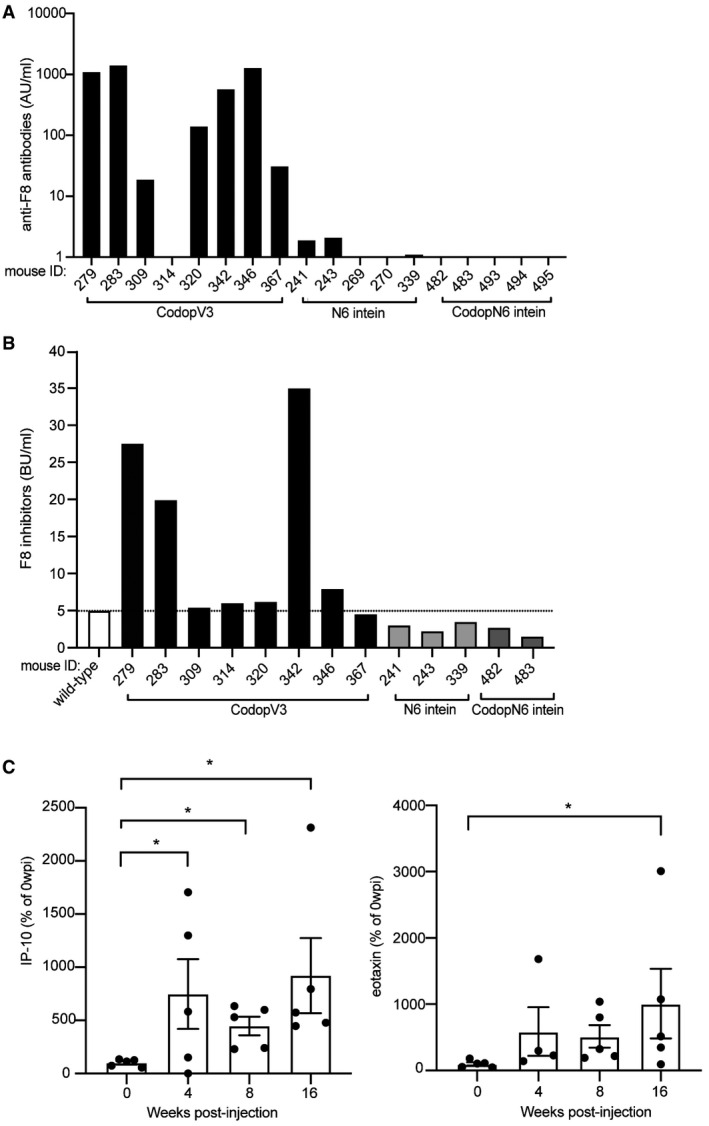
The amount of anti‐F8 antibodies analysed by indirect ELISA is reported in Arbitrary Units/millilitre (AU/ml). Each numbered bar represents a single mouse. CodopV3, AAV‐CodopV3 injected group n = 8; N6 intein, AAV‐N6 intein injected group n = 5; CodopN6 intein, AAV‐CodopN6 intein injected group n = 5. Significant differences were assessed as follow: Paired T‐test has been used for CodopV3 n = 5: P ≤ 0.001; Wilcoxon test for CodopV3 n = 3: P ≤ 0.05; Paired T‐test has been used for N6 intein n = 5: P ≤ 0.05; Paired T‐test has been used for CodopN6 intein n = 5 P ≤ 0.01.
Bethesda assay performed on plasma samples mice injected with AAV‐CodopV3; on the plasma of animals injected with AAV‐N6 intein n = 3 and the plasma of animals injected with AAV‐CodopN6 intein n = 2; plasma of a wild‐type animal was used as a control. The dotted line indicates the threshold above which anti‐F8 antibodies are considered inhibitors.
Pro‐inflammatory cytokines levels followed over time and reported as percentage of the baseline levels (time point before the injection). Data are represented as mean ± SEM. Five animals belonging to the CodopV3 group were analysed. Significant differences were assessed using the Kruskal−Wallis test; for IP‐10: *indicates the P ≤ 0.05 between 0 and 4 wpi; * indicates the P ≤ 0.05 between 0 and 8 wpi; *indicates the P ≤ 0.05 between 0 and 16 wpi. (n = 20); for eotaxin: *indicates the P ≤ 0.05. All P‐values are reported in Appendix Table S1.
References
-
- Antonarakis SE, Kazazian HH, Tuddenham EGD (1995) Molecular etiology of factor VIII deficiency in hemophilia A. Hum Mutat 5: 1–22 - PubMed
-
- Boström EA, Kindstedt E, Sulniute R, Palmqvist PY, Majster M, Holm CK, Zwicker S, Clark R, Önell S, Johansson I et al (2015) Increased eotaxin and MCP‐1 levels in serum from individuals with periodontitis and in human gingival fibroblasts exposed to pro‐inflammatory cytokines. PLoS One 10: 1–19 - PMC - PubMed
Publication types
MeSH terms
LinkOut - more resources
Full Text Sources
Other Literature Sources
Medical
Miscellaneous
