. 2023 Jan;19(1):256-277.
doi: 10.1080/15548627.2022.2072054. Epub 2022 May 18.

Tubular cells produce FGF2 via autophagy after acute kidney injury leading to fibroblast activation and renal fibrosis

Affiliations

Tubular cells produce FGF2 via autophagy after acute kidney injury leading to fibroblast activation and renal fibrosis

Man J Livingston et al. Autophagy. 2023 Jan.

Abstract

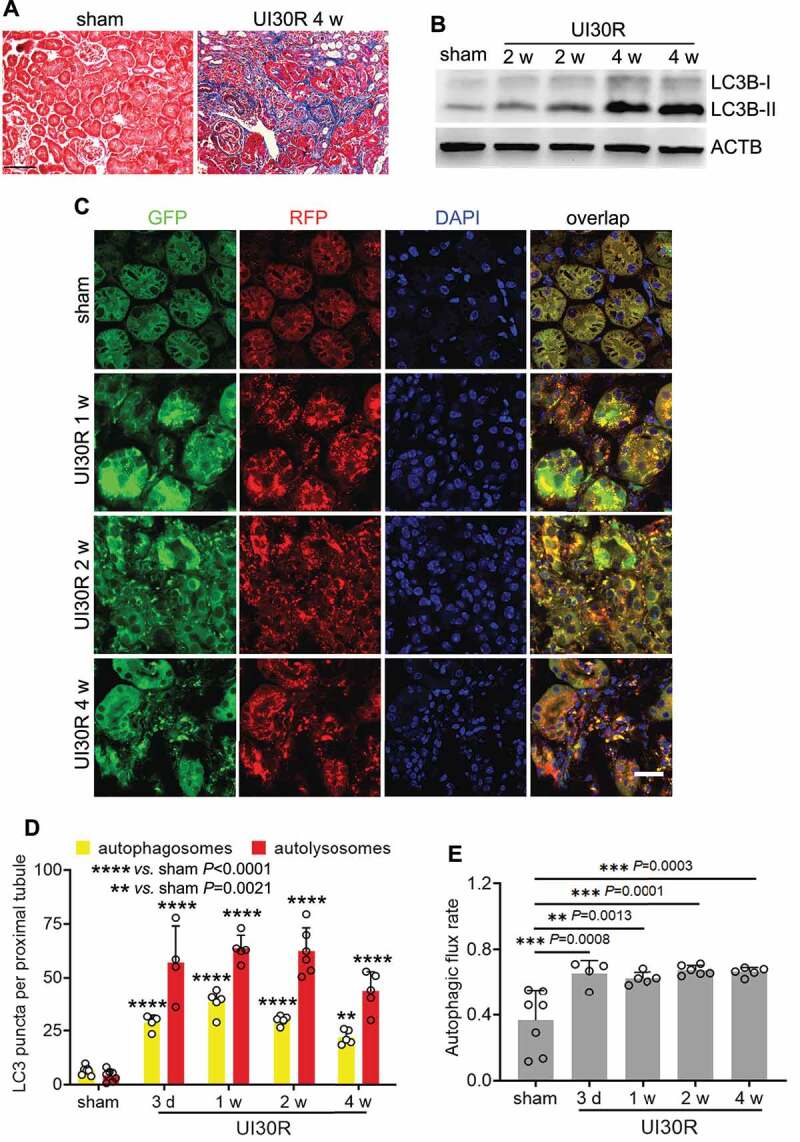
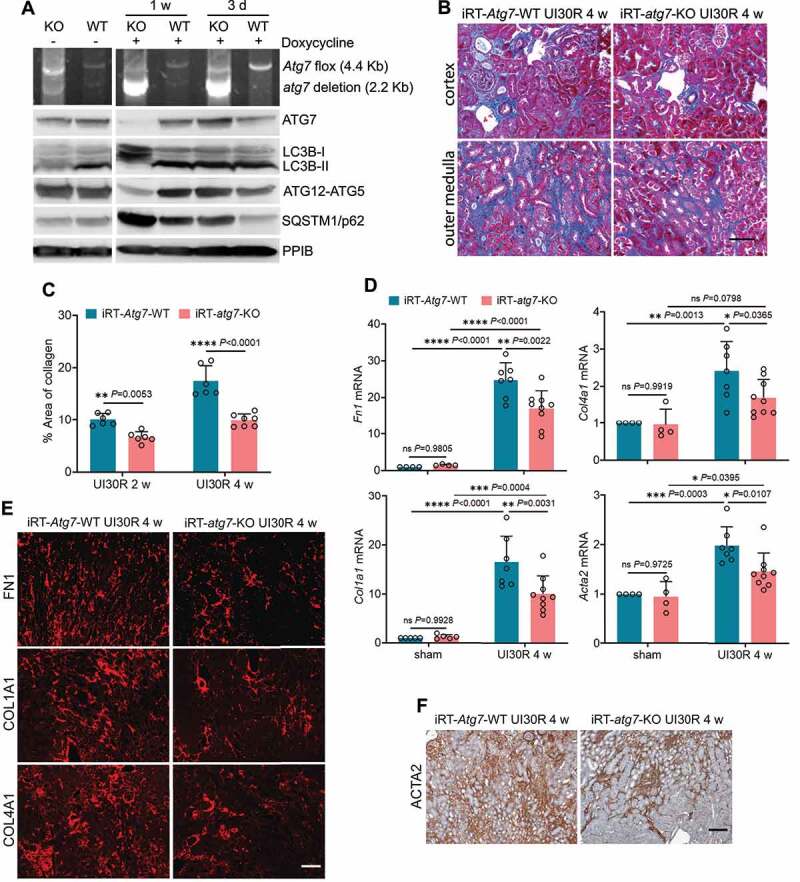
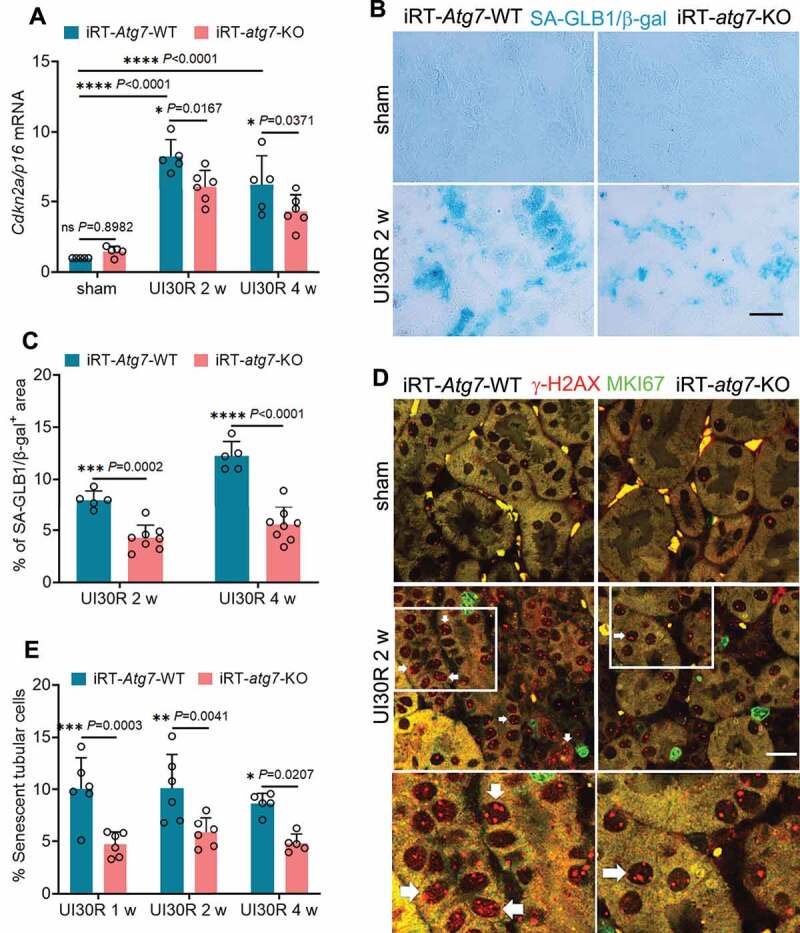
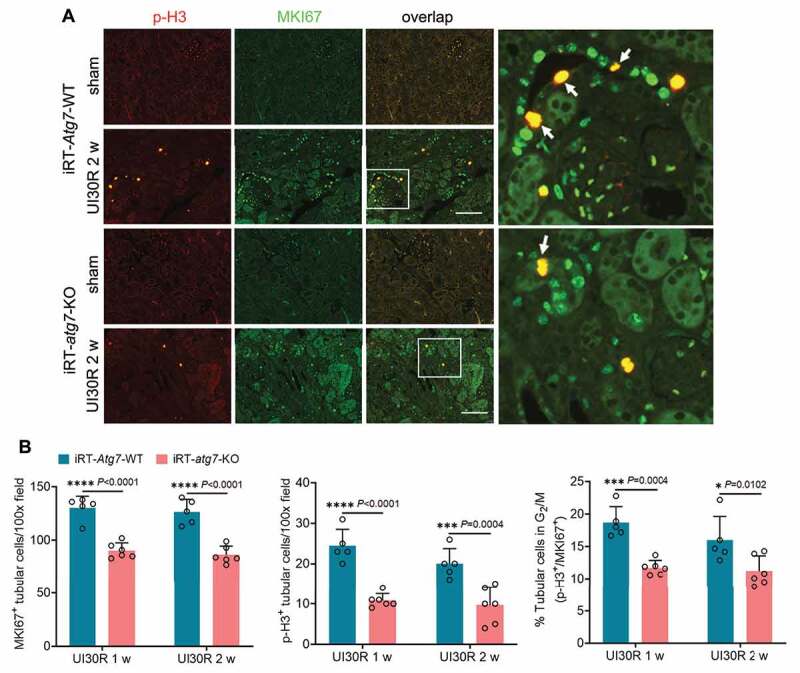
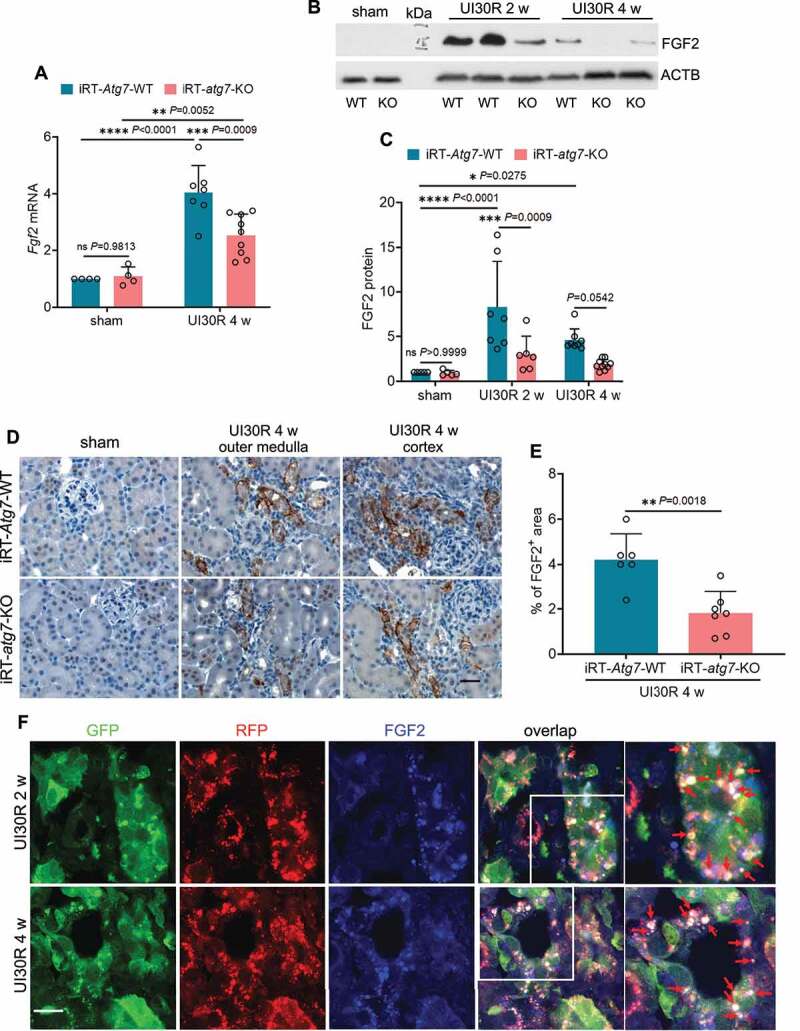
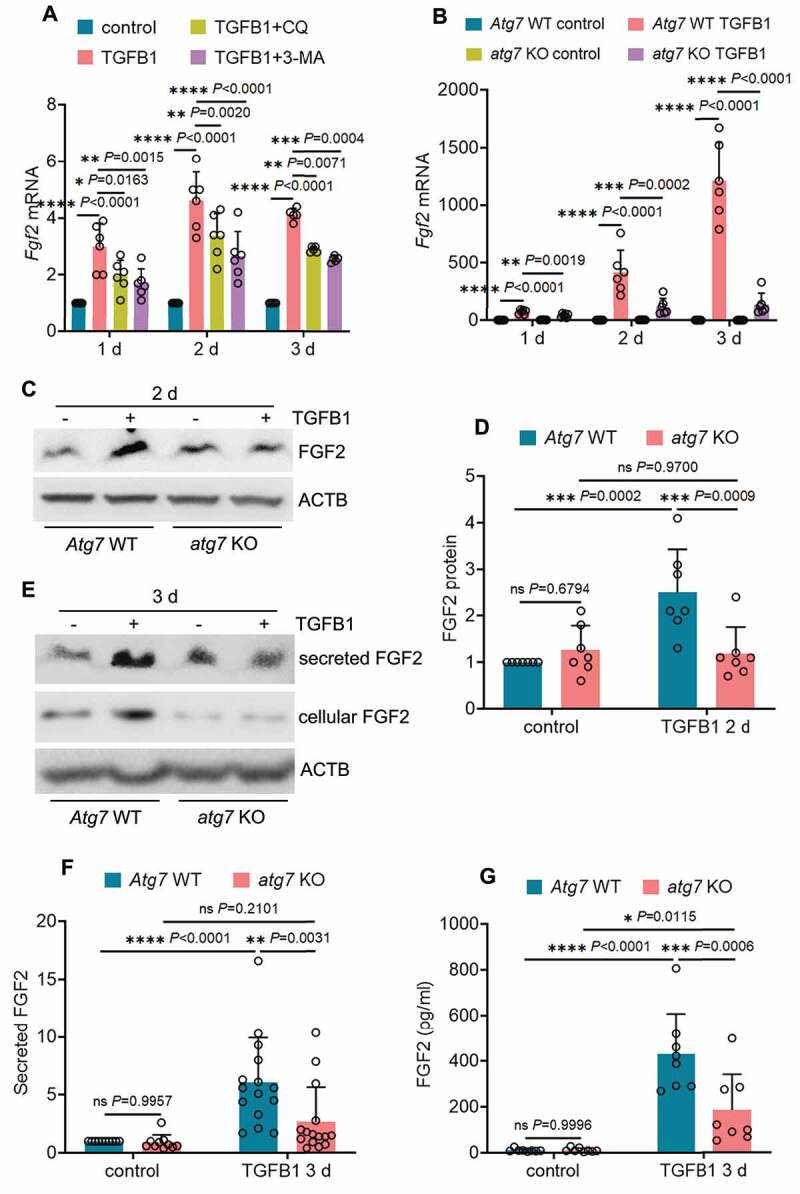
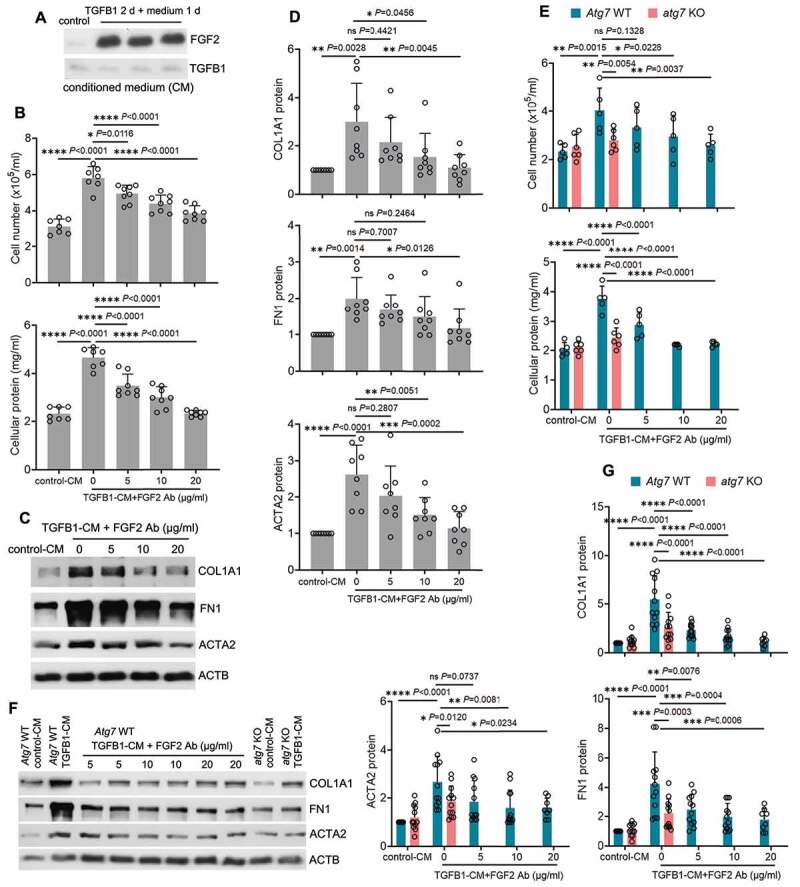
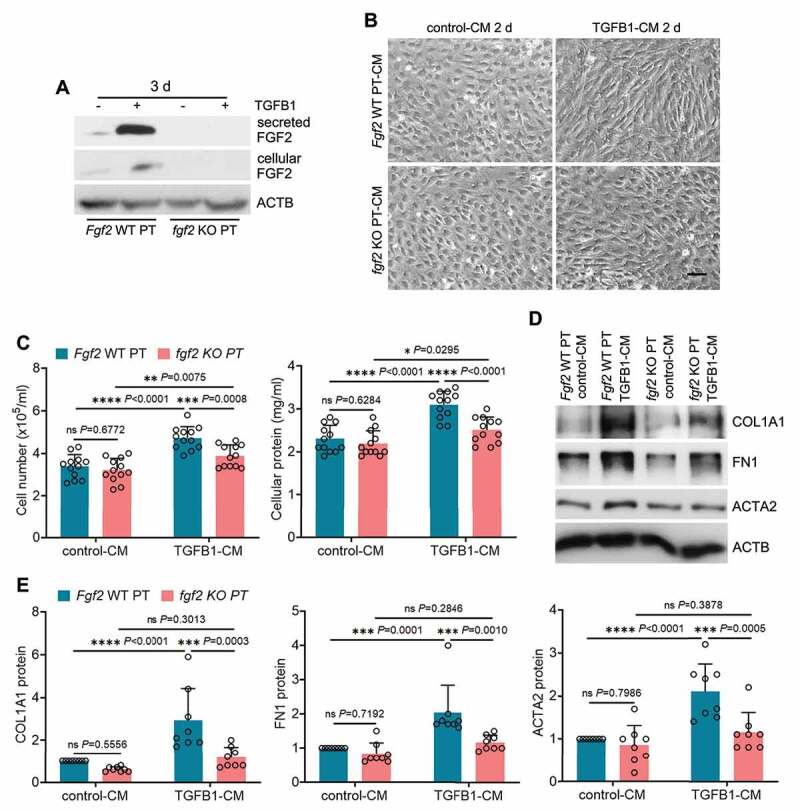
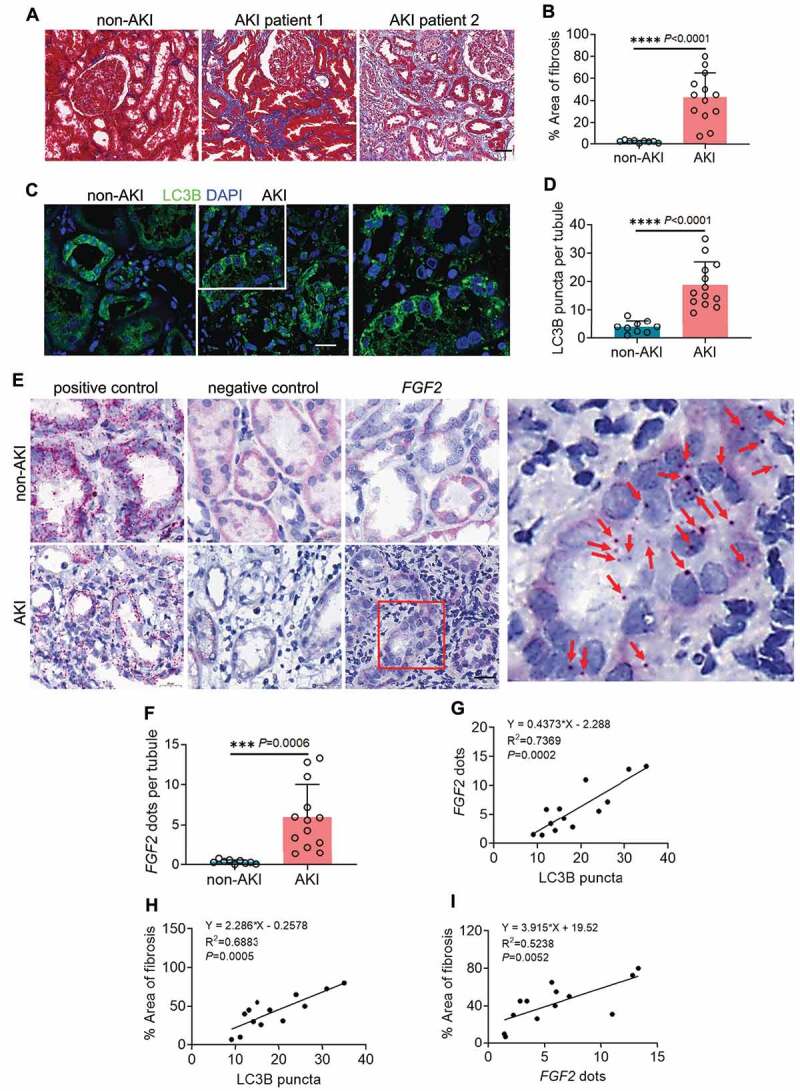
Following acute kidney injury (AKI), renal tubular cells may stimulate fibroblasts in a paracrine fashion leading to interstitial fibrosis, but the paracrine factors and their regulation under this condition remain elusive. Here we identify a macroautophagy/autophagy-dependent FGF2 (fibroblast growth factor 2) production in tubular cells. Upon induction, FGF2 acts as a key paracrine factor to activate fibroblasts for renal fibrosis. After ischemic AKI in mice, autophagy activation persisted for weeks in renal tubular cells. In inducible, renal tubule-specific atg7 (autophagy related 7) knockout (iRT-atg7-KO) mice, autophagy deficiency induced after AKI suppressed the pro-fibrotic phenotype in tubular cells and reduced fibrosis. Among the major cytokines, tubular autophagy deficiency in iRT-atg7-KO mice specifically diminished FGF2. Autophagy inhibition also attenuated FGF2 expression in TGFB1/TGF-β1 (transforming growth factor, beta 1)-treated renal tubular cells. Consistent with a paracrine action, the culture medium of TGFB1-treated tubular cells stimulated renal fibroblasts, and this effect was suppressed by FGF2 neutralizing antibody and also by fgf2- or atg7-deletion in tubular cells. In human, compared with non-AKI, the renal biopsies from post-AKI patients had higher levels of autophagy and FGF2 in tubular cells, which showed significant correlations with renal fibrosis. These results indicate that persistent autophagy after AKI induces pro-fibrotic phenotype transformation in tubular cells leading to the expression and secretion of FGF2, which activates fibroblasts for renal fibrosis during maladaptive kidney repair.Abbreviations: 3-MA: 3-methyladnine; ACTA2/α-SMA: actin alpha 2, smooth muscle, aorta; ACTB/β-actin: actin, beta; AKI: acute kidney injury; ATG/Atg: autophagy related; BUN: blood urea nitrogen; CCN2/CTGF: cellular communication network factor 2; CDKN2A/p16: cyclin dependent kinase inhibitor 2A; CKD: chronic kidney disease; CM: conditioned medium; COL1A1: collagen, type I, alpha 1; COL4A1: collagen, type IV, alpha 1; CQ: chloroquine; ECM: extracellular matrix; eGFR: estimated glomerular filtration rate; ELISA: enzyme-linked immunosorbent assay; FGF2: fibroblast growth factor 2; FN1: fibronectin 1; FOXO3: forkhead box O3; GAPDH: glyceraldehyde-3-phosphate dehydrogenase; HAVCR1/KIM-1: hepatitis A virus cellular receptor 1; IHC: immunohistochemistry; IRI: ischemia-reperfusion injury; ISH: in situ hybridization; LTL: lotus tetragonolobus lectin; MAP1LC3B/LC3B: microtubule-associated protein 1 light chain 3 beta; MTOR: mechanistic target of rapamycin kinase; PDGFB: platelet derived growth factor, B polypeptide; PPIB/cyclophilin B: peptidylprolyl isomerase B; RT-qPCR: real time-quantitative PCR; SA-GLB1/β-gal: senescence-associated galactosidase, beta 1; SASP: senescence-associated secretory phenotype; sCr: serum creatinine; SQSTM1/p62: sequestosome 1; TASCC: TOR-autophagy spatial coupling compartment; TGFB1/TGF-β1: transforming growth factor, beta 1; VIM: vimentin.

Keywords: Autophagy; FGF2; interstitial fibrosis; kidney repair; proximal tubule; renal ischemia-reperfusion.


Conflict of interest statement

All authors declare that they have no conflict of interest.

Figures

Figure 1.
Figure 1.
Autophagy is persistently activated in renal tubular cells during maladaptive kidney repair after ischemic AKI in mice. C57BL/6 mice underwent sham operation (n = 4) or 30-min unilateral renal ischemia followed by reperfusion for up to 4 weeks (n = 8). Left kidneys were harvested at the indicated time points. (A) Masson’s trichrome staining. Scale bar: 50 µm. (B) LC3B immunoblot. (C) Autophagy reporter mice (CAG-RFP-GFP-LC3) underwent sham operation (n = 7) or 30-min unilateral renal ischemia followed by reperfusion for up to 4 weeks (n = 4 to 6 for each time point). Left kidneys were harvested for confocal microscopy of autophagosomes and autolysosomes in renal tubules. Scale bar: 15 µm. (D) Quantification of the numbers of autophagosomes and autolysosomes per proximal tubule. (E) Quantification of autophagic flux rate. Data in (D and E) are presented as mean ± SD. For statistics, two-way ANOVA with multiple comparisons was used for (D). One-way ANOVA with multiple comparisons was used for (E).
Figure 2.
Figure 2.
Tubular autophagy deficiency in iRT-atg7-KO mice inhibits interstitial fibrosis during post-ischemic kidney repair. (A) Top panel: genomic DNA was extracted from WT (n = 6) and iRT-atg7-KO (n = 6) kidneys at the indicated time points after doxycycline treatment for PCR detection of Atg7 flox and deletion alleles. Other panels: tissue lysates were collected from WT and iRT-atg7-KO kidneys for immunoblots of ATG7, LC3B, ATG5 (ATG12 conjugated), and SQSTM1/p62. (B-F) WT and iRT-atg7-KO mice underwent sham operation or 30-min unilateral renal ischemia followed by reperfusion for up to 4 weeks. Left kidneys were harvested at the indicated time points for histology, RT-qPCR and immunofluorescence or IHC. (B) Masson’s trichrome staining. Scale bar: 50 µm. (C) Quantification of collagen-stained areas (UI30R 2 w: WT n = 6, KO n = 6; UI30R 4 w: WT n = 6, KO n = 7). (D) RT-qPCR assay of Fn1, Col1a1, Col4a1, and Acta2 mRNA (sham: WT n = 4 or 5, KO n = 4 or 5; UI30R 4 w: WT n = 7, KO n = 9). (E and F) Immunofluorescence or IHC of FN1, COL1A1, COL4A1 and ACTA2 (WT n = 7, KO n = 7). Scale bar: 100 µm. Data in (C and D) are presented as mean ± SD. Two-way ANOVA with multiple comparisons was used for statistics.
Figure 3.
Figure 3.
Tubular autophagy deficiency in iRT-atg7-KO mice suppresses senescent changes in renal tubules during post-ischemic kidney repair. WT and iRT-atg7-KO mice underwent sham operation or 30-min unilateral renal ischemia followed by reperfusion for up to 4 weeks. Left kidneys were harvested at the indicated time points for senescence analysis. (A) RT-qPCR of Cdkn2a/p16 mRNA (n = 5 or 6 for each group). (B) SA-GLB1/β-gal staining. Scale bar: 50 µm. (C) Quantification of SA-GLB1/β-gal-positive stained areas (UI30R 2 w: WT n = 5, KO n = 8; UI30R 4 w: WT n = 5, KO n = 8). (D) γ-H2AX and MKI67 co-immunofluorescence. Scale bar: 20 µm. White arrows indicate typical senescent tubular cells with 4 or more γ-H2AX-positive foci and MKI67-negative. (E) Quantification of the percentage of senescent tubular cells (n = 5 or 6 for each group). Data in (A, C and E) are presented as mean ± SD. Two-way ANOVA with multiple comparisons was used for statistics.
Figure 4.
Figure 4.
Tubular autophagy deficiency in iRT-atg7-KO mice reduces G2/M cell cycle arrest in renal tubules during post-ischemic kidney repair. WT and iRT-atg7-KO mice underwent sham operation or 30-min unilateral renal ischemia followed by reperfusion for up to 4 weeks. Left kidneys were harvested at the indicated time points. (A) p-H3 and MKI67 double immunofluorescence. Scale bar: 100 µm. White arrows indicate renal tubular cells with positive co-staining of p-H3 and MKI67. (B) Quantification of the numbers of MKI67-positive cells, p-H3-positive cells, and the percentage of tubular cells arrested in G2/M (n = 5 or 6 for each group). Data in (B) are presented as mean ± SD. Two-way ANOVA with multiple comparisons was used for statistics.
Figure 5.
Figure 5.
Autophagy deficiency suppresses FGF2 production in renal tubules during post-ischemic kidney repair. WT and iRT-atg7-KO mice underwent sham operation or 30-min unilateral renal ischemia followed by reperfusion for up to 4 weeks. Left kidneys were harvested at the indicated time points for RT-qPCR, immunoblot and IHC of FGF2. (A) RT-qPCR assay of Fgf2 mRNA (sham: WT n = 4, KO n = 4; UI30R 4 w: WT n = 7, KO n = 9). (B and C) FGF2 immunoblot and densitometry (sham: WT n = 5, KO n = 5; UI30R 2 w: WT n = 7, KO n = 6; UI30R 4 w: WT n = 8, KO n = 10). (D) FGF2 IHC. Scale bar: 20 µm. (E) Quantification of FGF2-positive stained areas (WT n = 6, KO n = 7). (F) Autophagy reporter mice (CAG-RFP-GFP-LC3) underwent 30-min unilateral renal ischemia followed by reperfusion for 2 weeks (n = 3) and 4 weeks (n = 3). Left kidneys were collected for cryo-sectioning and FGF2 immunofluorescence. Scale bar: 15 µm. Red arrows indicate FGF2-positive granules co-localized with autophagosomes. Data in (A, C and E) are presented as mean ± SD. For statistics, two-way ANOVA with multiple comparisons was used for (A and C). 2-tailed, unpaired Student t-test was used for (E).
Figure 6.
Figure 6.
Autophagy inhibition reduces the production and secretion of FGF2 in renal proximal tubular cells during TGFB1 treatment. (A) Subconfluent BUMPT cells were exposed to 5 ng/ml TGFB1 in serum-free DMEM for up to 3 days alone or with 2 µM CQ or 1 mM 3-MA. Control cells were kept in serum-free medium without TGFB1. Cells were collected at the indicated time points for RT-qPCR assay of Fgf2 mRNA (n = 6 experiments). (B) Subconfluent WT and atg7 KO mouse proximal tubular cells were exposed to 5 ng/ml TGFB1 in serum-free DMEM for up to 3 days. Control cells were kept in serum-free medium without TGFB1. Cells were collected at the indicated time points for RT-qPCR assay of Fgf2 mRNA (n = 6 experiments). (C and D) Subconfluent WT and atg7 KO mouse proximal tubular cells were exposed to 5 ng/ml TGFB1 in serum-free DMEM for 2 days. Control cells were kept in serum-free medium without TGFB1. Cell lysates were collected for FGF2 immunoblot and densitometry (n = 7 experiments). (E) Subconfluent WT and atg7 KO mouse proximal tubular cells were exposed to 5 ng/ml TGFB1 in serum-free DMEM for 3 days. Control cells were kept in serum-free medium without TGFB1. Both cell lysates and culture media were collected for immunoblots of cellular and secreted FGF2 (n = 10 experiments). (F) Densitometry of secreted FGF2 protein. (G) Cells and treatments were described in (E). Culture media were collected for FGF2 ELISA (n = 6 experiments). Data in (A, B, D, F and G) are presented as mean ± SD. Two-way ANOVA with multiple comparisons was used for statistics.
Figure 7.
Figure 7.
FGF2 neutralizing antibody attenuates the paracrine effect of renal tubular cells on fibroblasts. (A) Subconfluent BUMPT cells were exposed to 5 ng/ml TGFB1 in serum-free DMEM for 2 days. Control cells were kept in serum-free medium without TGFB1. The old culture media for both TGFB1-treated and control cells were replaced by fresh media free of TGFB1 at the end of day 2, incubated with the cells for an additional day, and then collected as tubular cell-CM for immunoblots of secreted FGF2 (n = 3 experiments). Note that only residual amount of TGFB1 was detected in the CMs. (B-D) Subconfluent NRK-49F fibroblasts were incubated with CM either from control BUMPT cells (control-CM) or TGFB1-treated BUMPT cells (TGFB1-CM) for 2 days in the presence of FGF2 neutralizing antibody at 5, 10, 20 µg/ml or mouse IgG (indicated as FGF2 Ab of 0 µg/ml) as negative control (n = 7 experiments). (B) Cell number counting and cellular protein measurement. (C) Immunoblots of COL1A1, FN1 and ACTA2. (D) Densitometry of COL1A1, FN1 and ACTA2 proteins. (E-G) Subconfluent NRK-49F fibroblasts were incubated with Atg7 WT control-CM, Atg7 WT TGFB1-CM, atg7 KO control-CM, or atg7 KO TGFB1-CM for 2 days. FGF2 neutralizing antibody was added to Atg7 WT TGFB1-CM at the concentrations of 5, 10, 20 µg/ml or mouse IgG (indicated as FGF2 Ab of 0 µg/ml) was used as negative control (n = 5 experiments). (E) Cell number counting and cellular protein measurement. (F) Immunoblots of COL1A1, FN1 and ACTA2. (G) Densitometry of COL1A1, FN and ACTA2 proteins. Data in (B, D, E and G) are presented as mean ± SD. For statistics, one-way ANOVA with multiple comparisons was used for (B and D). Both one-way and two-way ANOVA with multiple comparisons were used for (E and G).
Figure 8.
Figure 8.
Fgf2 deficiency diminishes the paracrine effect of renal tubular cells on fibroblasts. (A) Subconfluent isolated primary proximal tubular cells from WT (Fgf2 WT PT) and fgf2 KO mice (fgf2 KO PT) were exposed to 5 ng/ml TGFB1 in serum-free DMEM for 3 days. Control cells were kept in serum-free medium without TGFB1. Both cell lysates and culture media were collected for immunoblots of cellular and secreted FGF2 (n = 3 experiments). (B-E) Subconfluent NRK-49F fibroblasts were incubated with CM from control WT primary proximal tubular cells (Fgf2 WT PT control-CM), TGFB1-treated WT primary proximal tubular cells (Fgf2 WT PT TGFB1-CM), control KO primary proximal tubular cells (fgf2 KO PT control-CM), or TGFB1-treated KO primary proximal tubular cells (fgf2 KO PT TGFB1-CM) for 2 days (n = 8 experiments). (B) Cell morphology was monitored by phase contrast microscopy. Scale bar: 100 µm. (C) Cell number counting and cellular protein measurement. (D) Immunoblots of COL1A1, FN1 and ACTA2. (E) Densitometry of COL1A1, FN1 and ACTA2 proteins. Data in (C and E) are presented as mean ± SD. Two-way ANOVA with multiple comparisons was used for statistics.
Figure 9.
Figure 9.
Induction of tubular autophagy and FGF2 in renal biopsies from post-AKI patients correlates with kidney interstitial fibrosis. Renal biopsies from non-AKI patient controls (n = 9) and post-AKI patients (n = 13) were assessed for the following: (A) Masson’s trichrome staining. Scale bar: 50 µm. (B) Quantification of fibrotic areas. (C) LC3B immunofluorescence. Scale bar: 15 µm. (D) Quantification of the numbers of LC3B puncta per renal tubule. (E) FGF2 ISH. Scale bar: 20 µm. Red arrows indicate FGF2-positive dots in renal tubular cells. (F) Quantification of the numbers of FGF2 dots per renal tubule. Correlation analysis between (G) LC3B puncta and FGF2 dots, (H) LC3B puncta and fibrotic areas, (I) FGF2 dots and fibrotic areas in post-AKI patients (n = 13). Data in (B, D and F) are presented as mean ± SD. For statistics, 2-tailed, unpaired Student t-test was used for (B, D and F). Pearson correlation analysis followed by simple linear regression was used for (G, H and I).

References

    1. Ronco C, Bellomo R, Kellum JA.. Acute kidney injury. Lancet. 2019;394:1949–1964. - PubMed
    1. Mehta RL, Burdmann EA, Cerda J, et al. Recognition and management of acute kidney injury in the International Society of Nephrology 0by25 global snapshot: a multinational cross-sectional study. Lancet. 2016;387:2017–2025. - PubMed
    1. See EJ, Jayasinghe K, Glassford N, et al. Long-term risk of adverse outcomes after acute kidney injury: a systematic review and meta-analysis of cohort studies using consensus definitions of exposure. Kidney Int. 2019;95:160–172. - PubMed
    1. Chawla LS, Eggers PW, Star RA, et al. Acute kidney injury and chronic kidney disease as interconnected syndromes. N Engl J Med. 2014;371:58–66. - PMC - PubMed
    1. Coca SG, Singanamala S, Parikh CR. Chronic kidney disease after acute kidney injury: a systematic review and meta-analysis. Kidney Int. 2012;81:442–448. - PMC - PubMed

Publication types

Substances