. 2022 May 10;145(19):1480-1496.
doi: 10.1161/CIRCULATIONAHA.121.057757. Epub 2022 May 1.

Exercise Causes Arrhythmogenic Remodeling of Intracellular Calcium Dynamics in Plakophilin-2-Deficient Hearts

Affiliations

Exercise Causes Arrhythmogenic Remodeling of Intracellular Calcium Dynamics in Plakophilin-2-Deficient Hearts

Chantal J M van Opbergen et al. Circulation. .

Abstract

Background: Exercise training, and catecholaminergic stimulation, increase the incidence of arrhythmic events in patients affected with arrhythmogenic right ventricular cardiomyopathy correlated with plakophilin-2 (PKP2) mutations. Separate data show that reduced abundance of PKP2 leads to dysregulation of intracellular Ca2+ (Ca2+i) homeostasis. Here, we study the relation between excercise, catecholaminergic stimulation, Ca2+i homeostasis, and arrhythmogenesis in PKP2-deficient murine hearts.

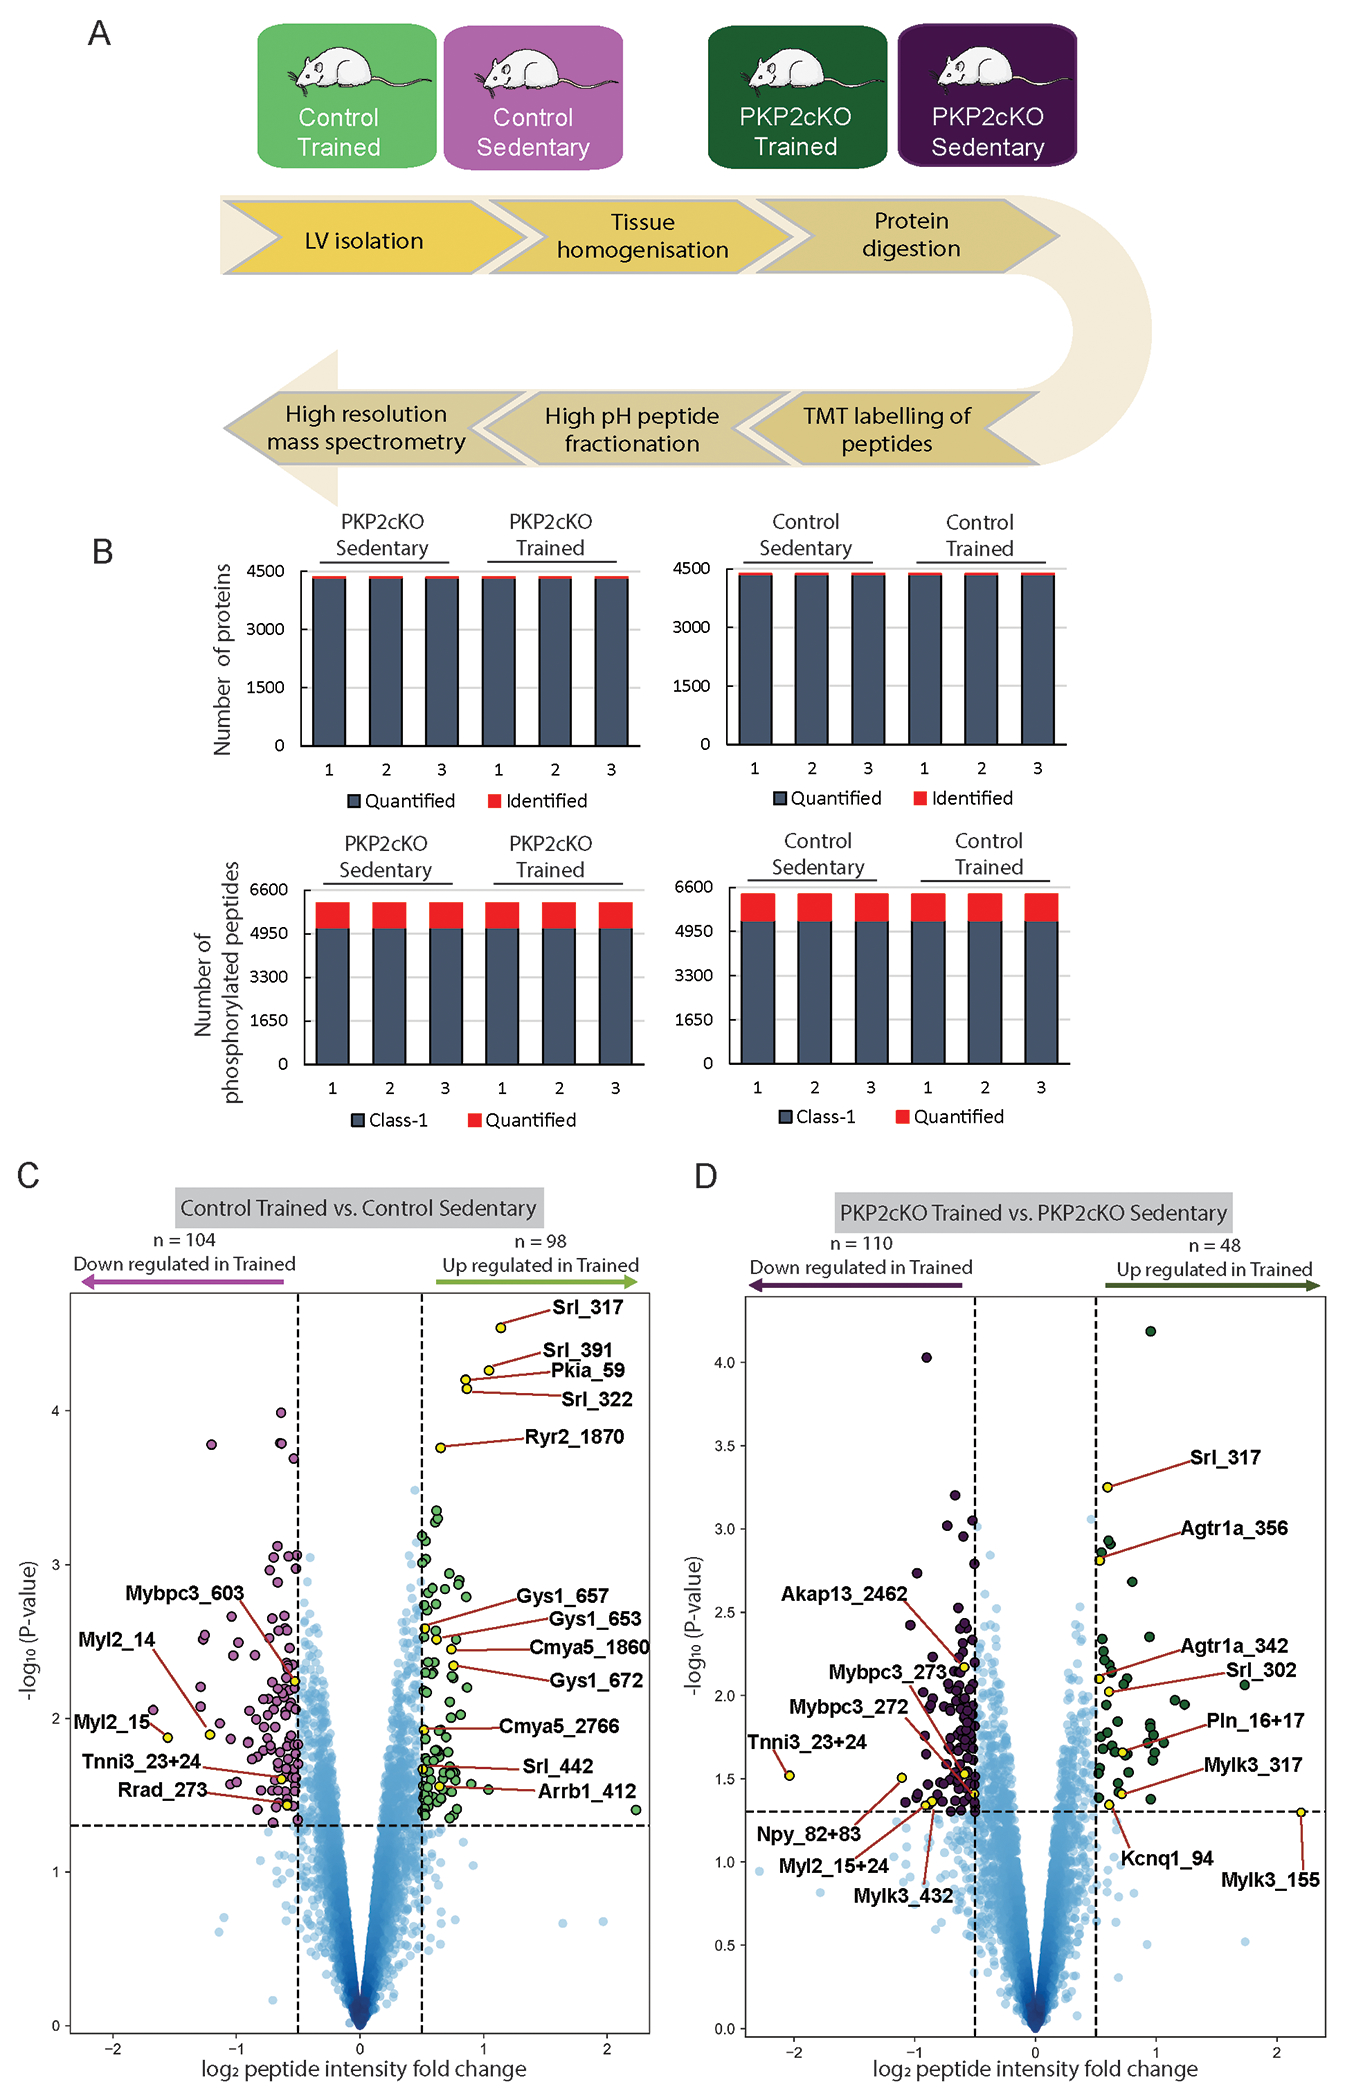
Methods: Experiments were performed in myocytes from a cardiomyocyte-specific, tamoxifen-activated, PKP2 knockout murine line (PKP2cKO). For training, mice underwent 75 minutes of treadmill running once per day, 5 days each week for 6 weeks. We used multiple approaches including imaging, high-resolution mass spectrometry, electrocardiography, and pharmacological challenges to study the functional properties of cells/hearts in vitro and in vivo.

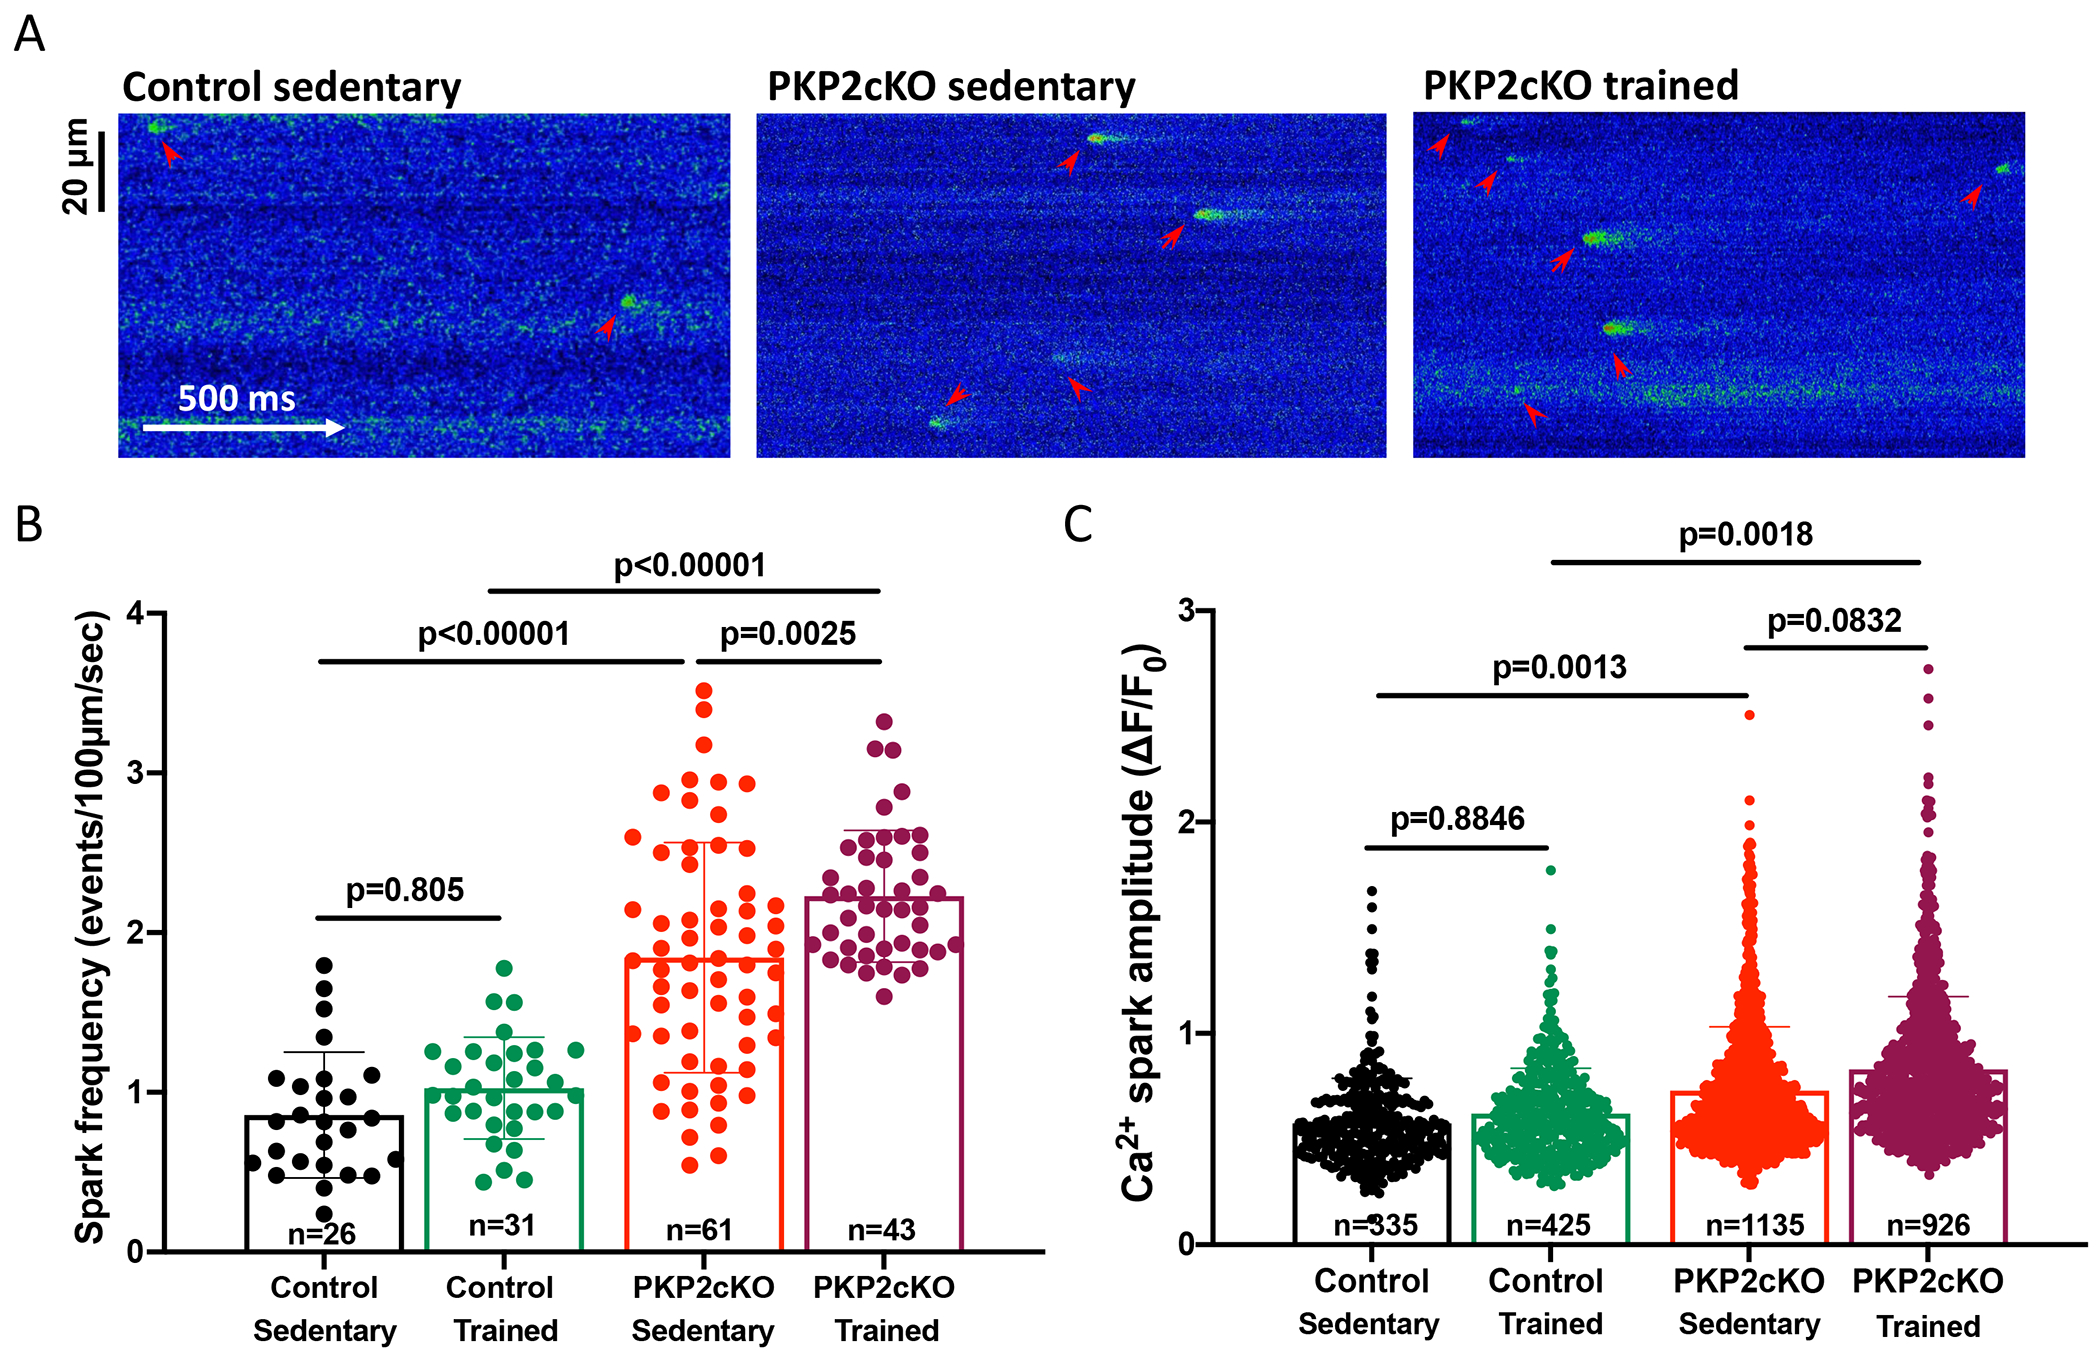
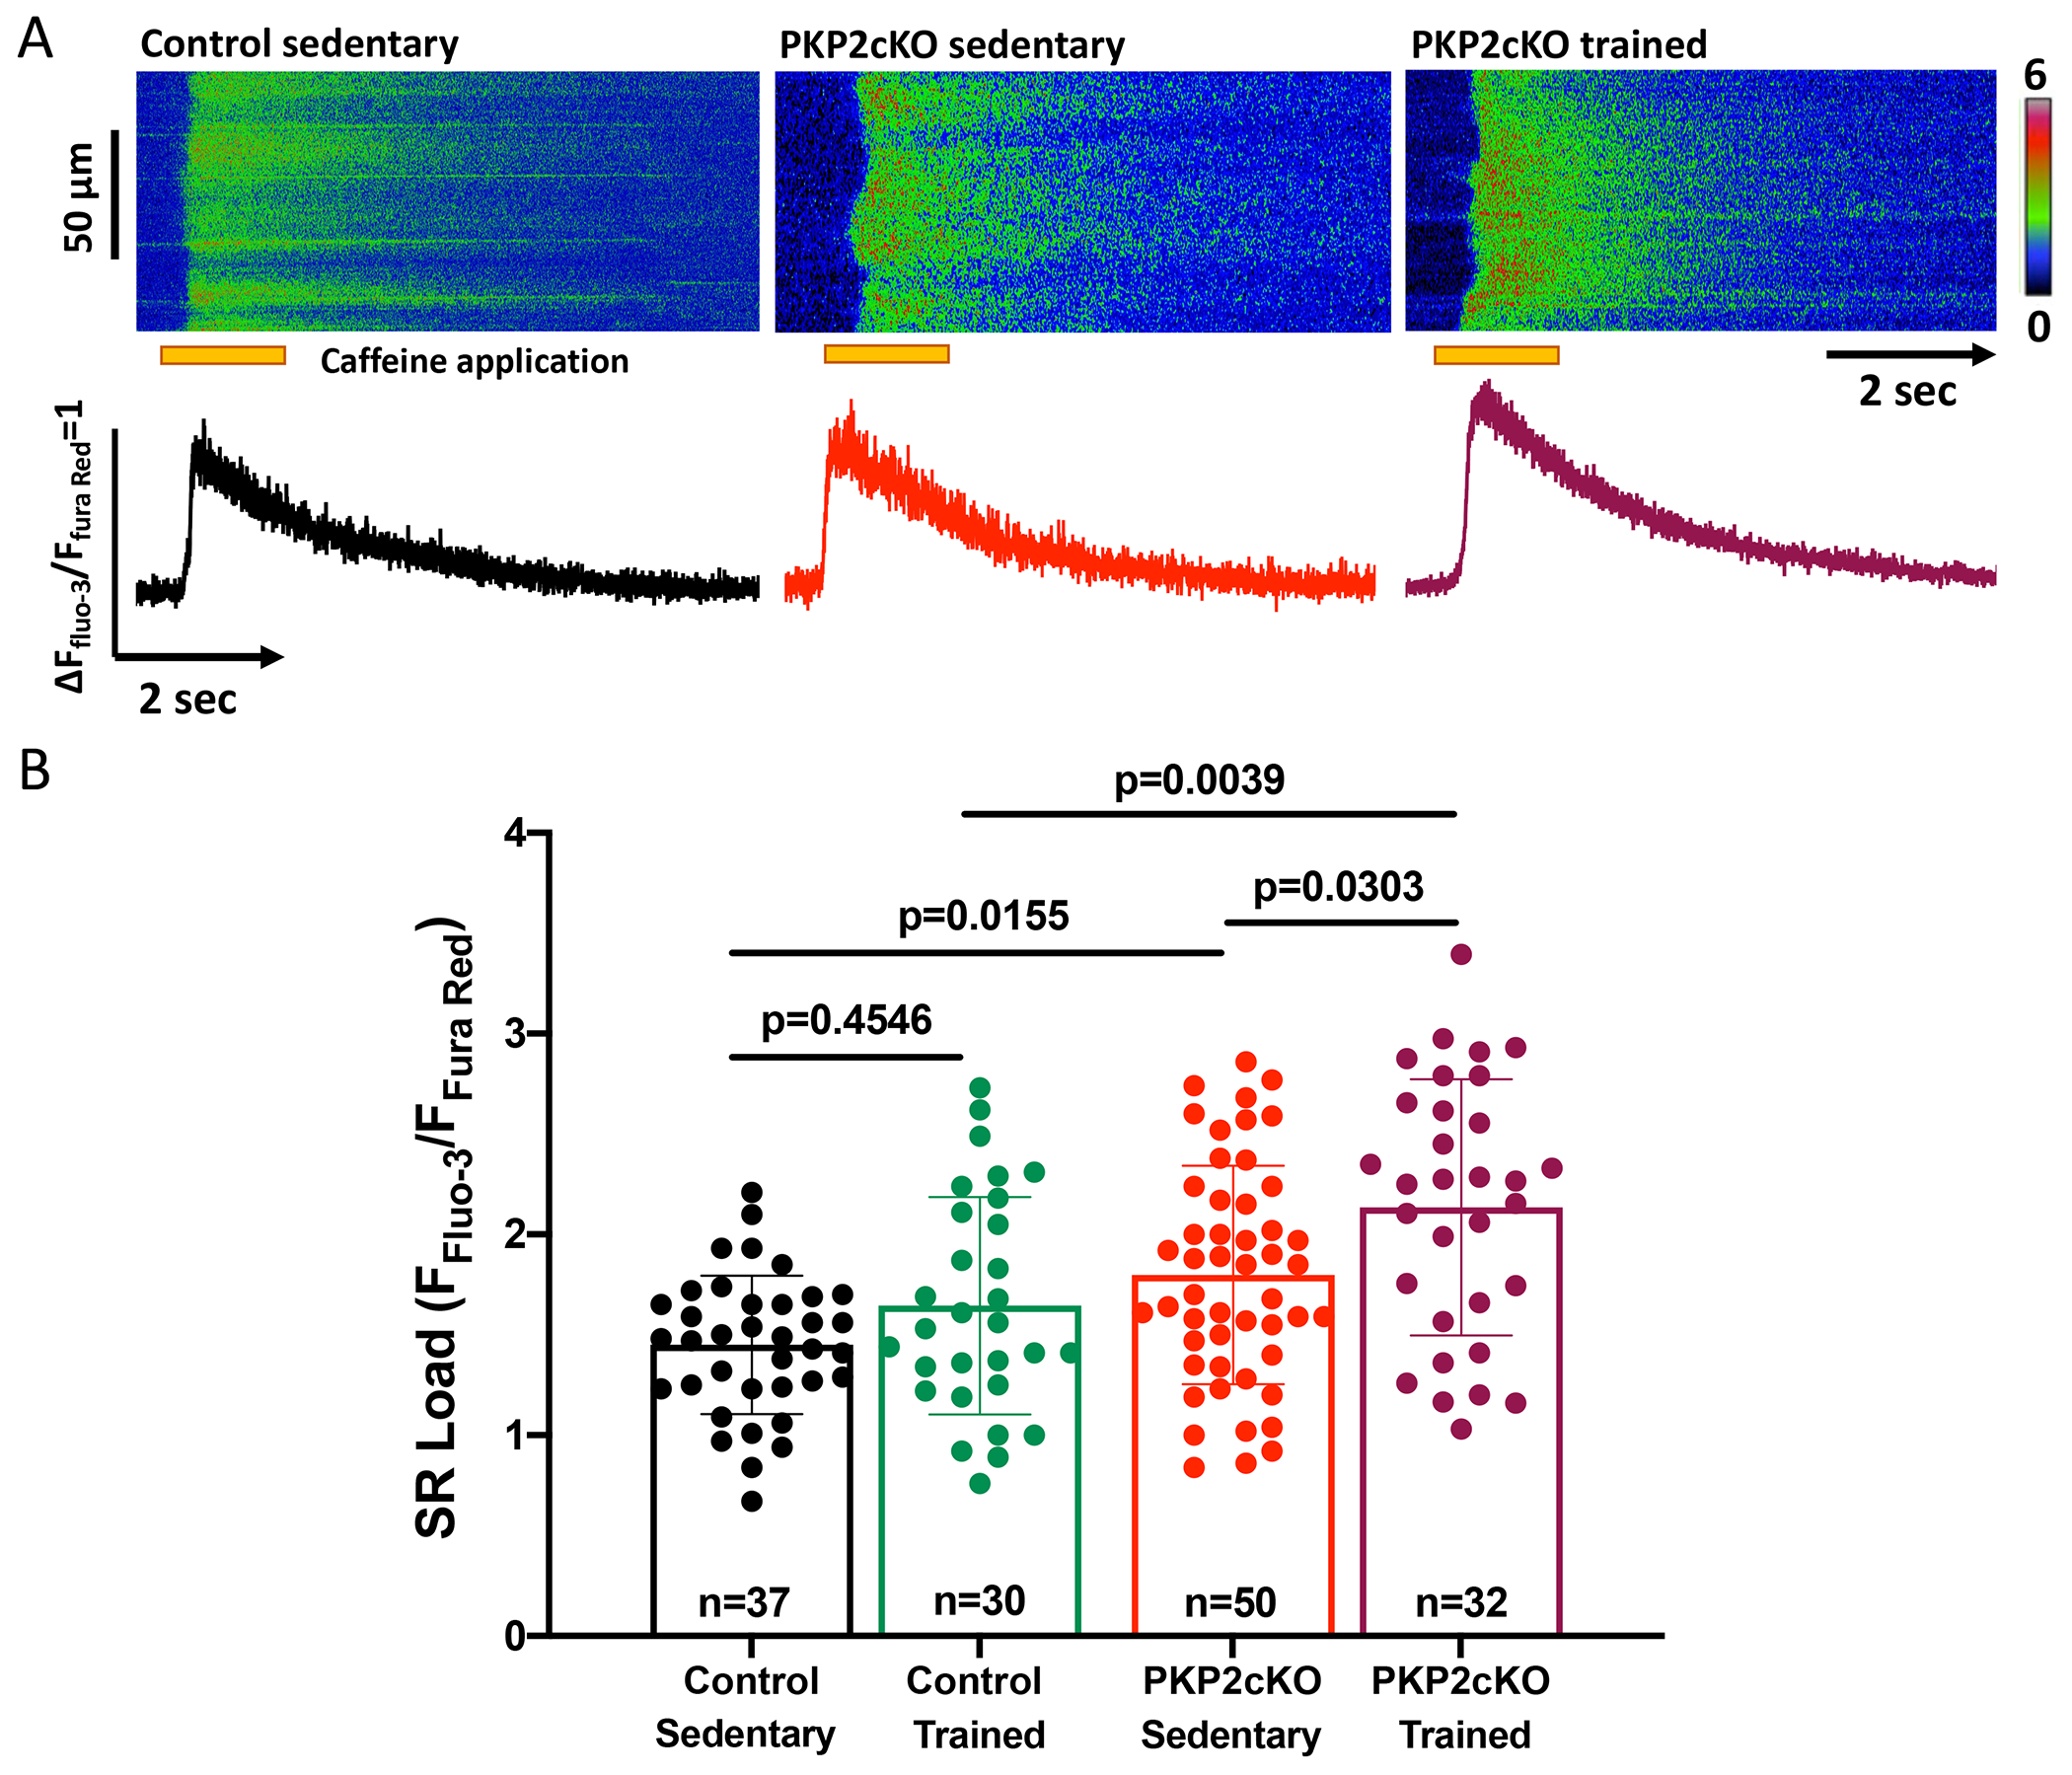
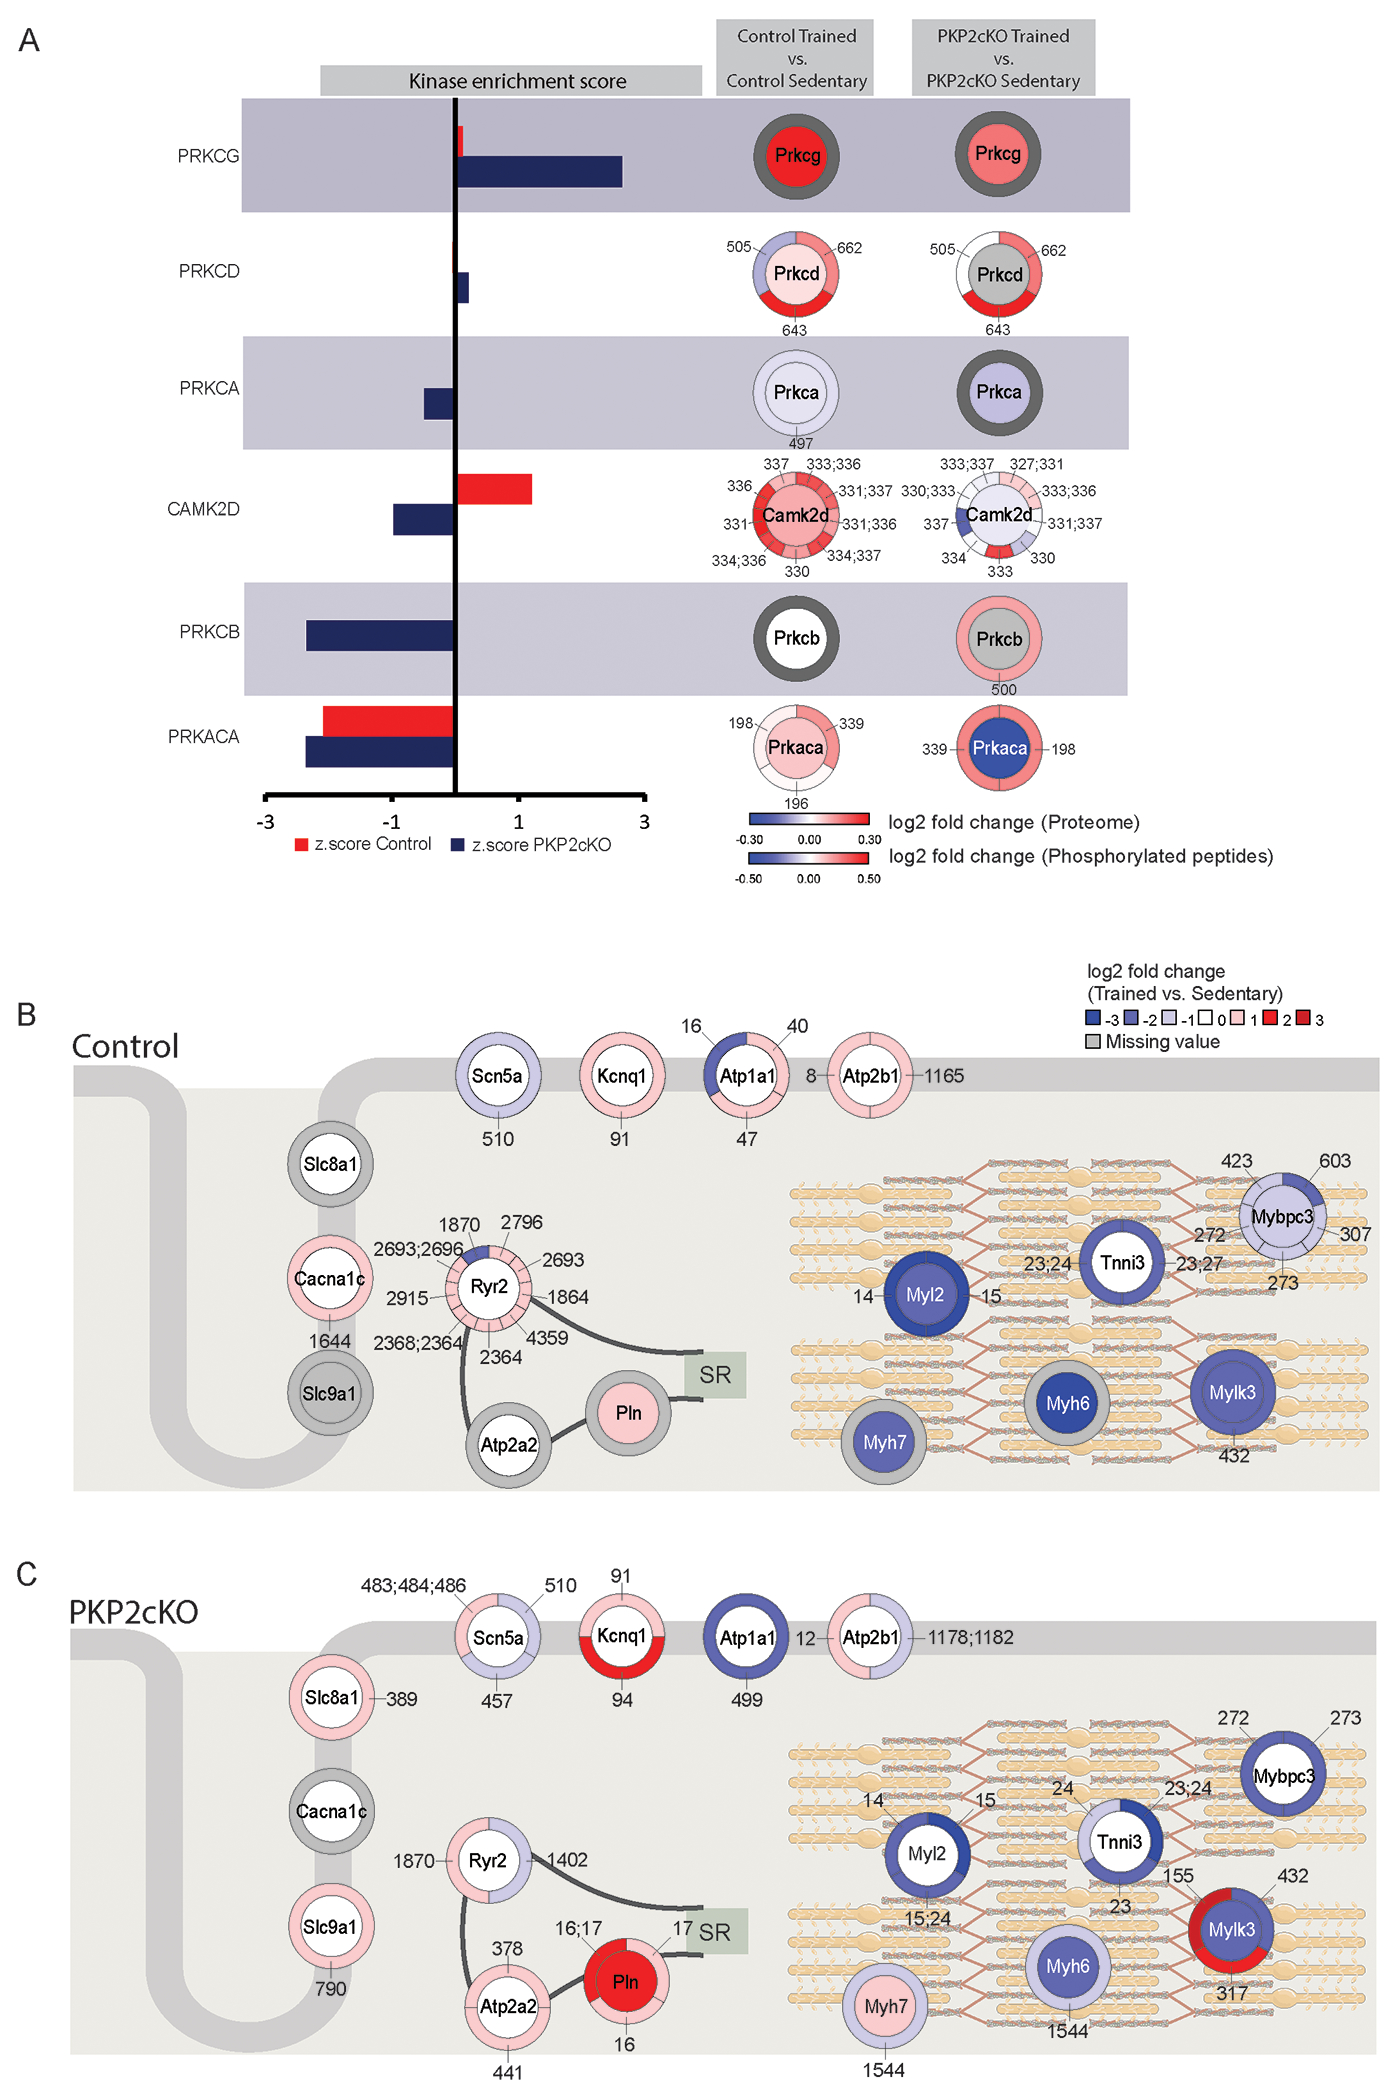
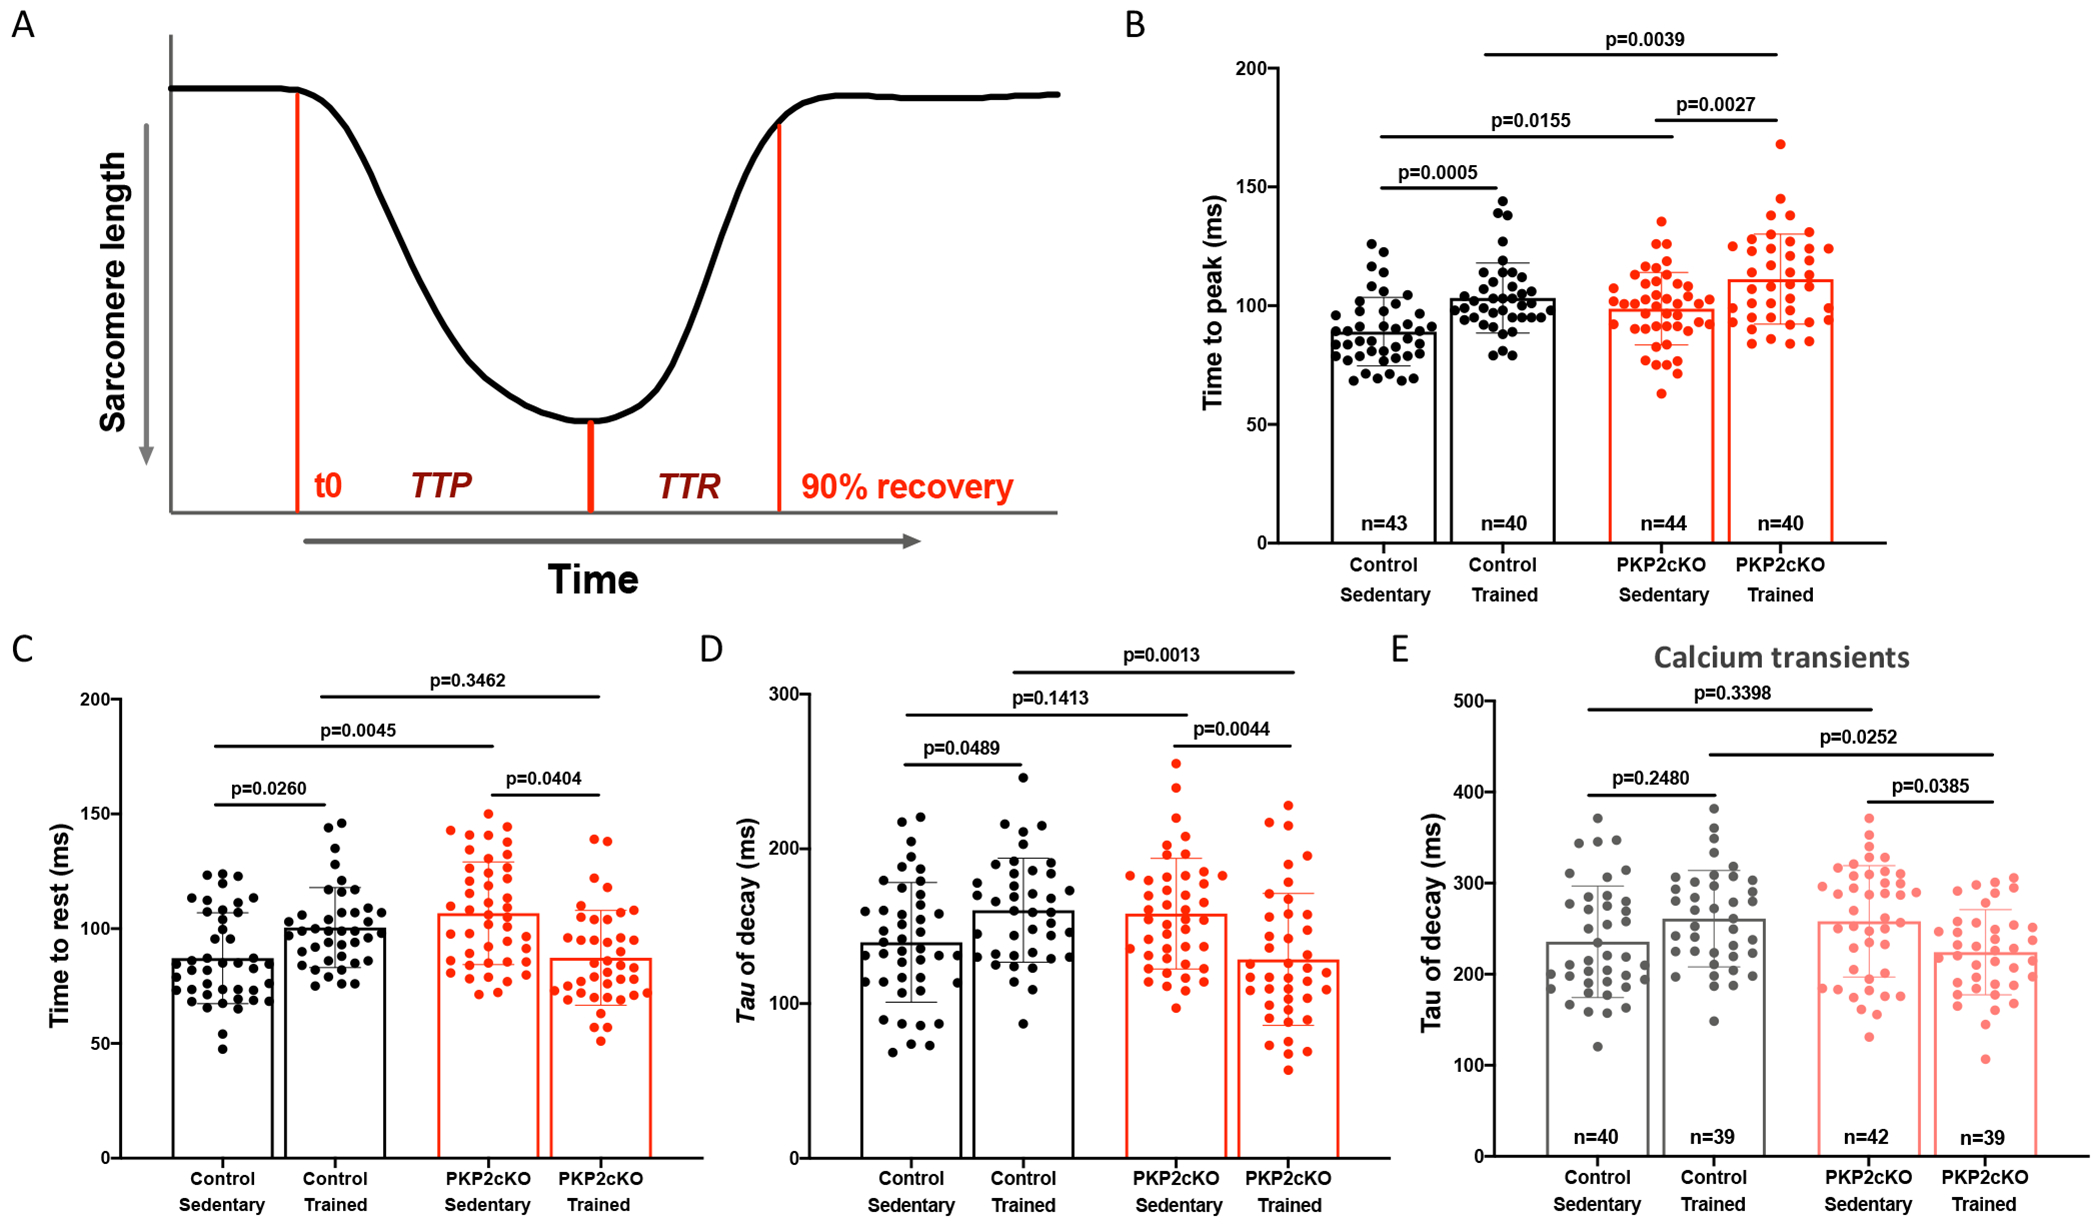
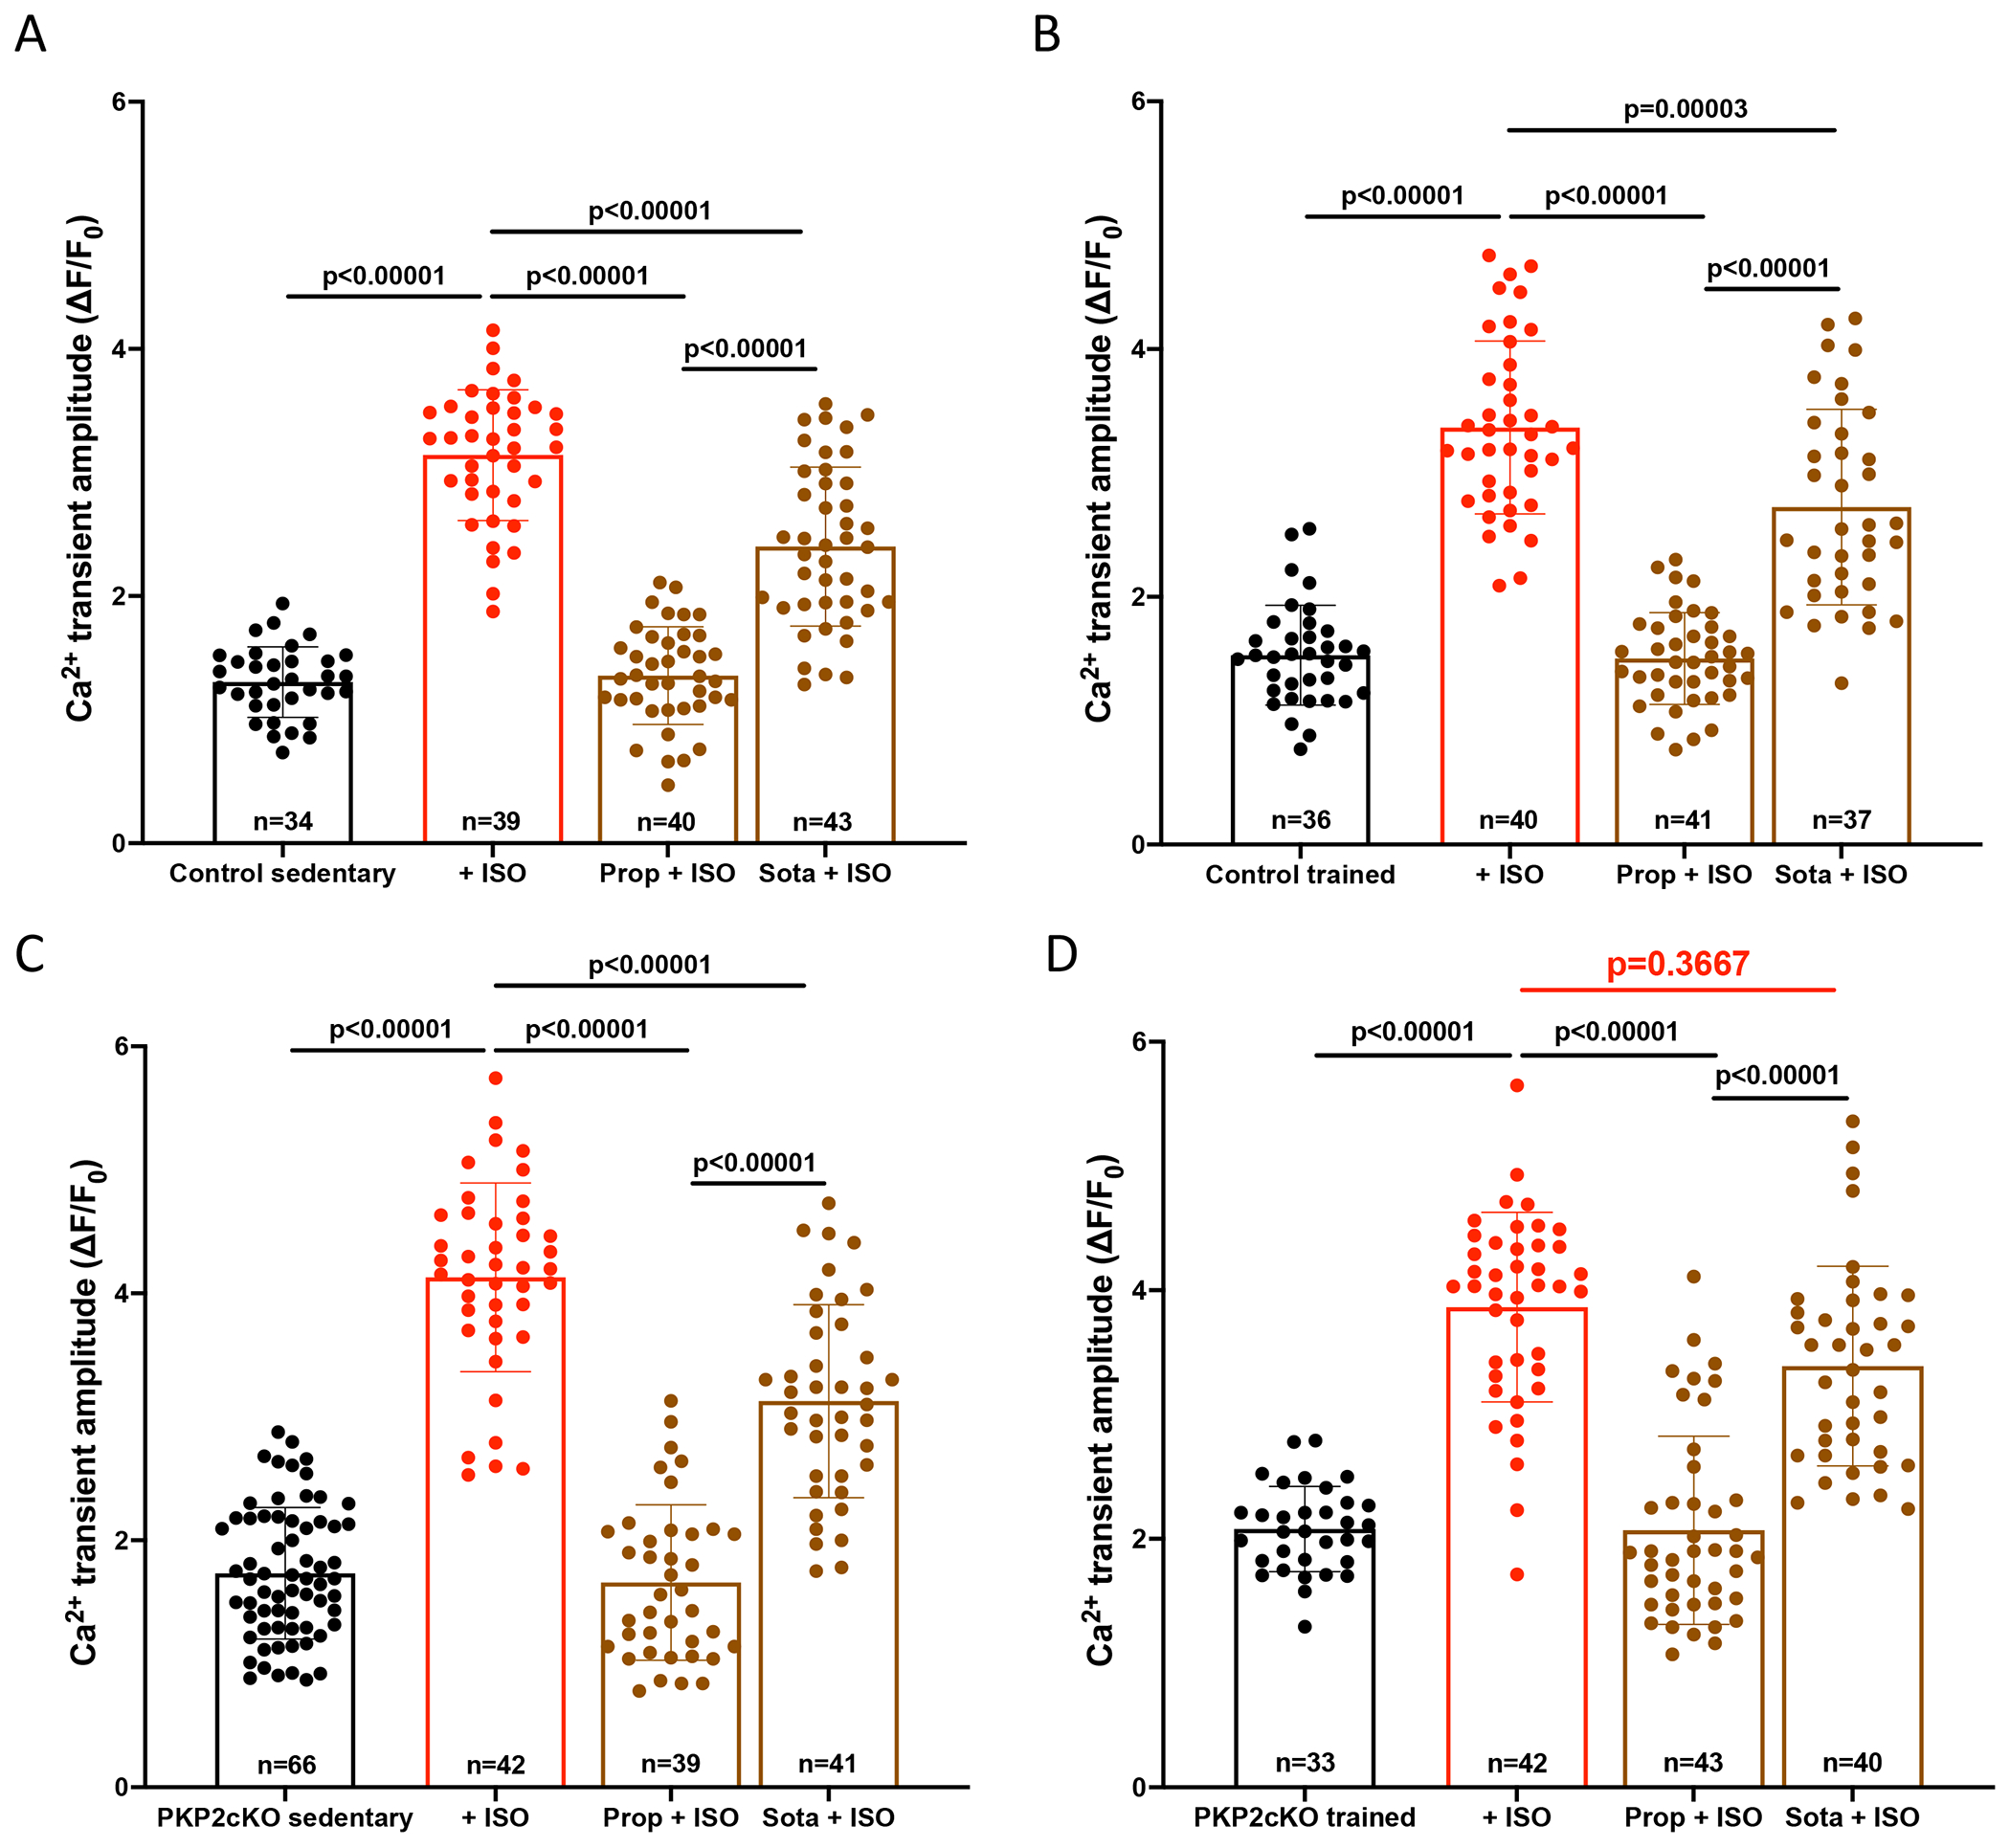
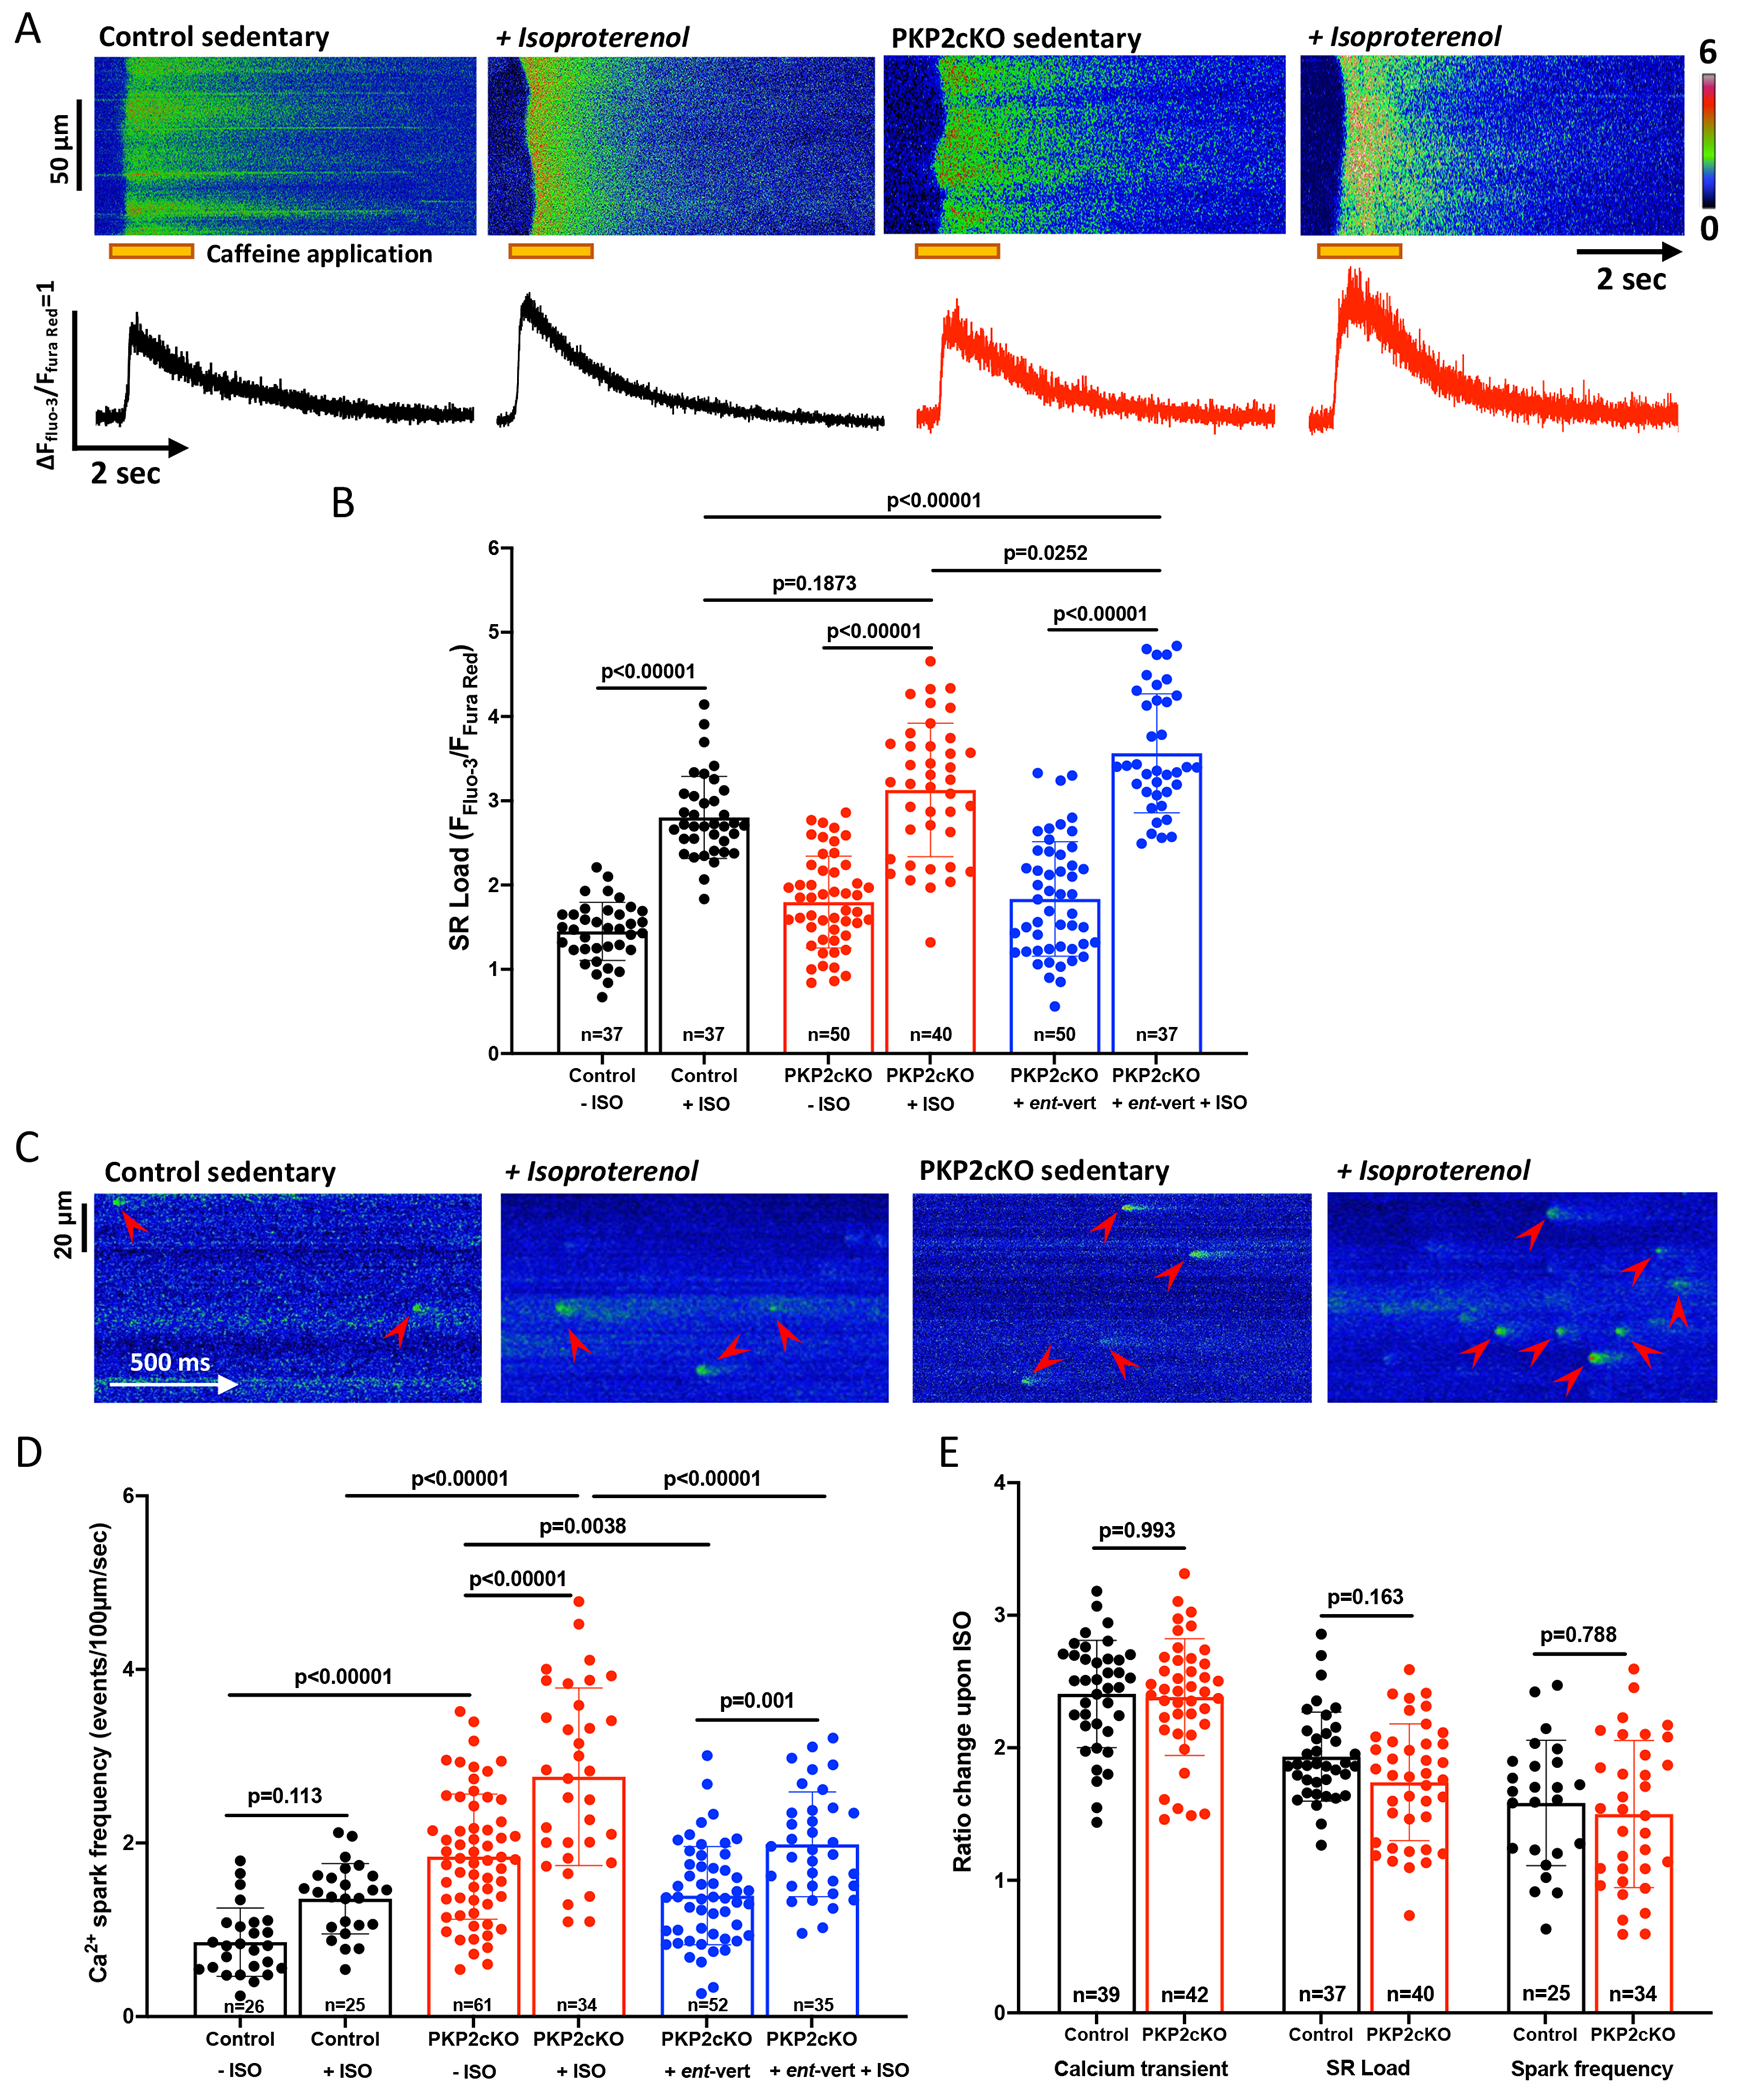
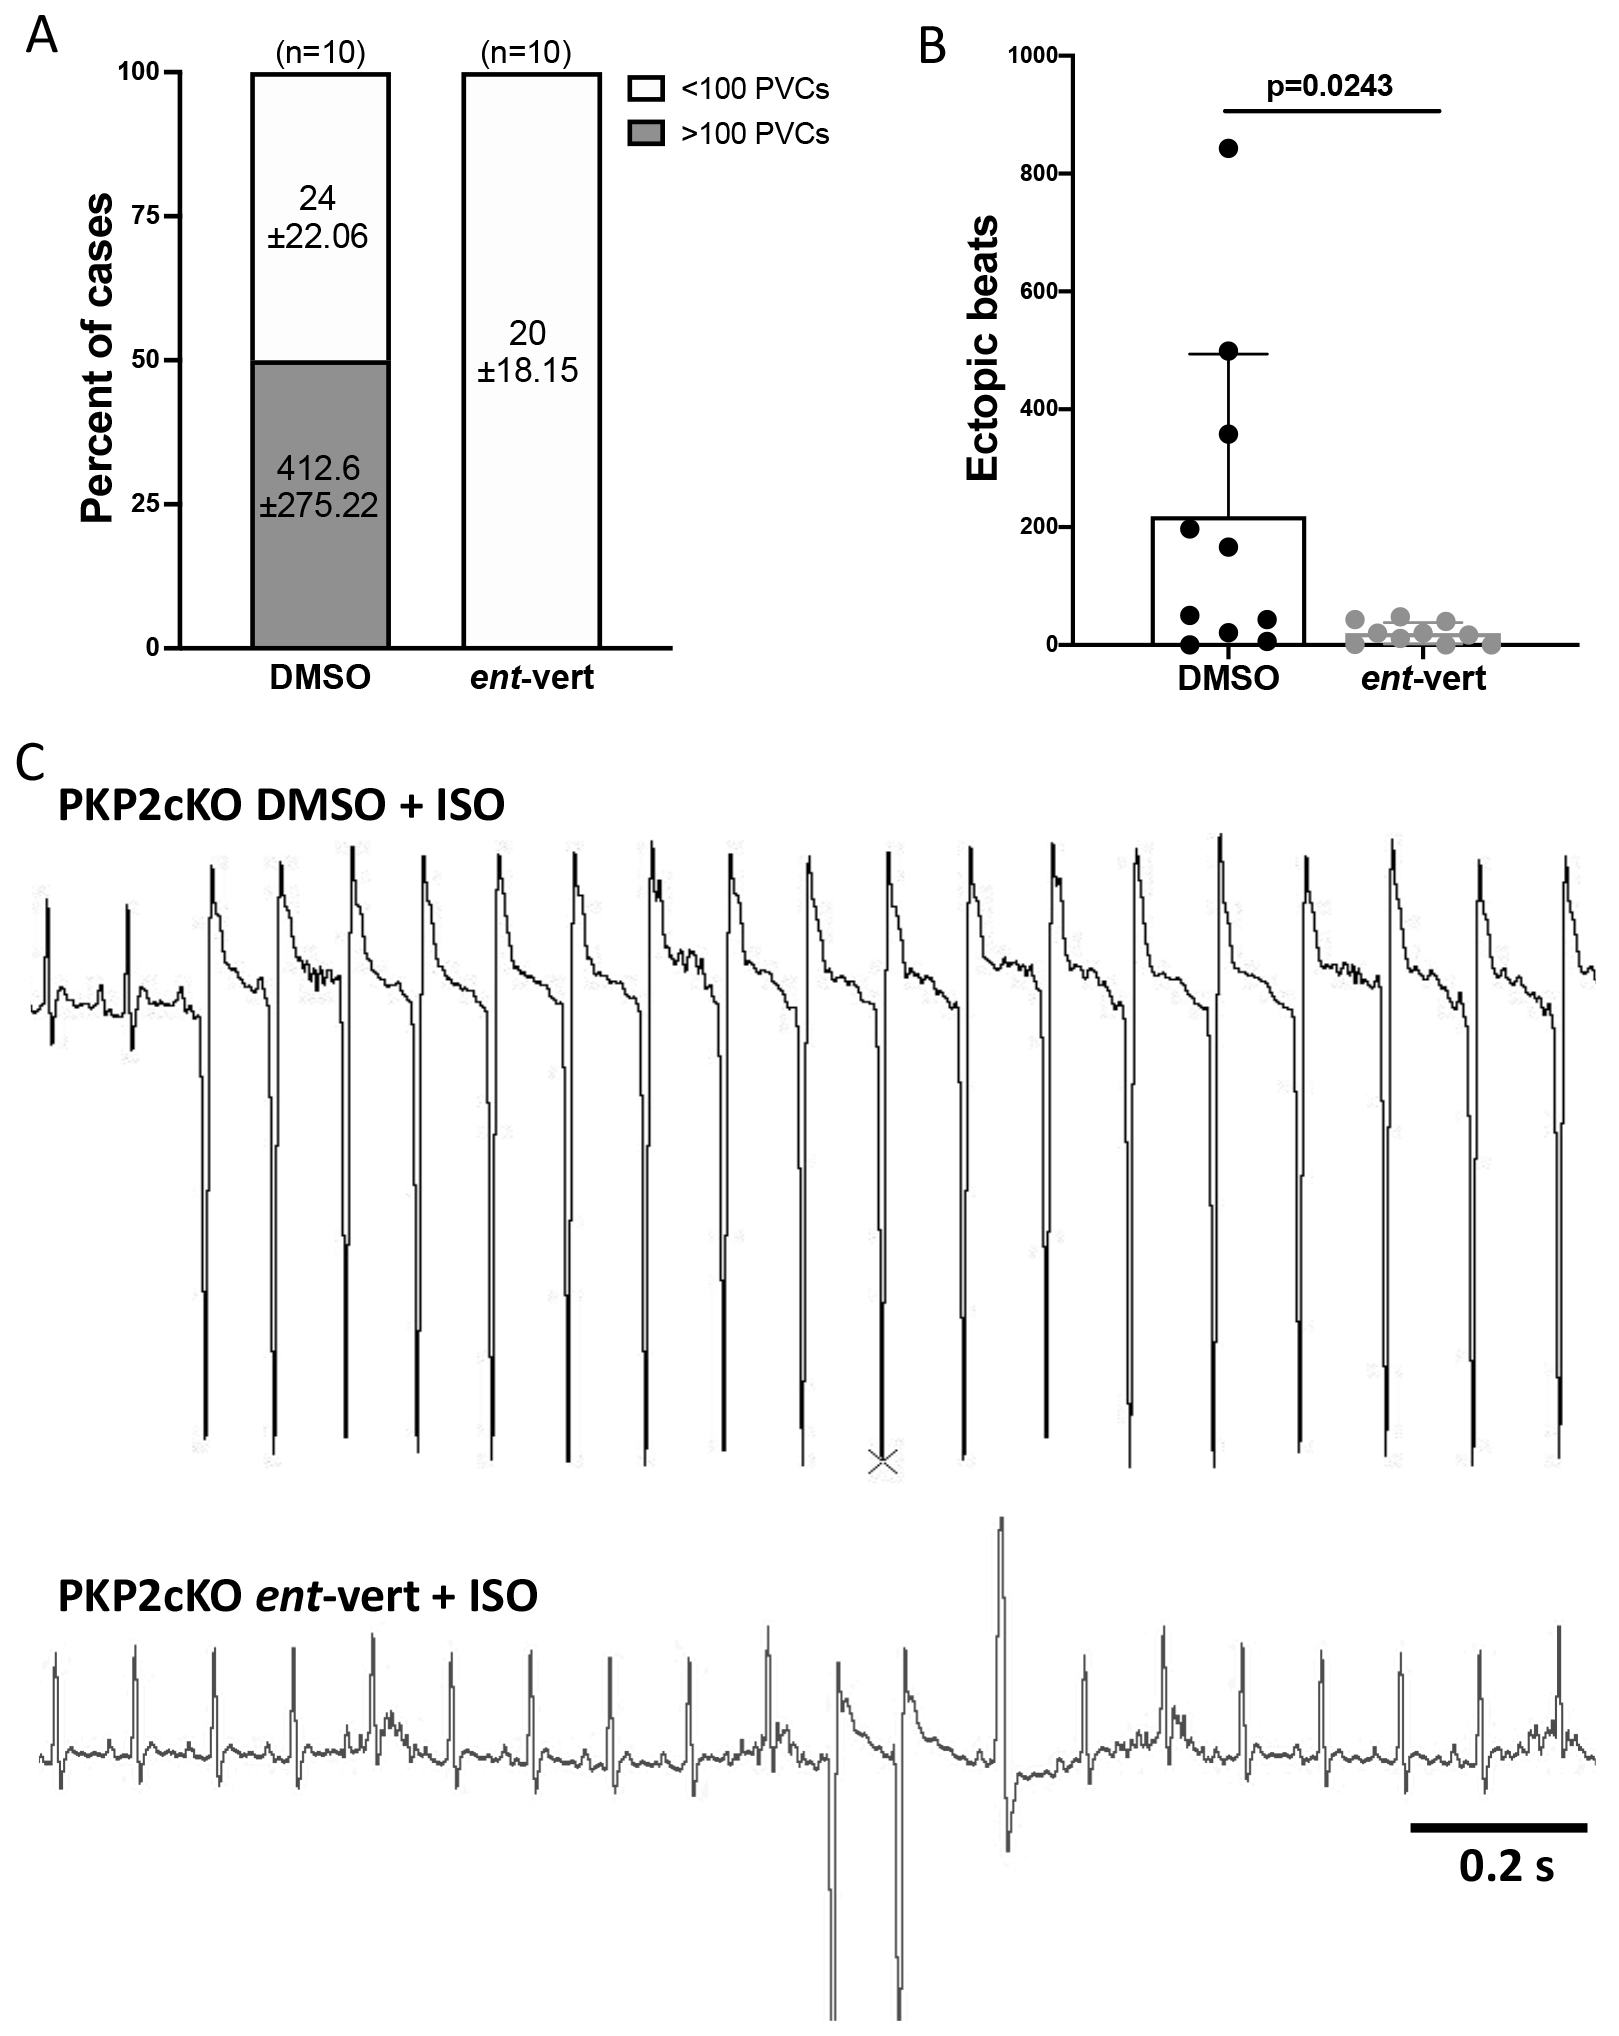
Results: In myocytes from PKP2cKO animals, training increased sarcoplasmic reticulum Ca2+ load, increased the frequency and amplitude of spontaneous ryanodine receptor (ryanodine receptor 2)-mediated Ca2+ release events (sparks), and changed the time course of sarcomeric shortening. Phosphoproteomics analysis revealed that training led to hyperphosphorylation of phospholamban in residues 16 and 17, suggesting a catecholaminergic component. Isoproterenol-induced increase in Ca2+i transient amplitude showed a differential response to β-adrenergic blockade that depended on the purported ability of the blockers to reach intracellular receptors. Additional experiments showed significant reduction of isoproterenol-induced Ca2+i sparks and ventricular arrhythmias in PKP2cKO hearts exposed to an experimental blocker of ryanodine receptor 2 channels.

Conclusions: Exercise disproportionately affects Ca2+i homeostasis in PKP2-deficient hearts in a manner facilitated by stimulation of intracellular β-adrenergic receptors and hyperphosphorylation of phospholamban. These cellular changes create a proarrhythmogenic state that can be mitigated by ryanodine receptor 2 blockade. Our data unveil an arrhythmogenic mechanism for exercise-induced or catecholaminergic life-threatening arrhythmias in the setting of PKP2 deficit. We suggest that membrane-permeable β-blockers are potentially more efficient for patients with arrhythmogenic right ventricular cardiomyopathy, highlight the potential for ryanodine receptor 2 channel blockers as treatment for the control of heart rhythm in the population at risk, and propose that PKP2-dependent and phospholamban-dependent arrhythmogenic right ventricular cardiomyopathy-related arrhythmias have a common mechanism.

Keywords: arrhythmogenic right ventricular cardiomyopathy; exercise; phospholamban; plakophilins; receptors, adrenergic, beta-1.


Conflict of interest statement

DISCLOSURES

Authors have no conflict of interests to disclose.

Figures

Figure 1.
Figure 1.. Ca2+ sparks in cardiac myocytes from control and plakophilin-2 conditional knockout (PKP2cKO) hearts.
(A) Confocal line-scan images of Ca2+ sparks (green; emphasized by red arrowheads) recorded from cardiac myocytes isolated from sedentary control, sedentary PKP2cKO and trained PKP2cKO mice 21 days post-tamoxifen injection. (B) Mean frequency of Ca2+ sparks, reported as average number of events per second in a 100 μm line. (C) Average peak amplitude (ΔF/F0). Data are presented as mean ± SD. Black bars and symbols: sedentary control; green bars and symbols: trained control; red bars and symbols: sedentary PKP2cKO; purple bars and symbols: trained PKP2cKO mice. Number of cells studied noted in the corresponding bars, 3–6 mice per group. Test for clustering versus validity of assumption of independence between data obtained from more than one mouse and one cell within a group, as in Sikkel et al (20). Significance of clustering is reported in Table S1. For spark frequency, significance was assessed by two-way ANOVA followed by Tukey’s multiple comparison’s test. For spark amplitude, hierarchical statistics on animal and cell level were performed; data were logarithmically transformed before statistical analysis. Statistical significance was corroborated by linear mixed-effects analysis (Table S1). Effect size (Cohen’s d) and determination of normal distribution (Shapiro-Wilk and Kolgomorov-Smirnov tests) of both datasets also reported in Table S1.
Figure 2.
Figure 2.. Ca2+ content in sarcoplasmic reticulum of control and plakophilin-2 conditional knockout (PKP2cKO) cardiac myocytes.
(A) Upper panel; Confocal line-scan images (1.43 ms/line) recorded from cardiac myocytes isolated from sedentary control, sedentary PKP2cKO or trained PKP2cKO mice 21 days post-tamoxifen injection. The pulse of caffeine (10 mmol/L) is indicated by the orange bar at the bottom of the image. Intracellular calcium changes detected by a ratiometric method (FFluo-3/FFura Red; see also Methods). Bottom panel: Time course of calcium transients displayed in the top. (B): Cumulative data, presented as mean ± SD. Black bars and symbols: sedentary control; green bars and symbols: trained control; red bars and symbols: sedentary PKP2cKO; purple bars and symbols: trained PKP2cKO mice. Number of cells studied is noted in the corresponding bars, 3-6 mice per group. Test for clustering versus validity of assumption of independence between data obtained from more than one mouse within a group, as in Sikkel et al (20). Results determined no need for hierarchical statistics (significance of clustering in Table S1). Significance was assessed by two-way ANOVA followed by Tukey’s multiple comparison’s test. Statistical significance was corroborated by linear mixed-effects analysis (Table S1). Effect size (Cohen’s d) and determination of normal distribution (Shapiro-Wilk and Kolgomorov-Smirnov tests) also reported in Table S1.
Figure 3.
Figure 3.. Workflow and data summary of proteomics and phosphoproteomics experiments.
(A) Control and PKP2cKO mice were either kept sedentary, or trained (treadmill running 1 hour a day; six times a week for six weeks; green). Details of training protocol in Online Methods. Left ventricular tissue was isolated, proteins extracted and subjected to quantitative proteome and phosphoproteome measurements by LC-MS/MS analysis. (B) Bar graphs summarize the number of proteins (top) and phosphorylated peptides (bottom) measured for each heart sample. For proteome samples red indicates the number of identified proteins and blue the number of proteins quantified across samples. For phosphoproteome, red indicates the number of phosphorylated peptides quantified across samples and blue indicates that the phosphorylation site localization is deemed a class 1 site (i.e., localization probability greater than 0.75). (C-D) Volcano plot analysis showing phosphorylated peptides that are either downregulated (purple) or upregulated (green) in response to exercise for control (C) or PKP2cKO animals (D). Phosphorylated peptides were considered regulated at a combined cut-off of p-value < 0.05 and a numerical log2 fold change greater than 0.50. A few selected phosphorylation sites are indicated in the plot. Each point in the volcano plots in panels 3C and 3D represent a phosphorylated peptide. For each of these peptides, the fold change of the abundance of the phosphorylated peptide between trained and sedentary animals were calculated as the difference between logarithmized mean intensities measured in trained animals (n=3) and those measured in sedentary animals (n=3).
Figure 4.
Figure 4.. Phosphorylation mediated signaling changes in response to exercise.
(A) KSEA results that show kinases with either up (positive z-score) or downregulated (negative z-score) activity in control (red) or PKP2cKO (blue) hearts upon exercise. Next to each kinase, data from proteome and phosphoprotome is visualized for control and PKP2cKO groups. The inner circle represents changes in protein abundance and the outer circle, changes in phosphorylation state of sites specified (i.e., small numbers note the position of the phosphosite in the protein sequence). Colors are coded as per the scales in the bottom-right of the panel. (B-C): Diagrammatic representation including a heat map that summarizes differential abundance (inner circle) and phosphorylation state (outer circle) of a selected set of proteins residing in the dyad (left) or the sarcomeric complex (right). B): control; (C): PKP2cKO. Both cases reflect differential proteome/phosphoproteome data obtained by comparing trained versus sedentary animals. Tones of red indicate increased abundance in exercised animals and tones of blue, decrease. Only absolute log2FC values higher than 0.3 are represented; white inner circle: protein differential remained below threshold. Small numbers pointing to segments of the outer circles indicate the position of the phospho-site in the sequence of the protein.
Figure 5.
Figure 5.. Time course of sarcomere shortening and Ca2+ transients in trained control and plakophilin-2 conditional knockout (PKP2cKO) cardiac myocytes.
(A) Time course of sarcomere shortening during 1Hz field stimulation. Point of maximum shortening divides two components: Onset to peak (“time to peak” or “TTP”) and peak to 90% relaxation (“time to rest” or “TTR”). (B) Time to peak (ms), (C) time to rest (ms) and (D) time constant of decay (ms) reported as average of 15 consecutive contractions. (E) Time constant of Ca2+ transient decay (ms) obtained by confocal line-scans (1.43 ms/line) during 1Hz field stimulation. Black bars: control myocytes; red bars: PKP2cKO myocytes 21 days post-TAM. Data presented as mean ± SD. Number of cells noted in the corresponding bars; 4-5 mice per group. Test for clustering versus validity of assumption of independence between data obtained from more than one mouse within a group, as in Sikkel et al (20). Results determined no need for hierarchical statistics (significance of clustering in supplemental Table 1). Significance was assessed by two-way ANOVA followed by Tukey’s multiple comparison’s test. Statistical significance was corroborated by linear mixed-effects analysis (Table S1). Effect size (Cohen’s d) and determination of normal distribution (Shapiro-Wilk and Kolgomorov-Smirnov tests) are also reported in Table S1.
Figure 6.
Figure 6.. Adrenergic regulation of Ca2+ transients in cardiac myocytes from control and plakophilin-2 conditional knockout (PKP2cKO) mice.
(A-D) Compiled data: Average Ca2+ transient amplitude (relative amplitude; ∆F/F0) obtained by confocal line-scans (1.43 ms/line) during 1Hz field stimulation. Cardiac myocytes from sedentary control (A), trained control (B), sedentary PKP2cKO (C) and trained PKP2cKO (D) mice were used and imaged at baseline or in the presence of 100 nM isoproterenol (ISO), alone or in conjunction with 1 μM propranolol (prop) or 25 μM sotalol (Sota). Cardiac myocytes were pre-incubated for 5 minutes with propranolol or sotalol before ISO incubation (10 minutes). Black bars represent data at baseline, red bars upon ISO, brown bars after pre-incubation with beta blockers. Data presented as mean ± SD. Number of cells noted in the corresponding bars; 4-6 mice per group. Test for clustering versus validity of assumption of independence between data obtained from more than one mouse within a group, as in Sikkel et al (20). Significance of clustering reported in Table S1. Hierarchical statistics used for sedentary PKP2cKO data. Significance was assessed by one-way ANOVA followed by a Bonferroni test for sedentary control and for trained control data. Significance was assessed by Kruskal Wallis followed by Dunn’s multiple comparison’s test for trained PKP2cKO data. Statistical significance was corroborated by a linear mixed-effects analysis (Table S1). Effect size (Cohen’s d) and determination of normal distribution (Shapiro-Wilk and Kolgomorov-Smirnov tests) also reported in Table S1.
Figure 7.
Figure 7.. SR Ca2+ content and frequency of Ca2+ sparks in response to ISO; susceptibility to RyR2 block.
(A) Upper panel; Confocal line-scan images (1.43 ms/line) recorded from cardiac myocytes isolated from sedentary control and sedentary PKP2cKO mice 21 days post-tamoxifen injection, at baseline or exposed to 100 nM isoproterenol. The pulse of caffeine (10 mmol/L) is indicated by the orange bar at the bottom of the image. Intracellular Ca2+ changes were detected by a ratiometric method (FFluo-3/FFura Red; see also Methods). Bottom panel; Time course of change in fluorescence elicited by caffeine pulse. Cumulative data in (B), black bars and symbols represent data from control myocytes, red bars and symbols, PKP2cKO myocytes, blue bars and symbols, PKP2cKO myocytes pre-treated with ent-verticilide. Data represented as mean ± SD. Number of cells noted in the corresponding bars; 5-6 mice per group. (C) Confocal line-scan images of Ca2+ sparks (green; emphasized by red arrowheads) recorded from sedentary control and sedentary PKP2cKO myocytes 21 days post-TAM, at baseline or exposed to 100 nM ISO. Cumulative data are shown in (D), colors of bars and symbols same as in panel B. Number of cells studied are noted in the corresponding bars, 4-6 mice per group. (E) Ratio of change in Ca2+ transient amplitude, SR load and frequency of Ca2+ sparks upon ISO in sedentary control (black bars) and sedentary PKP2cKO (red bars) myocytes, normalized to values obtained in the absence of ISO. Number of cells noted in the corresponding bars, 4-6 mice per group. For all statistical comparisons reported in this figure, test for clustering versus validity of assumption of independence between data obtained from more than one mouse within a group, as in Sikkel et al (20). Significance of clustering reported in Table S1. Results indicated no need for hierarchical statistics. Significance was assessed by Two-way ANOVA followed by Tukey’s multiple comparison’s test (values reported in the Figure and in Table S1) and corroborated by linear mixed-effects analysis (Table S1). Effect size (Cohen’s d) and determination of normal distribution (Shapiro-Wilk and Kolgomorov-Smirnov tests) also reported in Table S1. Control data (no ISO) for spark frequency and SR load also shown in Figures 1 and 2, respectively.
Figure 8.
Figure 8.. Isoproterenol-induced arrhythmias in PKP2cKO hearts upon treatment with ent-verticilide
(A) Incidence of isoproterenol-induced (ISO) PVCs during 30 minutes of recording in anesthetized PKP2cKO mice treated with DMSO or ent-verticilide. Data reported as percent of total animals studied per condition; number of animals at top of each bar. Numbers inside bars indicate mean ± SD of ventricular extrasystoles. (B) Cumulative data of ectopic beats in DMSO and ent-verticilide treated mice. Data presented as mean ± SD. Significance as per Mann Whitney test. Effect size (Cohen’s d) and determination of normal distribution (Shapiro-Wilk and Kolgomorov-Smirnov tests) reported in Table S1. (C) Top panel: Example of ISO-induced ventricular tachycardia in a DMSO treated PKP2cKO mouse. Bottom panel: Example of ISO-induced ventricular extrasystoles in an ent-verticilide treated PKP2cKO mouse. Scale bar = 200 ms.

References

    1. Agullo-Pascual E, Cerrone M, Delmar M. Arrhythmogenic cardiomyopathy and Brugada syndrome: Diseases of the connexome. In: FEBS Letters. 2014;17:588:1322–1330 - PMC - PubMed
    1. Austin KM, Trembley MA, Chandler SF, Sanders SP, Saffitz JE, Abrams DJ, Pu WT . Molecular mechanisms of arrhythmogenic cardiomyopathy. Nat. Rev. Cardiol. 2019;16:519–537. - PMC - PubMed
    1. Corrado D, Link MS, Calkins H. Arrhythmogenic Right Ventricular Cardiomyopathy. N Engl J Med. 2017;376:1489–1490. - PubMed
    1. Corrado D, Link MS, Calkins H. Arrhythmogenic Right Ventricular Cardiomyopathy. N Engl J Med. 2017;376:61–72. - PubMed
    1. Groeneweg JA, Bhonsale A, James CA, te Riele AS, Dooijes D, Tichnell C, Murray B, Wiesfeld ACP, Sawant AC, Kassamali B, et al., Calkins H. Clinical Presentation, Long-Term Follow-Up, and Outcomes of 1001 Arrhythmogenic Right Ventricular Dysplasia/Cardiomyopathy Patients and Family Members. Circ Cardiovasc Genet. 2015;8:437–446. - PubMed

Publication types

MeSH terms