The impact of ZnO configuration as an external layer on the sensitivity of a bi-layer coated polymer optical fiber probe
- PMID: 35492078
- PMCID: PMC9051257
- DOI: 10.1039/d0ra00243g
The impact of ZnO configuration as an external layer on the sensitivity of a bi-layer coated polymer optical fiber probe
Abstract
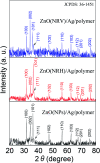
Salinity magnitude changes are a critical factor for determining the chemistry of natural water bodies and biological processes. Label-free refractive index sensors are promising devices for detecting these changes. A polymer optical fiber (POF) sensor modified with cladding treatment and a bi-layer zinc oxide/silver (ZnO/Ag) nanostructure coating to determine sodium chloride concentration changes through refractive index variations in water is experimentally demonstrated. The use of three ZnO nanostructure shapes, nanoparticles and horizontally and vertically oriented nanorods, as an external layer and a broad spectrum light source from the visible (Vis) to the near infrared (NIR) region are investigated to achieve optimum sensitivity. The rms roughness, optical band-gap and zeta potential (ZP) value for the vertically oriented sample are 148 nm, 3.19 eV and 5.96 mV, respectively. In the NIR region the wavelength-intensity sensitivity values of probes coated with ZnO nanoparticles and horizontally and vertically oriented nanorods are 104 nm RIU-1-12 dB RIU-1, 63 nm RIU-1-10 dB RIU-1 and 146 nm RIU-1-22 dB RIU-1, respectively, and in the Vis area the values are 65 nm RIU-1-14 dB RIU-1, 58 nm RIU-1-11 dB RIU-1 and 89 nm RIU-1-23 dB RIU-1, respectively. The maximum amplitude sensitivity is obtained for the probe coated with vertically aligned ZnO nanorods in the NIR area due to the deeper penetration of evanescent waves, a higher surface-volume ratio, better crystallinity, more adhesive interactions with salt molecules, larger surface roughness and higher-order dispersion compared to the other coated ZnO nanostructures.
This journal is © The Royal Society of Chemistry.
Conflict of interest statement
There is no conflicts to declare.
Figures


Similar articles
-
Cladding Mode Fitting-Assisted Automatic Refractive Index Demodulation Optical Fiber Sensor Probe Based on Tilted Fiber Bragg Grating and SPR.Sensors (Basel). 2022 Apr 15;22(8):3032. doi: 10.3390/s22083032. Sensors (Basel). 2022. PMID: 35459016 Free PMC article.
-
Sensitivity Enhancement of Polymer Optical Fiber Surface Plasmon Resonance Sensor Utilizing ITO Overlayer.Sensors (Basel). 2025 Mar 17;25(6):1863. doi: 10.3390/s25061863. Sensors (Basel). 2025. PMID: 40293035 Free PMC article.
-
Mid-infrared surface plasmon resonance fiber optic sensors.Opt Express. 2025 Jan 27;33(2):1962-1968. doi: 10.1364/OE.547355. Opt Express. 2025. PMID: 39876356
-
Near-infrared grating-assisted SPR optical fiber sensors: design rules for ultimate refractometric sensitivity.Opt Express. 2015 Feb 9;23(3):2918-32. doi: 10.1364/OE.23.002918. Opt Express. 2015. PMID: 25836153
-
Optimization of Cladding Diameter for Refractive Index Sensing in Tilted Fiber Bragg Gratings.Sensors (Basel). 2022 Mar 15;22(6):2259. doi: 10.3390/s22062259. Sensors (Basel). 2022. PMID: 35336430 Free PMC article.
References
-
- Wu C. Sun K. Xu Y. Zhang S. Huang X. Zeng S. Safety Science. 2019;117:299–304. doi: 10.1016/j.ssci.2019.04.020. - DOI
-
- Zhao Y. Zhao H. Lv R. Q. Zhao J. Optics and Lasers in Engineering. 2019;117:7–20. doi: 10.1016/j.optlaseng.2018.12.013. - DOI
-
- Mohandoss R. Renganathan B. Annalakshmi O. Ganesan A. Sens. Actuators, A. 2019;285:158–164. doi: 10.1016/j.sna.2018.11.012. - DOI
LinkOut - more resources
Full Text Sources
Miscellaneous

