

Comprehensive cross-sectional and longitudinal analyses of plasma neurofilament light across FTD spectrum disorders
- PMID: 35492244
- PMCID: PMC9044101
- DOI: 10.1016/j.xcrm.2022.100607
Comprehensive cross-sectional and longitudinal analyses of plasma neurofilament light across FTD spectrum disorders
Abstract
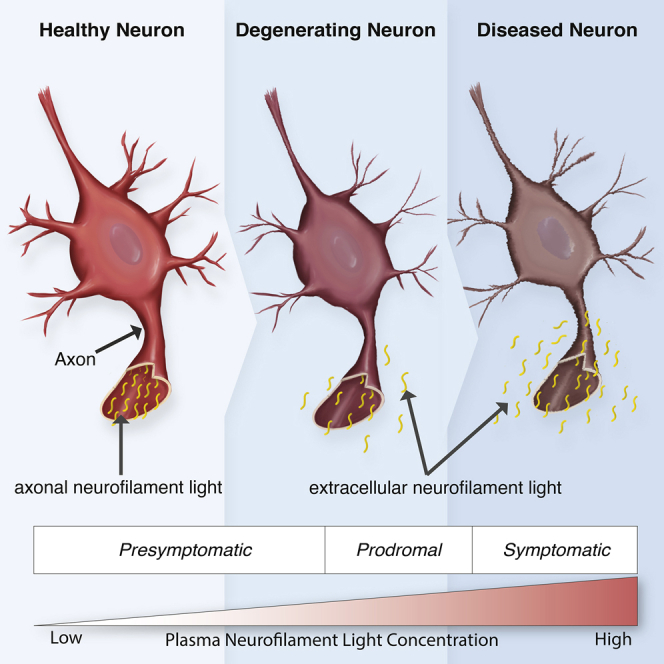
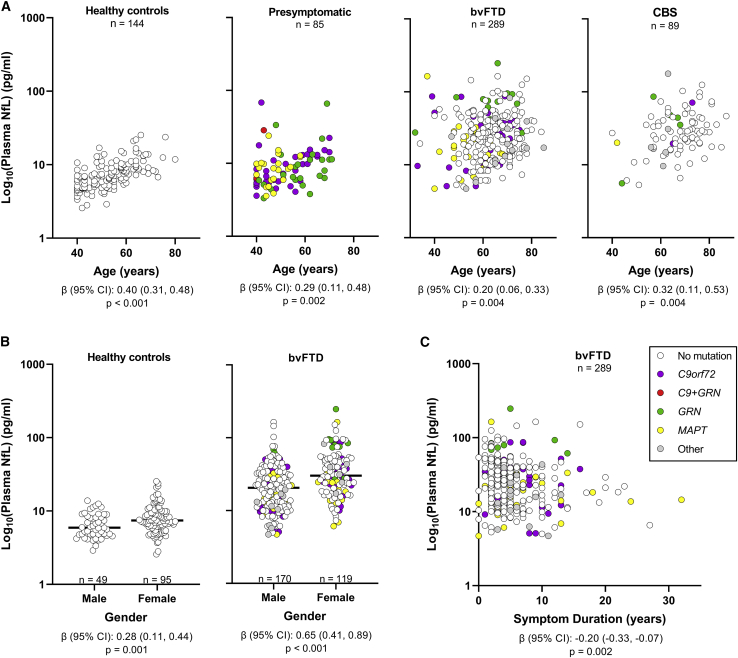
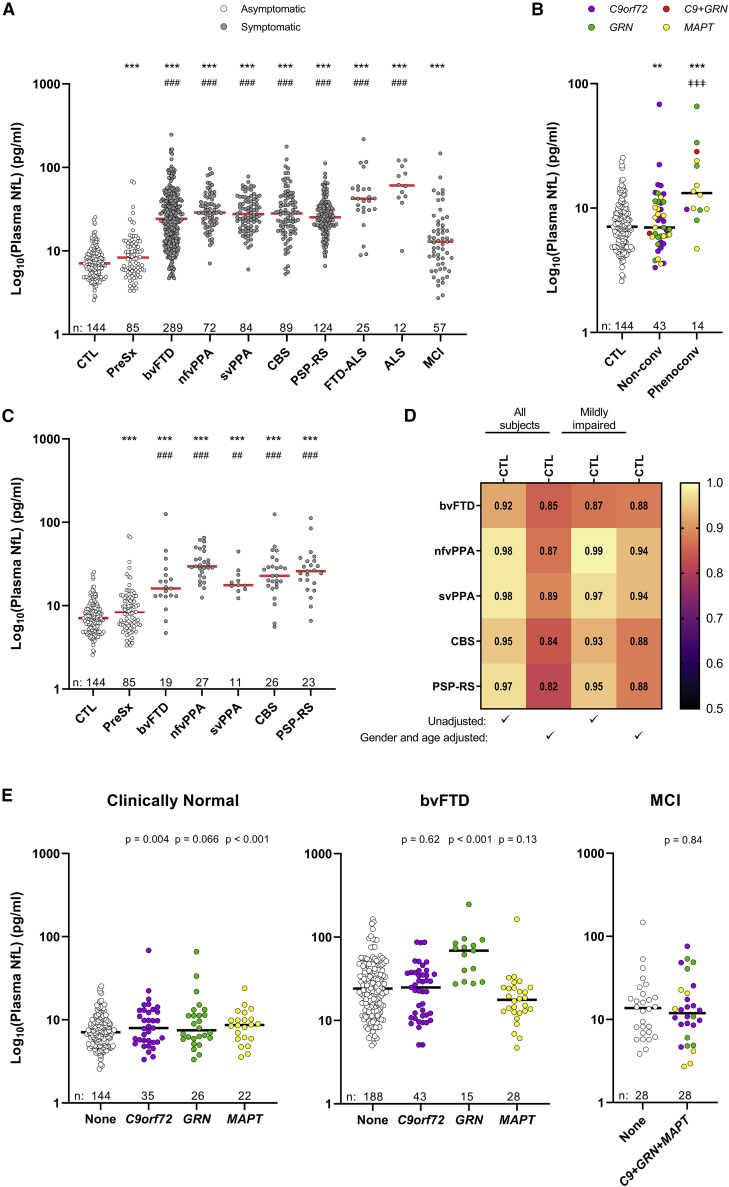
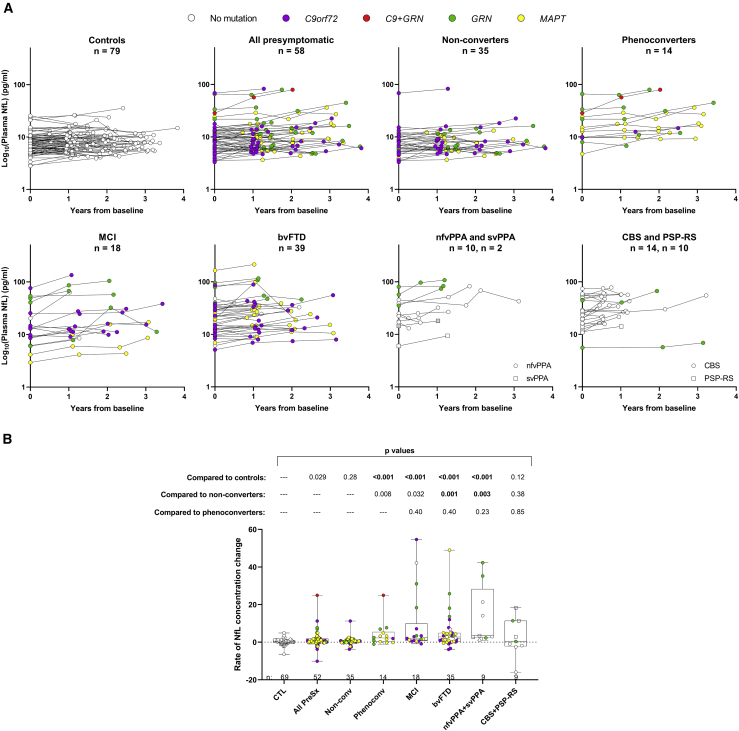
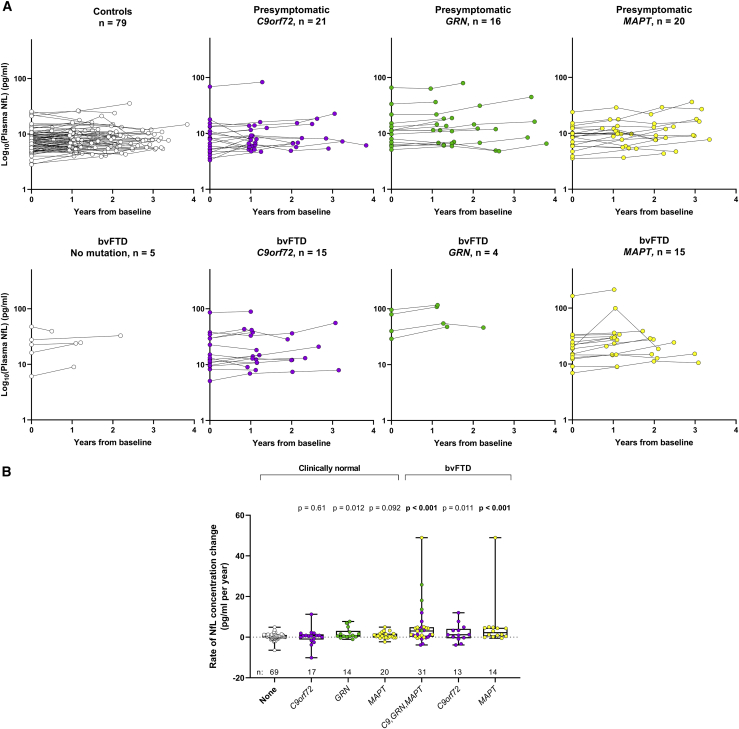
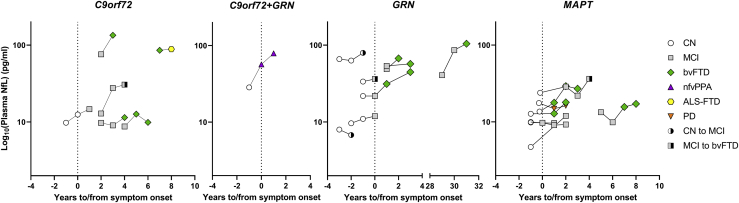
Frontotemporal dementia (FTD) therapy development is hamstrung by a lack of susceptibility, diagnostic, and prognostic biomarkers. Blood neurofilament light (NfL) shows promise as a biomarker, but studies have largely focused only on core FTD syndromes, often grouping patients with different diagnoses. To expedite the clinical translation of NfL, we avail ARTFL LEFFTDS Longitudinal Frontotemporal Lobar Degeneration (ALLFTD) study resources and conduct a comprehensive investigation of plasma NfL across FTD syndromes and in presymptomatic FTD mutation carriers. We find plasma NfL is elevated in all studied syndromes, including mild cases; increases in presymptomatic mutation carriers prior to phenoconversion; and associates with indicators of disease severity. By facilitating the identification of individuals at risk of phenoconversion, and the early diagnosis of FTD, plasma NfL can aid in participant selection for prevention or early treatment trials. Moreover, its prognostic utility would improve patient care, clinical trial efficiency, and treatment outcome estimations.
Trial registration: ClinicalTrials.gov NCT02372773 NCT02365922.
Keywords: Richardson’s syndrome; behavioral variant frontotemporal dementia; biomarker; corticobasal syndrome; neurofilament light; plasma; presymptomatic; primary progressive aphasia; progressive supranuclear palsy.
© 2022 The Author(s).
Conflict of interest statement
A.C.B. is site PI for the Alector INFRONT-3 trial. A.L.B. receives research support from NIH (R01AG038791, R01AG073482, and U24AG057437), Rainwater Charitable Foundation, Association for Frontotemporal Degeneration, Bluefield Project to Cure Frontotemporal Dementia, Alzheimer’s Drug Discovery Foundation, and the Alzheimer’s Association. He has served as a consultant for Alector, AGTC, Arkuda, Arvinas, AZTherapies, GSK, Oligomerix, Ono, Roche, Samumed, Stealth, Third Rock, Transposon, TrueBinding, and Wave and received research support from Biogen, Eisai, and Regeneron. B.F.B. has served as an investigator for clinical trials sponsored by Biogen, Alector, and EIP Pharma. He receives royalties from a published book entitled Behavioral Neurology of Dementia (Cambridge Medicine, 2009, 2017), serves on the Tau Consortium Scientific Advisory Board, and receives research support from the NIH. B.C.D. consults for Acadia, Arkuda, Axovant, Lilly, Biogen, Merck, Novartis, and Wave LifeSciences; has Elsevier editorial duties with payment (Neuroimage: Clinical and Cortex); and receives royalties from Oxford University Press and Cambridge University Press. K.D.-R. has research funding from Biogen and Lawson Health Research Institute and receives consultant fees from Biogen and educational fees from MedBridge. D.R.G. consults for Biogen, Fujirebio, and Amprion and is on the DSMB for Cognition Therapeutics. M.G. is participating in treatment trials sponsored by Alector, Prevail, and Passage Bio and is a consultant to Takeda, Passage Bio, and Biogen. N.G. has or is participating in clinical trials of anti-dementia drugs sponsored by Bristol Myers Squibb, Lilly/Avid Radiopharmaceuticals, Janssen, Novartis, Pfizer, and Wyeth. N.R.G.-R. has taken part in multicenter studies funded by Biogen, AbbVie, and Lilly. G.-Y.R.H. has received research support from Anavax, Biogen, and Roche. I.L. received support from Roche, Abbvie, Biogen, EIP-Pharma, and Biohaven Pharmaceuticals; was member of a Lundbeck Advisory Board; and receives salary from the University of California, San Diego and as Chief Editor of Frontiers in Neurology. J.C.M. participates on a speaker forum for Biogen and receives research support from Biogen, Eisai, Eli Lilly, Green Valley, and Novartis. C.U.O. is a consultant with Alector and Acadia and receives research funding from Alector. L.P. is a consultant for Expansion Therapeutics. E.D.R. receives funding from NIH, Alzheimer’s Drug Discovery Foundation, Bluefield Project, and Alector; consults for Biogen, AVROBIO, and AGTC; and owns intellectual property related to tau. J.C.R. is a site PI for Eli Lilly and Eisai clinical trials and receives research support from NIH K23AG059888. M.C.T. participates in clinical trials with Biogen, Avanex, UCB, and Janssen. Z.K.W. is supported by the NIH/NIA and NIH/NINDS (1U19AG063911, FAIN: U19AG063911), Mayo Clinic Center for Regenerative Medicine, Mayo Clinic in Florida Focused Research Team Program, the gifts from The Sol Goldman Charitable Trust, the Donald G. and Jodi P. Heeringa Family, the Haworth Family Professorship in Neurodegenerative Diseases fund, and The Albertson Parkinson’s Research Foundation. He serves as PI or co-PI on Biohaven Pharmaceuticals, Inc. (BHV4157-206 and BHV3241-301); Neuraly, Inc. (NLY01-PD-1); and Vigil Neuroscience, Inc. (VGL101–01.001) grants. He serves as co-PI of the Mayo Clinic APDA Center for Advanced Research and as an external advisory board member for Vigil Neuroscience, Inc. All other authors report no competing interests.
Figures
References
-
- Sjogren M., Rosengren L., Minthon L., Davidsson P., Blennow K., Wallin A. Cytoskeleton proteins in CSF distinguish frontotemporal dementia from AD. Neurology. 2000;54:1960–1964. - PubMed
Publication types
MeSH terms
Substances
Associated data
Grants and funding
- R01 AG073482/AG/NIA NIH HHS/United States
- R35 NS097273/NS/NINDS NIH HHS/United States
- K24 AG045333/AG/NIA NIH HHS/United States
- U24 AG021886/AG/NIA NIH HHS/United States
- U24 AG057437/AG/NIA NIH HHS/United States
- R01 AG038791/AG/NIA NIH HHS/United States
- U19 AG063911/AG/NIA NIH HHS/United States
- P01 AG019724/AG/NIA NIH HHS/United States
- K23 AG059888/AG/NIA NIH HHS/United States
- P01 NS084974/NS/NINDS NIH HHS/United States
- P30 AG072977/AG/NIA NIH HHS/United States
- U54 NS092089/NS/NINDS NIH HHS/United States
- K23 AG073514/AG/NIA NIH HHS/United States
- P30 AG066507/AG/NIA NIH HHS/United States
- L30 AG069301/AG/NIA NIH HHS/United States
- P01 NS099114/NS/NINDS NIH HHS/United States
- U01 AG045390/AG/NIA NIH HHS/United States
LinkOut - more resources
Full Text Sources
Other Literature Sources
Medical
