. 2022 Apr 19;3(4):100605.
doi: 10.1016/j.xcrm.2022.100605.

A network-based approach to identify expression modules underlying rejection in pediatric liver transplantation

Affiliations

A network-based approach to identify expression modules underlying rejection in pediatric liver transplantation

Mylarappa Ningappa et al. Cell Rep Med. .

Abstract

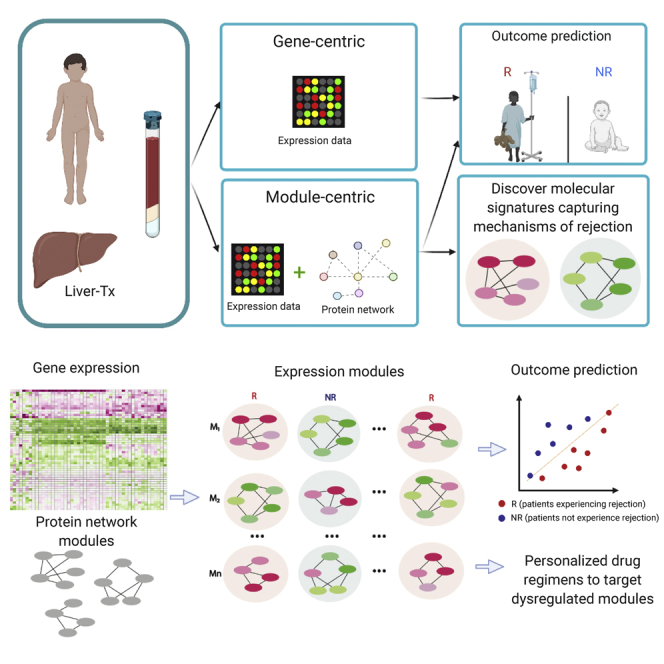
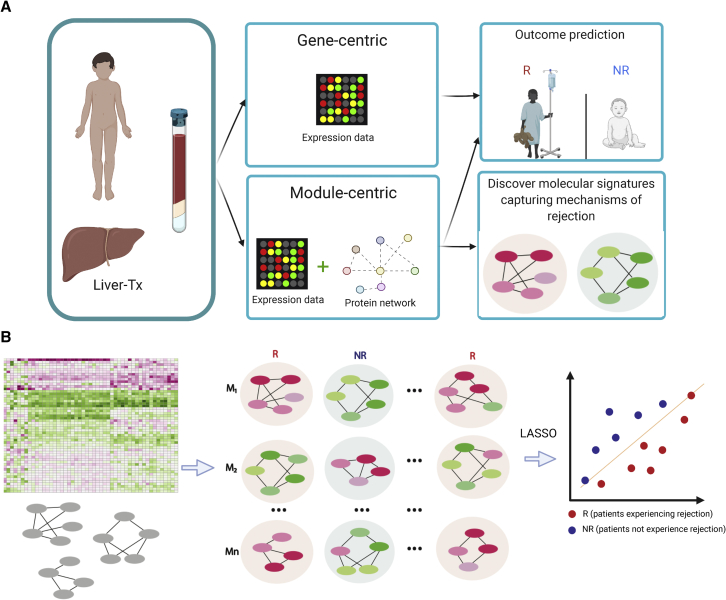
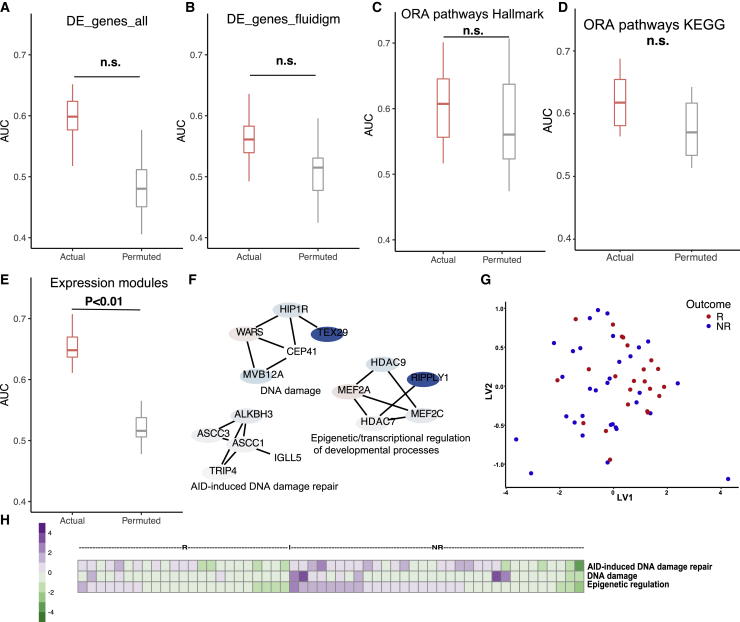
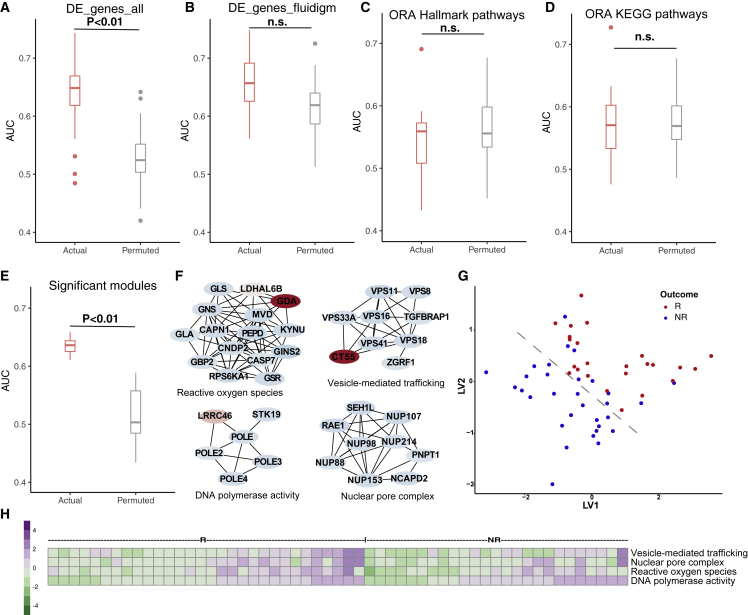
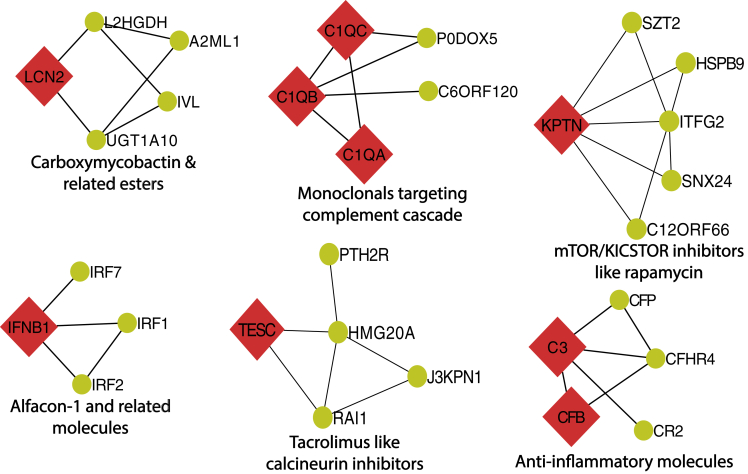
Selecting the right immunosuppressant to ensure rejection-free outcomes poses unique challenges in pediatric liver transplant (LT) recipients. A molecular predictor can comprehensively address these challenges. Currently, there are no well-validated blood-based biomarkers for pediatric LT recipients before or after LT. Here, we discover and validate separate pre- and post-LT transcriptomic signatures of rejection. Using an integrative machine learning approach, we combine transcriptomics data with the reference high-quality human protein interactome to identify network module signatures, which underlie rejection. Unlike gene signatures, our approach is inherently multivariate and more robust to replication and captures the structure of the underlying network, encapsulating additive effects. We also identify, in an individual-specific manner, signatures that can be targeted by current anti-rejection drugs and other drugs that can be repurposed. Our approach can enable personalized adjustment of drug regimens for the dominant targetable pathways before and after LT in children.

Keywords: liver transplantation; molecular diagnostics; network systems biology; pediatric samples; rejection; systems immunology.


Conflict of interest statement

The authors declare no competing interests.

Figures

None
Graphical abstract
Figure 1
Figure 1
Uncovering biomarkers and molecular signatures of LT outcomes (A) Conceptual overview of gene- and network-centric approaches to identify biomarkers and molecular signatures, respectively, of pediatric LT outcomes (generated using BioRender). (B) Schematic summarizing keys steps of the network-based approach: construction of expression modules followed by LASSO-based feature selection to identify network modules driving LT outcomes (generated using BioRender).
Figure 2
Figure 2
Gene-based biomarkers of LT outcomes identified using pre- and post-LT transcriptomics datasets (A) Heatmap illustrating the 55 DEGs with AUC greater than 0.6 identified using pre-LT transcriptomics data. (B) Heatmap with a subset of the DEGs in (A) that pass Fluidigm validation. (C) Heatmap illustrating the 50 DEGs with AUC greater than 0.6 identified using early post-LT transcriptomics data. (D) Heatmap with a subset of the DEGs in (C) that pass Fluidigm validation. (E) Heatmap illustrating the 36 DEGs with AUC greater than 0.6 identified using late post-LT transcriptomics data. (F) Heatmap with a subset of the DEGs in (E) that pass Fluidigm validation.
Figure 3
Figure 3
Network-based molecular signatures of outcomes identified by combining pre-LT transcriptomics data with the reference human protein interactome network (A) Evaluation of the predictive power of the gene signature from Figure 2A, evaluated in a cross-validation framework with permutation testing. “Actual” denotes the performance of the model, built on real data, across replicates of k-fold cross-validation. “Permuted” denotes performance of the model on shuffled data in a matched cross-validation framework (negative control). (B) Evaluation of the predictive power of the gene signature from Figure 2B, evaluated in a cross-validation framework with permutation testing. “Actual” denotes the performance of the model, built on real data, across replicates of k-fold cross-validation. “Permuted” denotes performance of the model on shuffled data in a matched cross-validation framework (negative control). (C) Evaluation of the predictive power of a signature consisting of Hallmark pathways in which the DEGs are over-represented, evaluated in a cross-validation framework with permutation testing. “Actual” denotes the performance of the model, built on real data, across replicates of k-fold cross-validation. “Permuted” denotes performance of the model on shuffled data in a matched cross-validation framework (negative control). (D) Evaluation of the predictive power of a signature consisting of KEGG pathways in which the DEGs are over-represented, evaluated in a cross-validation framework with permutation testing. “Actual” denotes the performance of the model, built on real data, across replicates of k-fold cross-validation. “Permuted” denotes performance of the model on shuffled data in a matched cross-validation framework (negative control). (E) Evaluation of the predictive power of the network-based molecular signatures in a cross-validation framework with permutation testing. The network-based signatures are identified by LASSO-based feature selection on expression modules constructed by combining pre-LT transcriptomics data with the reference human protein interactome network. “Actual” denotes the performance of the model, built on real data, across replicates of k-fold cross-validation. “Permuted” denotes performance of the model on shuffled data in a matched cross-validation framework (negative control). (F) Visualization of the network module signatures from the model in (E). Red denotes higher median expression in R subjects, and blue denotes median higher expression in NR subjects. (G) PLS-DA using only the network module signatures from the model in (E) to discriminate between R and NR subjects. (H) Heatmap visualizing the variation of the module-specific features across R and NR subjects.
Figure 4
Figure 4
Network-based molecular signatures of outcomes identified by combining early post-LT transcriptomics data with the reference human protein interactome network (A) Evaluation of the predictive power of the gene signature from Figure 2C, evaluated in a cross-validation framework with permutation testing. “Actual” denotes the performance of the model, built on real data, across replicates of k-fold cross-validation. “Permuted” denotes performance of the model on shuffled data in a matched cross-validation framework (negative control). (B) Evaluation of the predictive power of the gene signature from Figure 2D, evaluated in a cross-validation framework with permutation testing. “Actual” denotes the performance of the model, built on real data, across replicates of k-fold cross-validation. “Permuted” denotes performance of the model on shuffled data in a matched cross-validation framework (negative control). (C) Evaluation of the predictive power of a signature consisting of Hallmark pathways in which the DEGs are over-represented, evaluated in a cross-validation framework with permutation testing. “Actual” denotes the performance of the model, built on real data, across replicates of k-fold cross-validation. “Permuted” denotes performance of the model on shuffled data in a matched cross-validation framework (negative control). (D) Evaluation of the predictive power of a signature consisting of KEGG pathways in which the DEGs are over-represented, evaluated in a cross-validation framework with permutation testing. “Actual” denotes the performance of the model, built on real data, across replicates of k-fold cross-validation. “Permuted” denotes performance of the model on shuffled data in a matched cross-validation framework (negative control). (E) Evaluation of the predictive power of the network-based molecular signatures in a cross-validation framework with permutation testing. The network-based signatures are identified by LASSO-based feature selection on expression modules constructed by combining post-LT transcriptomics data with the reference human protein interactome network. “Actual” denotes the performance of the model, built on real data, across replicates of k-fold cross-validation. “Permuted” denotes performance of the model on shuffled data in a matched cross-validation framework (negative control). (F) Visualization of the network module signatures from the model in (E). Red denotes higher median expression in R subjects, and blue denotes median higher expression in NR subjects. (G) PLS-DA using only the network module signatures from the model in (E) to discriminate between R and NR subjects. (H) Heatmap visualizing the variation of the module-specific features across R and NR subjects.
Figure 5
Figure 5
Network-based molecular signatures of outcomes identified by combining late post-LT transcriptomics data with the reference human protein interactome network (A) Evaluation of the predictive power of the gene signature from Figure 2E, evaluated in a cross-validation framework with permutation testing. “Actual” denotes the performance of the model, built on real data, across replicates of k-fold cross-validation. “Permuted” denotes performance of the model on shuffled data in a matched cross-validation framework (negative control). (B) Evaluation of the predictive power of the gene signature from Figure 2F, evaluated in a cross-validation framework with permutation testing. “Actual” denotes the performance of the model, built on real data, across replicates of k-fold cross-validation. “Permuted” denotes performance of the model on shuffled data in a matched cross-validation framework (negative control). (C) Evaluation of the predictive power of a signature consisting of Hallmark pathways in which the DEGs are over-represented, evaluated in a cross-validation framework with permutation testing. “Actual” denotes the performance of the model, built on real data, across replicates of k-fold cross-validation. “Permuted” denotes performance of the model on shuffled data in a matched cross-validation framework (negative control). (D) Evaluation of the predictive power of a signature consisting of KEGG pathways in which the DEGs are over-represented, evaluated in a cross-validation framework with permutation testing. “Actual” denotes the performance of the model, built on real data, across replicates of k-fold cross-validation. “Permuted” denotes performance of the model on shuffled data in a matched cross-validation framework (negative control). (E) Evaluation of the predictive power of the network-based molecular signatures in a cross-validation framework with permutation testing. The network-based signatures are identified by LASSO-based feature selection on expression modules constructed by combining late post-LT transcriptomics data with the reference human protein interactome network. “Actual” denotes the performance of the model, built on real data, across replicates of k-fold cross-validation. “Permuted” denotes performance of the model on shuffled data in a matched cross-validation framework (negative control). (F) Visualization of the network module signatures from the model in (E). Red denotes higher median expression in R subjects, and blue denotes median higher expression in NR subjects. (G) PLS-DA using only the network module signatures from the model in (E) to discriminate between R and NR subjects. (H) Heatmap visualizing the variation of the module-specific features across R and NR subjects.
Figure 6
Figure 6
Druggable network modules before LT Network module signatures of LT outcomes, identified using pre-LT transcriptomics data, that are the targets of known drugs. Red rhombuses denote genes, in that module, directly targeted by the corresponding drug.

Similar articles

Cited by

References

    1. Jain A., Mazariegos G., Kashyap R., Kosmach-Park B., Starzl T.E., Fung J., Reyes J. Pediatric liver transplantation. A single center experience spanning 20 years. Transplantation. 2002;73:941–947. doi: 10.1097/00007890-200203270-00020. - DOI - PMC - PubMed
    1. Waki K., Sugawara Y., Mizuta K., Fujita H., Kadowaki T., Kokudo N. Living-donor liver transplantation at the University of Tokyo, 1996-2011: the impact of HLA matching and a positive crossmatch on long-term survival and tolerance. Clin. Transpl. 2011:223–235. - PubMed
    1. Coelho T., Tredger M., Dhawan A. Current status of immunosuppressive agents for solid organ transplantation in children. Pediatr. Transpl. 2012;16:106–122. doi: 10.1111/j.1399-3046.2012.01644.x. - DOI - PubMed
    1. Jain A., Demetris A.J., Kashyap R., Blakomer K., Ruppert K., Khan A., Rohal S., Starzl T.E., Fung J.J. Does tacrolimus offer virtual freedom from chronic rejection after primary liver transplantation? Risk and prognostic factors in 1,048 liver transplantations with a mean follow-up of 6 years. Liver Transpl. 2001;7:623–630. doi: 10.1053/jlts.2001.25364. - DOI - PMC - PubMed
    1. Ashokkumar C., Talukdar A., Sun Q., Higgs B.W., Janosky J., Wilson P., Mazariegos G., Jaffe R., Demetris A., Dobberstein J., et al. Allospecific CD154+ T cells associate with rejection risk after pediatric liver transplantation. Am. J. Transpl. 2009;9:179–191. doi: 10.1111/j.1600-6143.2008.02459.x. - DOI - PMC - PubMed

Publication types

Substances