

An unusually high upper thermal acclimation potential for rainbow trout
- PMID: 35492409
- PMCID: PMC9040278
- DOI: 10.1093/conphys/coab101
An unusually high upper thermal acclimation potential for rainbow trout
Abstract
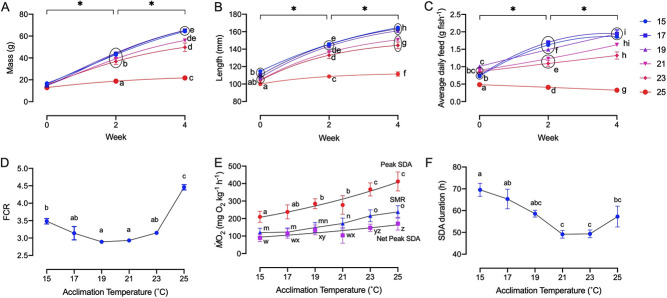
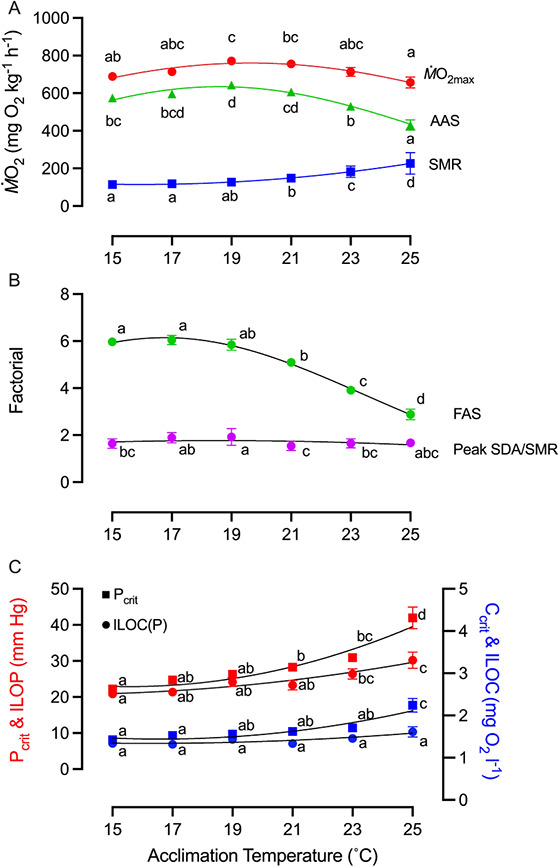
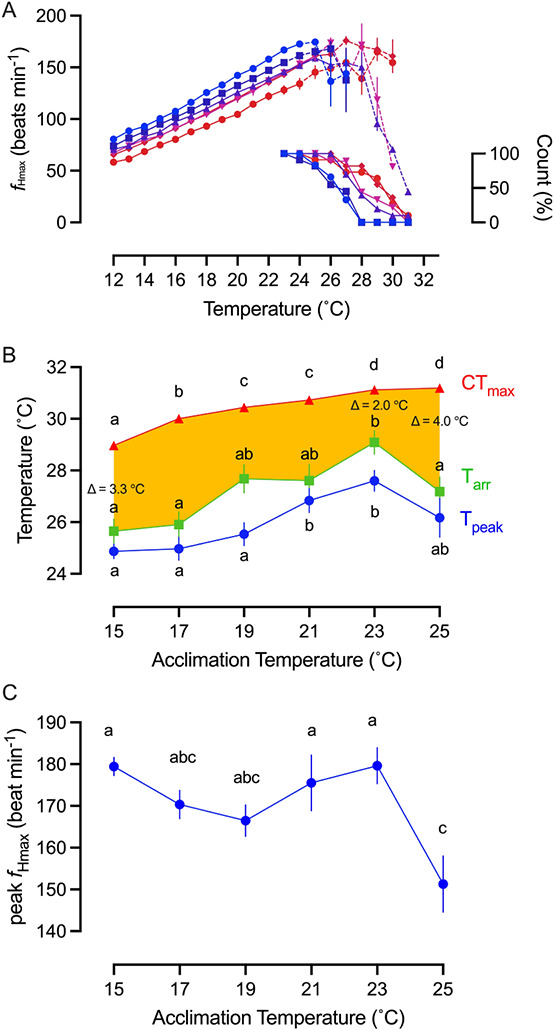
Thermal acclimation, a compensatory physiological response, is central to species survival especially during the current era of global warming. By providing the most comprehensive assessment to date for the cardiorespiratory phenotype of rainbow trout (Oncorhynchus mykiss) at six acclimation temperatures from 15°C to 25°C, we tested the hypothesis that, compared with other strains of rainbow trout, an Australian H-strain of rainbow trout has been selectively inbred to have an unusually high and broad thermal acclimation potential. Using a field setting at the breeding hatchery in Western Australia, thermal performance curves were generated for a warm-adapted H-strain by measuring growth, feed conversion efficiency, specific dynamic action, whole-animal oxygen uptake (ṀO2) during normoxia and hypoxia, the critical maximum temperature and the electrocardiographic response to acute warming. Appreciable growth and aerobic capacity were possible up to 23°C. However, growth fell off drastically at 25°C in concert with increases in the time required to digest a meal, its total oxygen cost and its peak ṀO2. The upper thermal tipping points for appetite and food conversion efficiency corresponded with a decrease in the ability to increase heart rate during warming and an increase in the cost to digest a meal. Also, comparison of upper thermal tipping points provides compelling evidence that limitations to increasing heart rate during acute warming occurred well below the critical thermal maximum (CTmax) and that the faltering ability of the heart to deliver oxygen at different acclimation temperatures is not reliably predicted by CTmax for the H-strain of rainbow trout. We, therefore, reasoned the remarkably high thermal acclimation potential revealed here for the Australian H-strain of rainbow trout reflected the existing genetic variation within the founder Californian population, which was then subjected to selective inbreeding in association with severe heat challenges. This is an encouraging discovery for those with conservation concerns for rainbow trout and other fish species. Indeed, those trying to predict the impact of global warming should more fully consider the possibility that the standing intra-specific genetic variation within a fish species could provide a high thermal acclimation potential, similar to that shown here for rainbow trout.
Keywords: aerobic capacity; digestion; growth; heart rate; hypoxia; standing variation.
© The Author(s) 2022. Published by Oxford University Press and the Society for Experimental Biology.
Figures
 ), 17°C (
 ), 19°C (
 ), 21°C (
 ), 23°C (
 ) and 25°C (
 ). Data points are connected by a solid line provided all fish in an acclimation group retained a rhythmic heartbeat at that temperature. If not a broken line connects the average fHmax for the fish the still retained a rhythmic heartbeat, with the percentage count remaining indicated in the inset. All individual fish had developed an arrhythmic heartbeat by 31°C and by 28°C for those at the two coldest acclimation temperatures. (B) Temperature at which each acclimation group reached its CTmax (n = 10), cardiac arrhythmia temperature (Tarr) and maximum fHmax (Tpeak). Amber area labels the difference between whole-organism and tissue thermal tolerance and the differences between CTmax and Tarr at 15°C, 23°C and 25°C acclimation temperature are denoted. Two-way ANOVA performed indicates Tarr is significantly different from CTmax (F = 213.2, P < 0.0001). (C) Peak fHmax reached at each acclimation temperature (n = 12). All values are presented as means ± sem, except right y-axis in (A) presented as count in %. (sem may be hidden by the symbol). Dissimilar letters represent statistically significant differences among mean values for that variable.
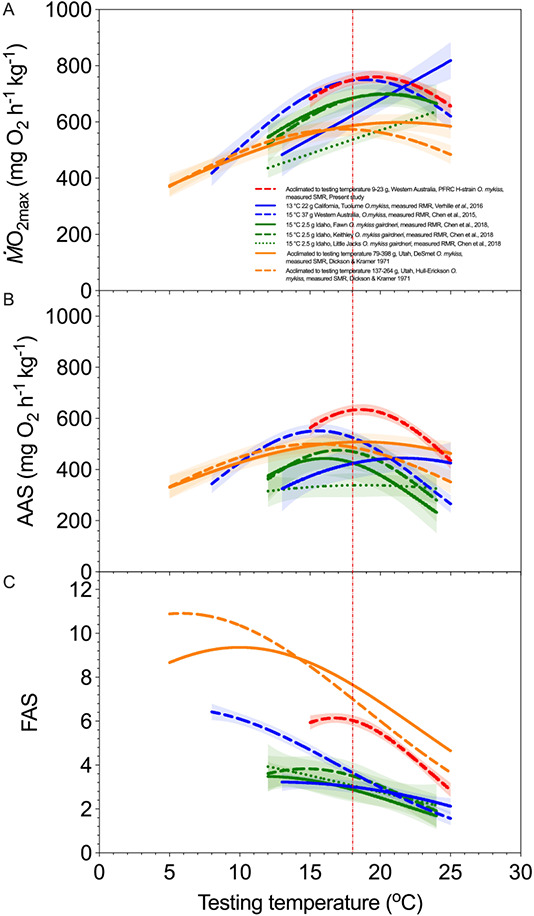
References
-
- Anttila K, Courturier CS, Øverli Ø, Johnsen A, Marthinsen G, Nilsson GE, Farrell AP (2014) Atlantic salmon show capability for cardiac acclimation to warm temperatures. Nat Commun 5: 1–6. - PubMed
-
- Becker CD, Wolford MG (1980) Thermal Resistance of Juvenile Salmonids Sublethally Exposed to Nickel, Determined by the Critical Thermal Maximum Method. Environmental Pollution (Barking, Essex: 1987) 21: 181–189.
-
- Beitinger T, Bennett W, McCauley R (2000) Temperature tolerances of North American freshwater fishes exposed to dynamic changes in temperature. Environ Biol Fishes 58: 237–275.
-
- Casselman MT, Anttila K, Farrell AP (2012) Using maximum heart rate as a rapid screening tool to determine optimum temperature for aerobic scope in Pacific salmon Oncorhynchus spp. J Fish Biol 80: 358–377. - PubMed
-
- Chabot D, Koenker R, Farrell AP (2016a) The measurement of specific dynamic action in fishes: measuring SDA in fishes. J Fish Biol 88: 152–172. - PubMed
LinkOut - more resources
Full Text Sources
