. 2022 Apr 15:13:835993.
doi: 10.3389/fpsyt.2022.835993. eCollection 2022.

Prenatal GABAB Receptor Agonist Administration Corrects the Inheritance of Autism-Like Core Behaviors in Offspring of Mice Prenatally Exposed to Valproic Acid

Affiliations

Prenatal GABAB Receptor Agonist Administration Corrects the Inheritance of Autism-Like Core Behaviors in Offspring of Mice Prenatally Exposed to Valproic Acid

Shucai Jiang et al. Front Psychiatry. .

Abstract

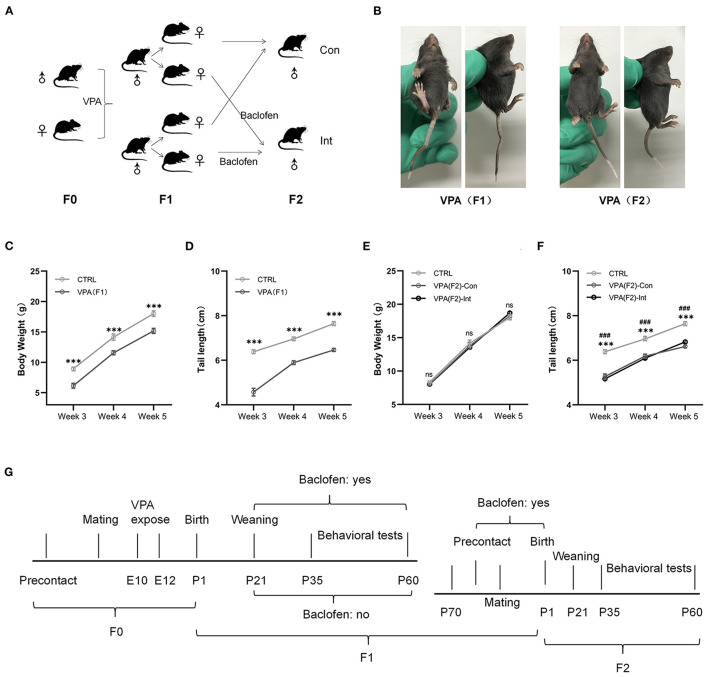
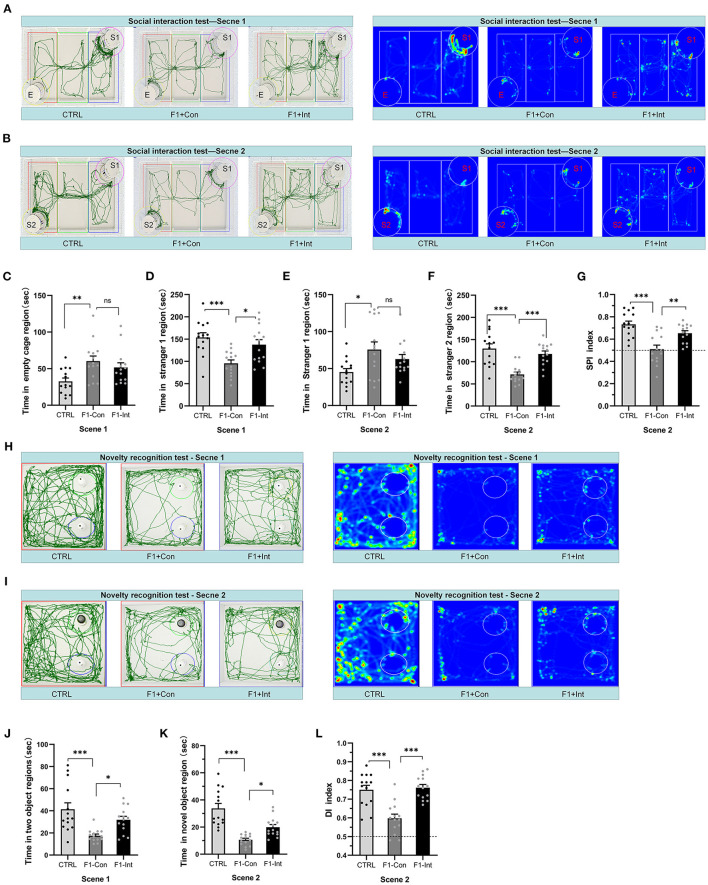
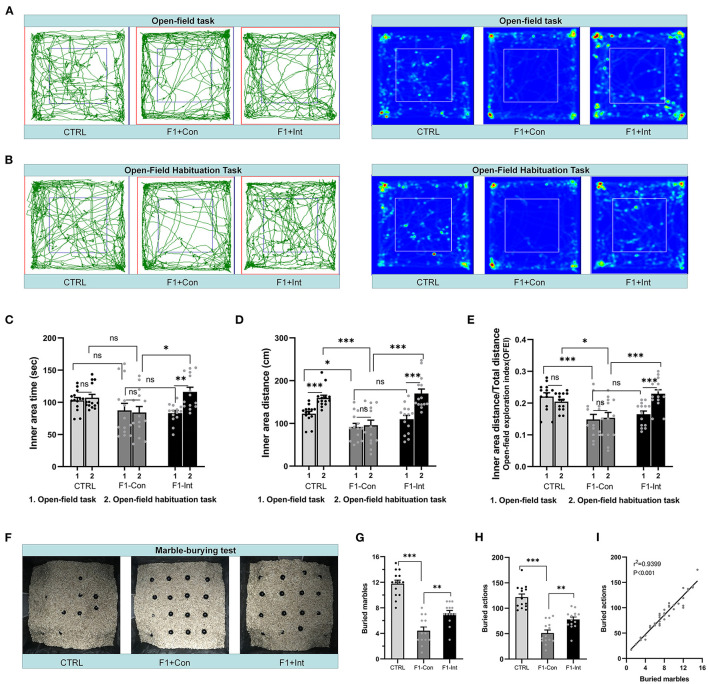
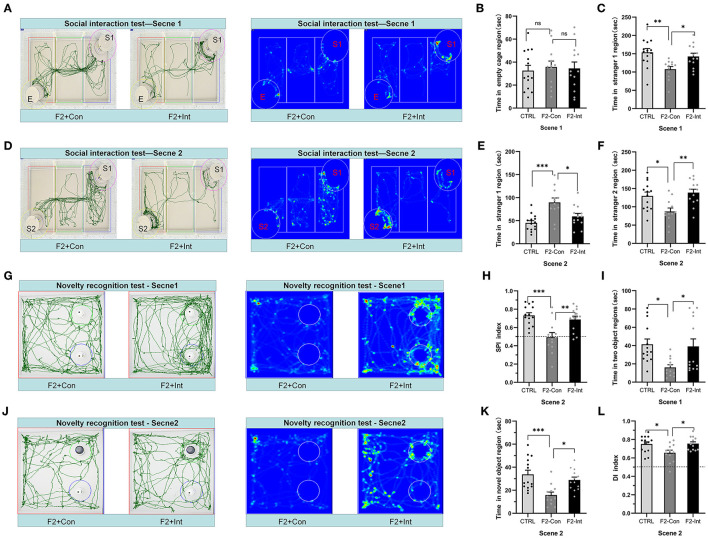
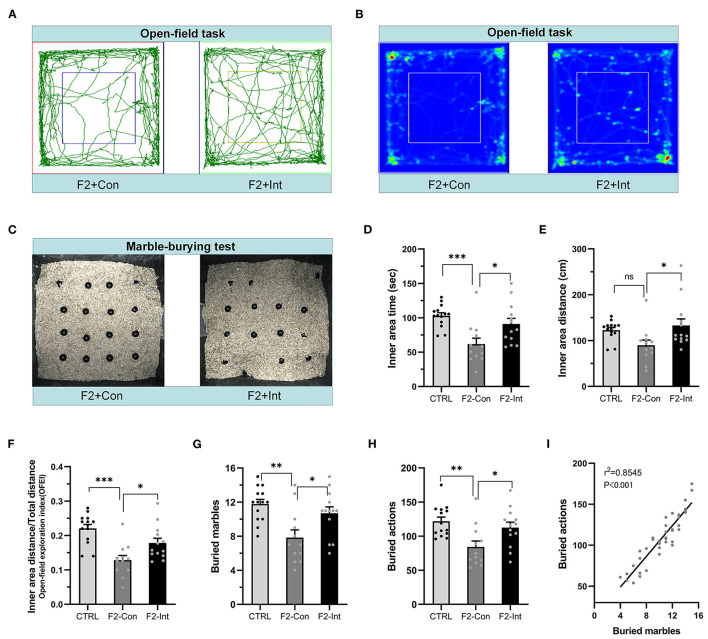
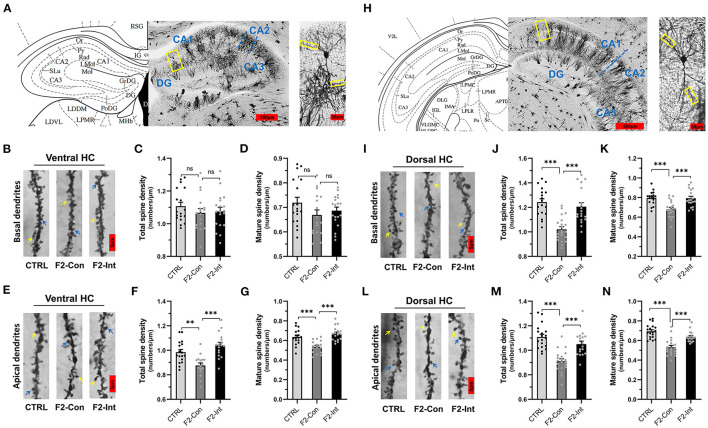
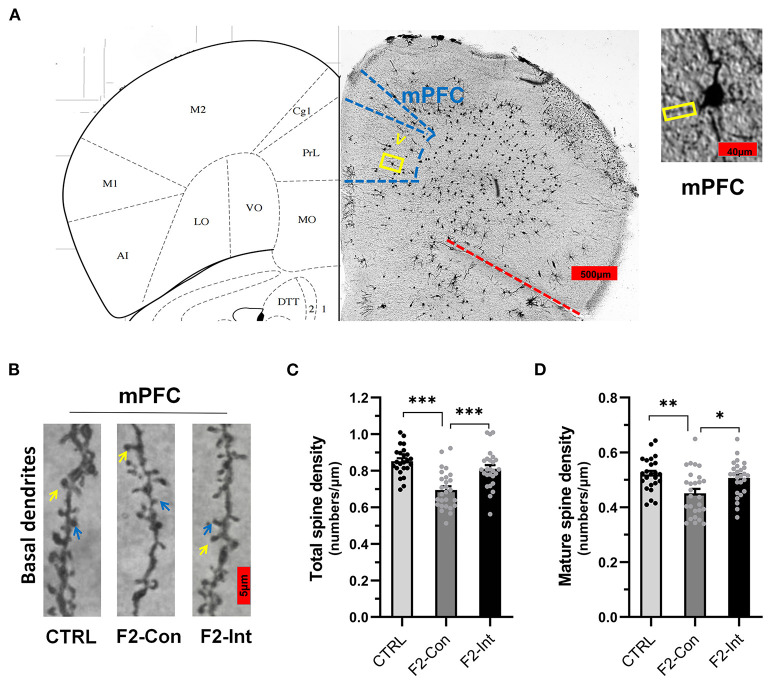
This study was performed to evaluate the effects of prenatal baclofen (a GABAB receptor agonist) treatment on the inheritance of autism-like behaviors in valproic acid (VPA)-exposed mice. VPA model mice (first generation, F1) that were prenatally exposed to VPA exhibited robust core autism-like behaviors, and we found that oral administration of baclofen to F1 mice corrected their autism-like behavioral phenotypes at an early age. Based on a previous epigenetics study, we mated the F1 male offspring with litter females to produce the second generation (F2). The F2 male mice showed obvious inheritance of autism-like phenotypes from F1 mice, implying the heritability of autism symptoms in patients with prenatal VPA exposure. Furthermore, we found prenatal baclofen administration was associated with beneficial effects on the autism-like phenotype in F2 male mice. This may have involved corrections in the density of total/mature dendritic spines in the hippocampus (HC) and medial prefrontal cortex (mPFC), normalizing synaptic plasticity. In this research, GABAB receptor agonist administration corrected the core autism-like behaviors of F1 mice and protected against the inheritance of neurodevelopmental disorders in the offspring of F1 mice, suggesting the potential of early intervention with GABAB receptor agonists in the treatment of neurodevelopmental disorders.

Keywords: GABAB; autism spectrum disorder (ASD); baclofen; inheritance; mice; valproic acid (VPA).


Conflict of interest statement

The authors declare that the research was conducted in the absence of any commercial or financial relationships that could be construed as a potential conflict of interest.

Figures

Figure 1
Figure 1
F1 mice exhibited delayed growth and tail malformations, and F2 mice exhibited delayed tail growth without malformation. (A) The schematic diagram of F1 and F2 mice breeding. (B) The pictures of F1 mice show a tail deformity, and F2 mice did not show any tail deformity. (C,D) The body weight and tail length of male F1 mice were lower than those of male control mice from postnatal week 3–week 5 [two-way analysis of variance (ANOVA) followed by Bonferroni post-hoc test, n (CTRL vs. F1) = 14:14, ***p < 0.001]. (E,F) Compared to CTRL group mice, male F2-Con (without prenatal baclofen intervention) and male F2-Int (with prenatal baclofen intervention) mice did not show a significant difference in body weight, but the tail length of F2-Con and F2-Int mice was lower than that of male CTRL group mice in postnatal week 3–week 5 [two-way analysis of variance (ANOVA) followed by Bonferroni post-hoc test, n (CTRL vs. F2-Con vs. F2-Int) = 14:12:13, ***p < 0.001]. All data for all figures are plotted as the mean ± SEM. (G) A representative timeline of the experimental process. E: embryonic day; P: postnatal day; F0: CTRL mice; F1: first-generation mice (VPA-exposed mice); F2: second-generation mice (offspring of VPA-exposed mice); F1-Con: F1 mice with no oral baclofen treatment; F1-Int: F1 mice with oral baclofen treatment; F2-Con: F2 mice with no prenatal baclofen treatment; F2-Int: F2 mice with prenatal baclofen treatment; # indicates a comparison between the CTRL group and F2-Con groups; * indicates a comparison between the control (CTRL) group and F2-Int groups.
Figure 2
Figure 2
Baclofen treatment corrected social interaction and novelty recognition deficits in F1 mice. S1 = stranger 1 mouse; S2 = stranger 2 mouse; E = empty. (A) Representative traces and heatmaps of mice in the sociability phase (scene 1). (B) Representative traces and heatmaps of mice in the preference for the social novelty phase (scene 2). (C) The time that tested mice entered the region of empty cage for sniffing in scene 1. (D) The time that tested mice entered the region containing stranger 1 for sniffing in scene 1. (E) The time that tested mice entered the region containing stranger 1 for sniffing in scene 2. (F) The time that tested mice entered the region containing stranger 2 for sniffing in scene 2. (G) The SPI of tested mice in scene 2. (H,I) Representative traces and heatmaps of tested mice in the novel object recognition task. (H) Traces of mice exploring the regions containing the two similar objects (white plastic bottles) in phase 1 (scene 1). (I) Traces of mice exploring the region containing the novel object (black glass bottle) in phase 2 (scene 2). This test was used to assess novelty recognition ability. (J) The total time spent sniffing the two objects by each group of mice in scene 1. (K) The time spent sniffing the novel object by each group of mice in scene 2. (L) The discrimination index (DI) for each group of mice in scene 2. (C–G,J–L) One-way ANOVA followed by the Bonferroni post-hoc test was used: *p < 0.05, **p < 0.01, ***p < 0.001. All data for all figures are plotted as the mean ± SEM. Each group had 14 mice (n = 14)
Figure 3
Figure 3
Baclofen treatment corrected the locomotor, exploratory activity and marble-burying deficits in F1 mice. (A,B) Representative traces and heatmaps of mice in the open-field task (task 1) and open-field habituation task (task 2). (C) Time traveled in the inner zone by mice in the two open-field tasks. (D) Distance traveled by mice in the inner zone in the two open-field tests. (E) The open-field exploration index (OFEI = distance traveled in the inner zone/the total distance traveled) of mice in the two open-field tasks. In (C–E), Student's paired t-test was used to compare the differences in behavior in the two tasks between each group of mice, and one-way ANOVA followed by the Bonferroni post-hoc test was used to compare the difference in the same task across the four groups; *p < 0.05, **p < 0.01 ***p < 0.001. All data for all figures are plotted as the mean ± SEM. Each group had 14 mice (n = 14). (F) Representative marble-burying maps after the marble-burying test. (G) The numbers of buried marbles for each group of mice. (H) The number of burying actions for each group of mice. In (G,H), one-way ANOVA followed by the Bonferroni post-hoc test was used to compare the differences among groups; **p < 0.01, ***p < 0.001. All data for all figures are plotted as the mean ± SEM. Each group had 14 mice (n = 14). (I) Pearson correlation and linear regression analysis between the number of buried marbles and the number of burying actions. All mice were included (n = 42) in the analysis, and there was a linear correlation between the number of buried marbles and the number of burying actions.
Figure 4
Figure 4
Prenatal baclofen administration corrected social interaction deficits and novelty recognition deficits in F2 mice in the social interaction test. (A,D) In the social interaction test, representative traces and heatmaps from tested mice in the sociability phase (scene 1) and preference for social novelty phase (scene 2). (B) The time that tested mice entered the region of empty cage for sniffing in scene 1 of the social interaction test. (C) The time that tested mice entered the region containing stranger 1 for sniffing in scene 1 of the social interaction test. (E) The time that tested mice entered the region containing stranger 1 for sniffing in scene 2 of the social interaction test. (F) The time that tested mice entered the region containing stranger 2 for sniffing in scene 2 of the social interaction test. (G,J) Representative traces of tested mice in the novel object recognition task. (G) Traces and heatmaps of mice exploring the regions containing the two similar objects (white plastic bottles) in phase 1 (scene 1). (H) The SPI of tested mice in scene 2 of the social interaction test. (I) The total time spent sniffing the two objects by each group of mice in scene 1 of the novel object recognition task. (J) Traces and heatmaps of mice exploring the region containing the novel object (black glass bottle) in phase 2 (scene 2) of the novel object recognition task. This test was used to assess novelty recognition ability. (K) The time spent sniffing the novel object by each group of mice in scene 2 of the novel object recognition task. (L) The discrimination index (DI) for each group of mice in scene 2 of the novel object recognition task. (B,C,E,F,H,I,K,L) One-way ANOVA followed by the Bonferroni post hoc test was used to compare the differences among groups: *p < 0.05, **p < 0.01, ***p < 0.001. All data for all figures are plotted as the mean ± SEM. n (CTRL: F2-Con: F2-Int) = 14:12:13.
Figure 5
Figure 5
Prenatal baclofen administration corrected locomotor, exploratory activity, and marble-burying deficits in F2 mice. (A) Representative traces of mice in the open-field task. (B) Representative heatmaps of traces of mice corresponding to (A). (C) Representative marble-burying maps after the marble-burying test. (D) Time traveled in the inner zone by mice. (E) Distance traveled in the inner zone by mice. (F) The open-field exploration index (OFEI = distance traveled in the inner zone/the total distance traveled) of mice. (G) The numbers of buried marbles of mice. (H) The number of burying actions of mice. In (D–H) and (G–I), one-way ANOVA followed by the Bonferroni post-hoc test was used to compare the differences among groups: *p < 0.05, **p < 0.01 ***p < 0.001. All data for all figures are plotted as the mean ± SEM. n (CTRL: F2-Con: F2-Int) = 14:12:13. (I) Pearson correlation and linear regression analysis between the number of buried marbles and the number of burying actions. All mice were included (n = 39) in the analysis, and there was a linear correlation between the number of buried marbles and the number of burying actions.
Figure 6
Figure 6
Prenatal baclofen administration corrected the defects in dendritic spines density of CA1 pyramidal neurons in the HC in F2 mice. (A) A composite of a representative scanned image of Golgi-Cox-stained slices of the ventral HC and the mouse brain map from The Mouse Brain in Stereotaxic Coordinates; scale bar: 300 and 30 μm. (A/H) The part inside the yellow rectangle is the neurons and dendrites selected for analysis. The spines were selected from grade 3 basal dendrites and grade 6/7 apical dendrites for analysis. (B/E) Representative three-dimensional reconstructed images of the basal/apical dendrites of pyramidal neurons in the CA1 of the ventral HC obtained from CTRL, F2-Con and F2-Int mice. The yellow arrow points to a mushroom spine, and the blue arrow points to a stubby spine. Scale bar: 5 μm. (C,D) Summary of spine density on the basal dendrites of CA1 pyramidal neurons in the ventral HC. Mature spines = mushroom spines + stubby spines (CTRL: n = 18 dendrites from 3 mice; F2-Con: n = 17 dendrites from 3 mice; F2-Int: n = 19 dendrites from 3 mice). (F,G) Summary of spine density on the apical dendrites of CA1 pyramidal neurons in the ventral HC. Mature spines = mushroom spines + stubby spines (CTRL: n = 17 dendrites from 3 mice; F2-Con: n = 16 dendrites from 3 mice; F2-Int: n = 17 dendrites from 3 mice). (H) A composite of a representative scanned image of Golgi-Cox-stained slices of the dorsal HC and the mouse brain map from The Mouse Brain in Stereotaxic Coordinates; scale bar: 500 and 30 μm. (I/L) Representative three-dimensional reconstructed images of the basal/apical dendrites of pyramidal neurons in the CA1 of the dorsal HC. The yellow arrow points to the mushroom spine, and the blue arrow points to the stubby spine. Scale bar: 5 μm. (J,K) Summary of spine density on the basal dendrites of CA1 pyramidal neurons in the HC (CTRL: n = 18 dendrites from 3 mice; F2-Con: n = 21 dendrites from 3 mice; F2-Int: n = 19 dendrites from 3 mice). (M,N) Summary of spine density on the apical dendrites of CA1 dorsal neurons in the dorsal HC. Mature spines = mushroom spines + stubby spines (CTRL: n = 19 dendrites from 3 mice; F2-Con: n =20 dendrites from 3 mice; F2-Int: n = 17 dendrites from 3 mice). One-way ANOVA followed by the Bonferroni post-hoc test was used to compare the differences among the four groups; *p < 0.05, **p < 0.01, ***p < 0.001. All data for all figures are plotted as the mean ± SEM.
Figure 7
Figure 7
Prenatal baclofen administration corrected the defects in dendritic spines density of pyramidal neurons in the mPFC in F2 mice. (A) A composite of a representative scanned image of Golgi-Cox-stained slices of the mPFC and the mouse brain map from The Mouse Brain in Stereotaxic Coordinates; scale bar: 500 and 40 μm. (B) The part inside the yellow rectangle is the neurons and dendrites selected from layer V in the mPFC for analysis. The spines were selected from grade 3 basal dendrites for analysis. The yellow arrow points to a mushroom spine, and the blue arrow points to a stubby spine. Scale bar: 5 μm. (C,D) Summary of spine density on the basal dendrites of mPFC pyramidal neurons. Mature spines = mushroom spines + stubby spines (CTRL: n = 24 dendrites from 3 mice; F2-Con: n = 27 dendrites from 3 mice; F2-Int: n = 26 dendrites from 3 mice). One-way ANOVA followed by the Bonferroni post-hoc test was used to compare the differences among the four groups; *p < 0.05, **p < 0.01, ***p < 0.001. All data for all figures are plotted as the mean ± SEM.

Similar articles

Cited by

References

    1. American Psychiatric Association DSM- Task Force Arlington VA US . Diagnostic and statistical manual of mental disorders: DSM-5™ (5th ed.). Codas. (2013) 25:191. 10.1080/09687599.2015.1062233 - DOI - PubMed
    1. Volkmar FR, Woodbury-Smith M, Macari SL, Øien RA. Seeing the forest and the trees: disentangling autism phenotypes in the age of DSM-5. Dev Psychopathol. (2021) 33:625–33. 10.1017/S0954579420002047 - DOI - PubMed
    1. Carbone E, Manduca A, Cacchione C, Vicari S, Trezza V. Healing autism spectrum disorder with cannabinoids: a neuroinflammatory story. Neurosci Biobehav Rev. (2021) 121:128–43. 10.1016/j.neubiorev.2020.12.009 - DOI - PubMed
    1. Prevalence Prevalence and characteristics of autism spectrum disorder among children aged 8 years — autism and developmental disabilities monitoring network 11 sites, United States, 2012 . MMWR Surveill Summ. (2016) 65:1–23. 10.15585/mmwr.ss6513a1 - DOI - PMC - PubMed
    1. Christensen Deborah L, Maenner Matthew J, Deborah B, Constantino John N, Julie D, Durkin Maureen S, et al. . Prevalence and characteristics of autism spectrum disorder among children aged 4 years - early autism and developmental disabilities monitoring network, seven sites, United States, 2010, 2012, and 2014. MMWR Surveill Summ. (2019) 68:1–19. 10.15585/mmwr.ss6802a1 - DOI - PMC - PubMed